Zip Codes with the Highest Percentage of Population Employed in Food Preparation & Serving in Waycross, GA
RELATED REPORTS & OPTIONS
Food Preparation & Serving
Waycross
Compare Zip Codes
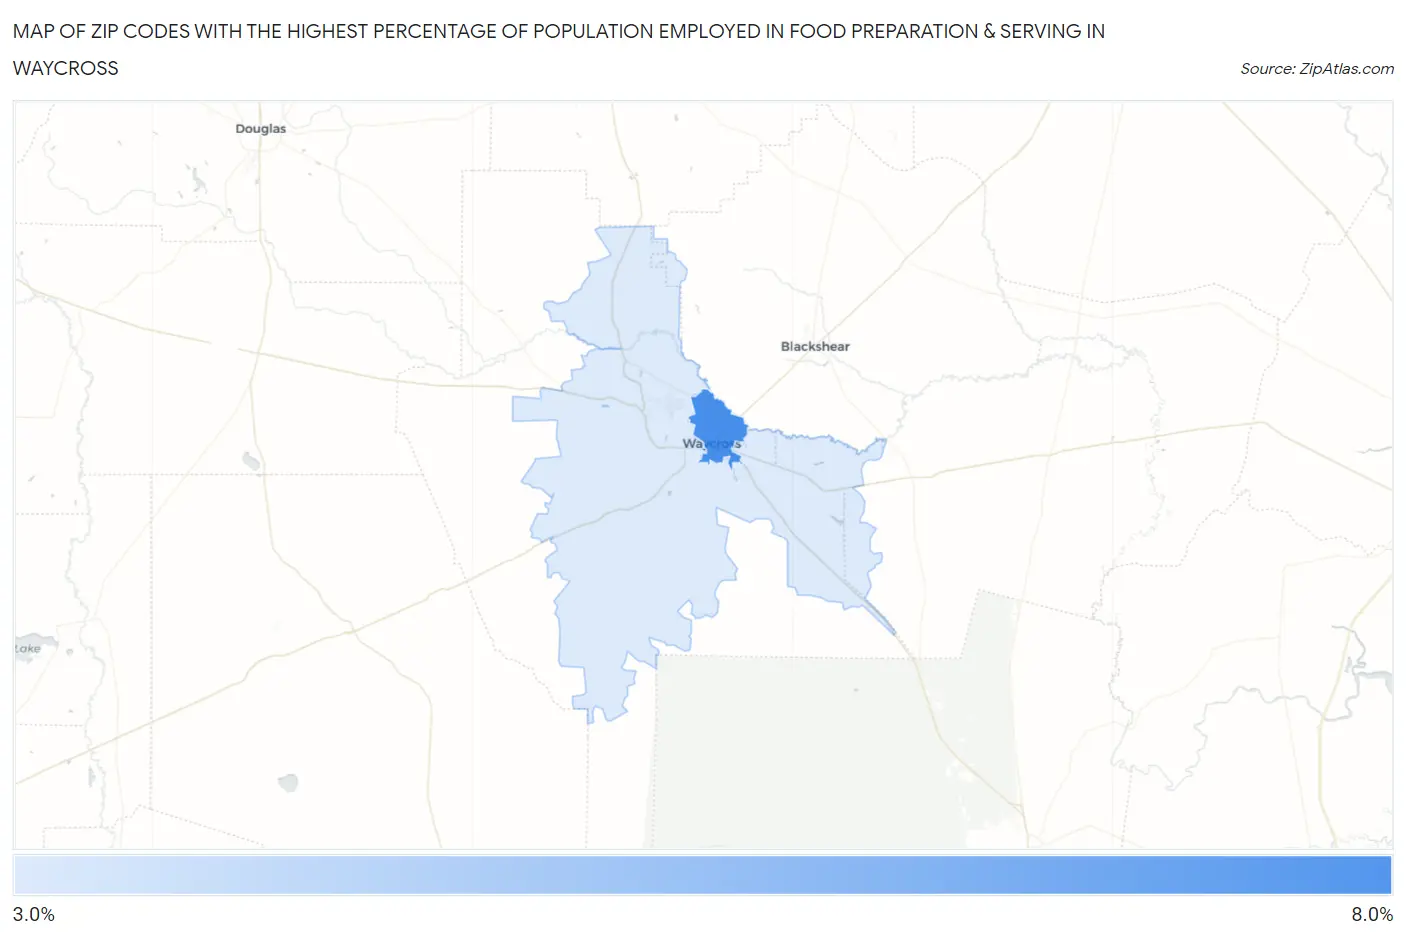
Map of Zip Codes with the Highest Percentage of Population Employed in Food Preparation & Serving in Waycross
3.6%
7.3%
Zip Codes with the Highest Percentage of Population Employed in Food Preparation & Serving in Waycross, GA
| Zip Code | % Employed | vs State | vs National | |
| 1. | 31501 | 7.3% | 5.1%(+2.13)#119 | 5.3%(+1.99)#5,963 |
| 2. | 31503 | 3.6% | 5.1%(-1.50)#442 | 5.3%(-1.64)#18,569 |
1
Common Questions
What are the Top Zip Codes with the Highest Percentage of Population Employed in Food Preparation & Serving in Waycross, GA?
Top Zip Codes with the Highest Percentage of Population Employed in Food Preparation & Serving in Waycross, GA are:
What zip code has the Highest Percentage of Population Employed in Food Preparation & Serving in Waycross, GA?
31501 has the Highest Percentage of Population Employed in Food Preparation & Serving in Waycross, GA with 7.3%.
What is the Percentage of Population Employed in Food Preparation & Serving in Waycross, GA?
Percentage of Population Employed in Food Preparation & Serving in Waycross is 5.6%.
What is the Percentage of Population Employed in Food Preparation & Serving in Georgia?
Percentage of Population Employed in Food Preparation & Serving in Georgia is 5.1%.
What is the Percentage of Population Employed in Food Preparation & Serving in the United States?
Percentage of Population Employed in Food Preparation & Serving in the United States is 5.3%.