Barnesville, GA Map & Demographics
Barnesville Map
Barnesville Overview
$23,049
PER CAPITA INCOME
$65,865
AVG FAMILY INCOME
$46,116
AVG HOUSEHOLD INCOME
19.7%
WAGE / INCOME GAP [ % ]
80.3¢/ $1
WAGE / INCOME GAP [ $ ]
0.45
INEQUALITY / GINI INDEX
6,200
TOTAL POPULATION
3,009
MALE POPULATION
3,191
FEMALE POPULATION
94.30
MALES / 100 FEMALES
106.05
FEMALES / 100 MALES
27.7
MEDIAN AGE
3.0
AVG FAMILY SIZE
2.3
AVG HOUSEHOLD SIZE
3,003
LABOR FORCE [ PEOPLE ]
56.6%
PERCENT IN LABOR FORCE
2.4%
UNEMPLOYMENT RATE
Barnesville Zip Codes
Income in Barnesville
Income Overview in Barnesville
Per Capita Income in Barnesville is $23,049, while median incomes of families and households are $65,865 and $46,116 respectively.
| Characteristic | Number | Measure |
| Per Capita Income | 6,200 | $23,049 |
| Median Family Income | 1,351 | $65,865 |
| Mean Family Income | 1,351 | $78,640 |
| Median Household Income | 2,192 | $46,116 |
| Mean Household Income | 2,192 | $62,284 |
| Income Deficit | 1,351 | $0 |
| Wage / Income Gap (%) | 6,200 | 19.68% |
| Wage / Income Gap ($) | 6,200 | 80.32¢ per $1 |
| Gini / Inequality Index | 6,200 | 0.45 |
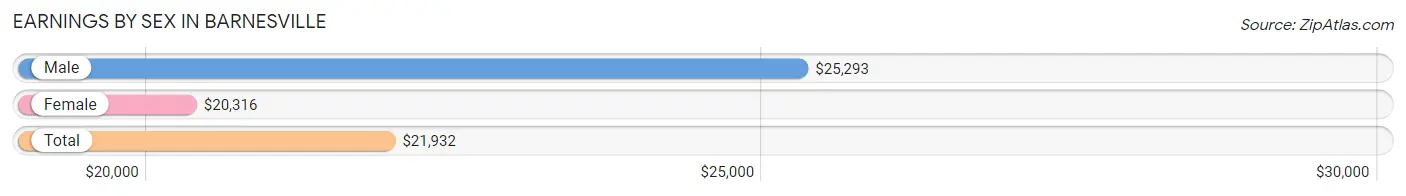
Earnings by Sex in Barnesville
Average Earnings in Barnesville are $21,932, $25,293 for men and $20,316 for women, a difference of 19.7%.
| Sex | Number | Average Earnings |
| Male | 1,609 (46.9%) | $25,293 |
| Female | 1,825 (53.1%) | $20,316 |
| Total | 3,434 (100.0%) | $21,932 |
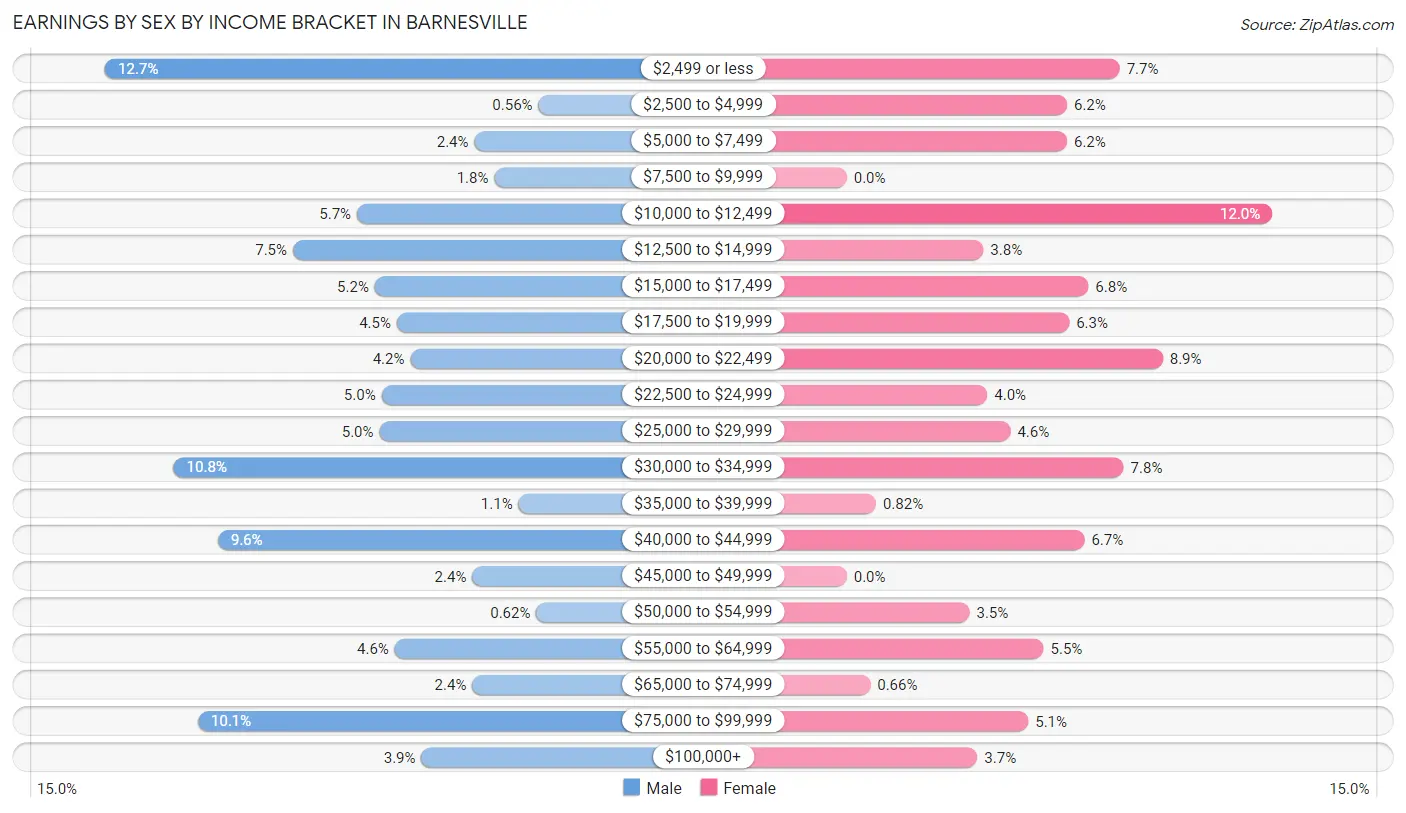
Earnings by Sex by Income Bracket in Barnesville
The most common earnings brackets in Barnesville are $2,499 or less for men (205 | 12.7%) and $10,000 to $12,499 for women (218 | 11.9%).
| Income | Male | Female |
| $2,499 or less | 205 (12.7%) | 140 (7.7%) |
| $2,500 to $4,999 | 9 (0.6%) | 113 (6.2%) |
| $5,000 to $7,499 | 38 (2.4%) | 113 (6.2%) |
| $7,500 to $9,999 | 29 (1.8%) | 0 (0.0%) |
| $10,000 to $12,499 | 91 (5.7%) | 218 (11.9%) |
| $12,500 to $14,999 | 120 (7.5%) | 70 (3.8%) |
| $15,000 to $17,499 | 83 (5.2%) | 124 (6.8%) |
| $17,500 to $19,999 | 73 (4.5%) | 114 (6.2%) |
| $20,000 to $22,499 | 67 (4.2%) | 162 (8.9%) |
| $22,500 to $24,999 | 80 (5.0%) | 72 (4.0%) |
| $25,000 to $29,999 | 81 (5.0%) | 84 (4.6%) |
| $30,000 to $34,999 | 174 (10.8%) | 142 (7.8%) |
| $35,000 to $39,999 | 18 (1.1%) | 15 (0.8%) |
| $40,000 to $44,999 | 154 (9.6%) | 122 (6.7%) |
| $45,000 to $49,999 | 39 (2.4%) | 0 (0.0%) |
| $50,000 to $54,999 | 10 (0.6%) | 63 (3.5%) |
| $55,000 to $64,999 | 74 (4.6%) | 101 (5.5%) |
| $65,000 to $74,999 | 39 (2.4%) | 12 (0.7%) |
| $75,000 to $99,999 | 163 (10.1%) | 93 (5.1%) |
| $100,000+ | 62 (3.8%) | 67 (3.7%) |
| Total | 1,609 (100.0%) | 1,825 (100.0%) |
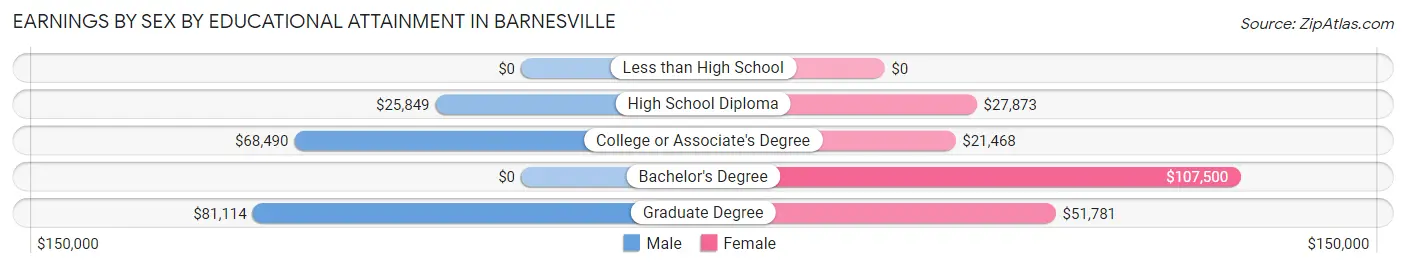
Earnings by Sex by Educational Attainment in Barnesville
Average earnings in Barnesville are $40,124 for men and $23,576 for women, a difference of 41.2%. Men with an educational attainment of graduate degree enjoy the highest average annual earnings of $81,114, while those with high school diploma education earn the least with $25,849. Women with an educational attainment of bachelor's degree earn the most with the average annual earnings of $107,500, while those with college or associate's degree education have the smallest earnings of $21,468.
| Educational Attainment | Male Income | Female Income |
| Less than High School | - | - |
| High School Diploma | $25,849 | $27,873 |
| College or Associate's Degree | $68,490 | $21,468 |
| Bachelor's Degree | - | - |
| Graduate Degree | $81,114 | $51,781 |
| Total | $40,124 | $23,576 |
Family Income in Barnesville
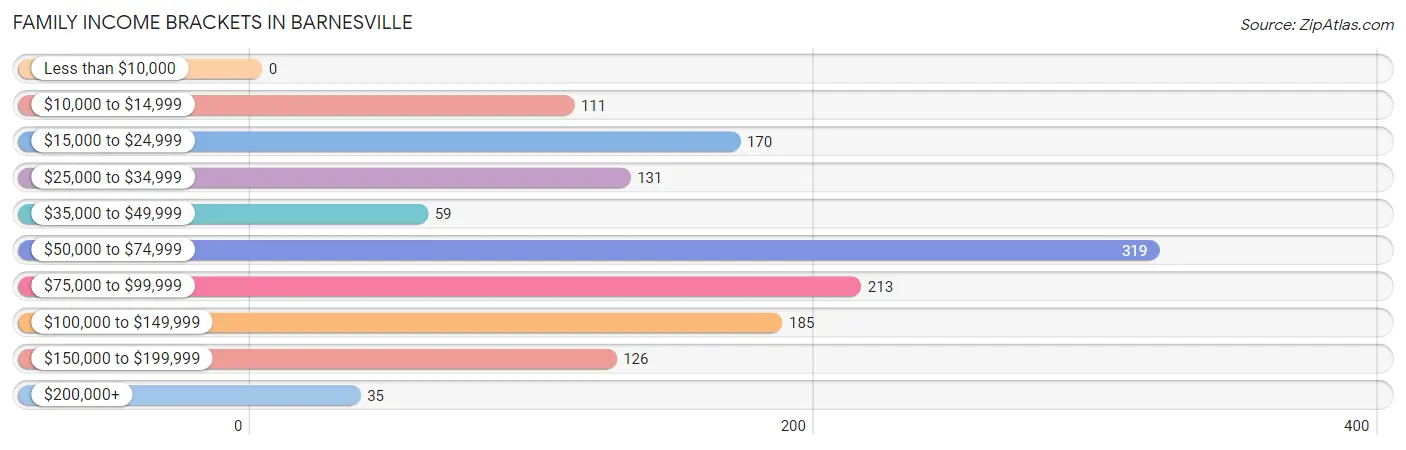
Family Income Brackets in Barnesville
According to the Barnesville family income data, there are 319 families falling into the $50,000 to $74,999 income range, which is the most common income bracket and makes up 23.6% of all families.
| Income Bracket | # Families | % Families |
| Less than $10,000 | 0 | 0.0% |
| $10,000 to $14,999 | 111 | 8.2% |
| $15,000 to $24,999 | 170 | 12.6% |
| $25,000 to $34,999 | 131 | 9.7% |
| $35,000 to $49,999 | 59 | 4.4% |
| $50,000 to $74,999 | 319 | 23.6% |
| $75,000 to $99,999 | 213 | 15.8% |
| $100,000 to $149,999 | 185 | 13.7% |
| $150,000 to $199,999 | 126 | 9.3% |
| $200,000+ | 35 | 2.6% |
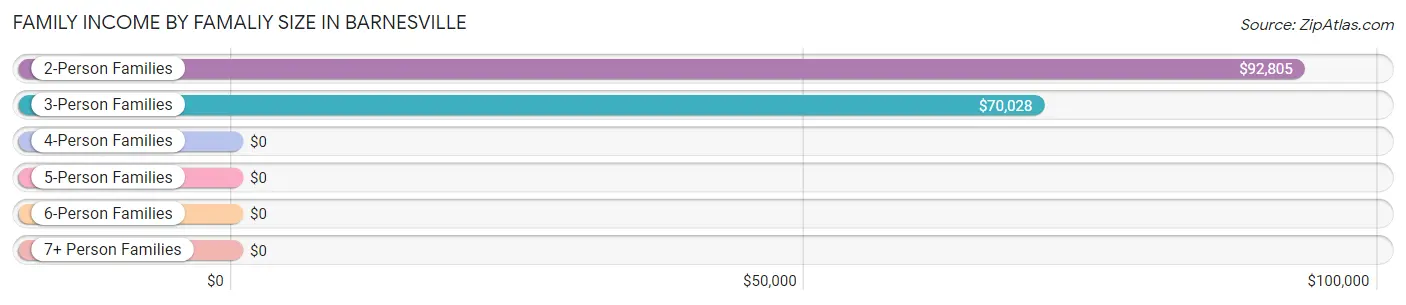
Family Income by Famaliy Size in Barnesville
2-person families (606 | 44.9%) account for the highest median family income in Barnesville with $92,805 per family, while 2-person families (606 | 44.9%) have the highest median income of $46,402 per family member.
| Income Bracket | # Families | Median Income |
| 2-Person Families | 606 (44.9%) | $92,805 |
| 3-Person Families | 489 (36.2%) | $70,028 |
| 4-Person Families | 178 (13.2%) | $0 |
| 5-Person Families | 48 (3.5%) | $0 |
| 6-Person Families | 6 (0.4%) | $0 |
| 7+ Person Families | 24 (1.8%) | $0 |
| Total | 1,351 (100.0%) | $65,865 |
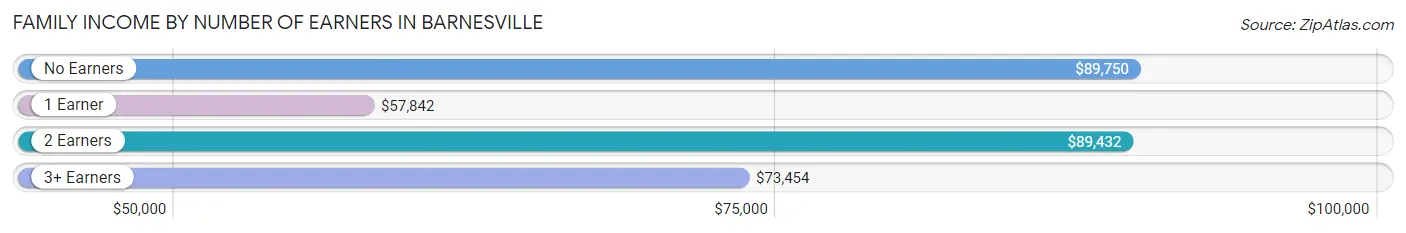
Family Income by Number of Earners in Barnesville
The median family income in Barnesville is $65,865, with families comprising no earners (114) having the highest median family income of $89,750, while families with 1 earner (649) have the lowest median family income of $57,842, accounting for 8.4% and 48.0% of families, respectively.
| Number of Earners | # Families | Median Income |
| No Earners | 114 (8.4%) | $89,750 |
| 1 Earner | 649 (48.0%) | $57,842 |
| 2 Earners | 443 (32.8%) | $89,432 |
| 3+ Earners | 145 (10.7%) | $73,454 |
| Total | 1,351 (100.0%) | $65,865 |
Household Income in Barnesville
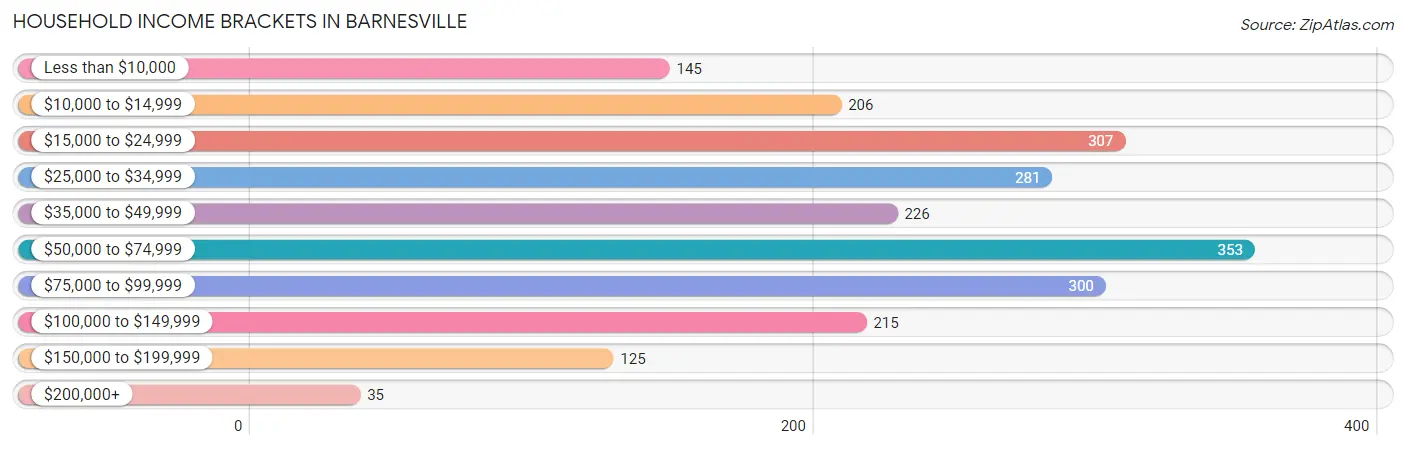
Household Income Brackets in Barnesville
With 353 households falling in the category, the $50,000 to $74,999 income range is the most frequent in Barnesville, accounting for 16.1% of all households. In contrast, only 35 households (1.6%) fall into the $200,000+ income bracket, making it the least populous group.
| Income Bracket | # Households | % Households |
| Less than $10,000 | 145 | 6.6% |
| $10,000 to $14,999 | 206 | 9.4% |
| $15,000 to $24,999 | 307 | 14.0% |
| $25,000 to $34,999 | 281 | 12.8% |
| $35,000 to $49,999 | 226 | 10.3% |
| $50,000 to $74,999 | 353 | 16.1% |
| $75,000 to $99,999 | 300 | 13.7% |
| $100,000 to $149,999 | 215 | 9.8% |
| $150,000 to $199,999 | 125 | 5.7% |
| $200,000+ | 35 | 1.6% |
Household Income by Householder Age in Barnesville
The median household income in Barnesville is $46,116, with the highest median household income of $56,378 found in the 45 to 64 years age bracket for the primary householder. A total of 595 households (27.1%) fall into this category. Meanwhile, the 15 to 24 years age bracket for the primary householder has the lowest median household income of $0, with 97 households (4.4%) in this group.
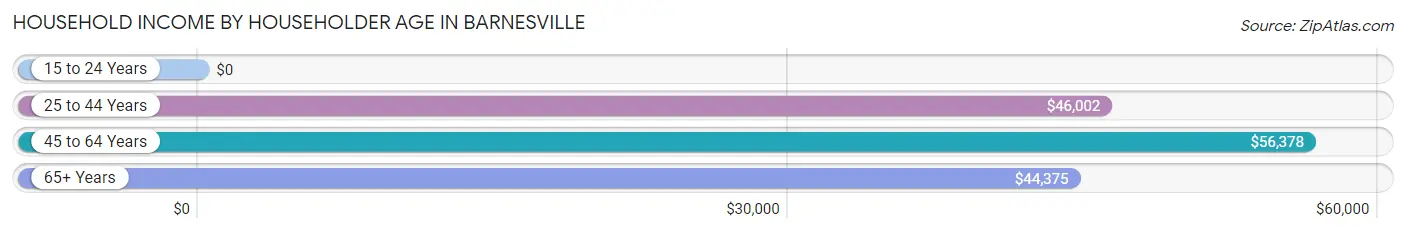
| Income Bracket | # Households | Median Income |
| 15 to 24 Years | 97 (4.4%) | $0 |
| 25 to 44 Years | 997 (45.5%) | $46,002 |
| 45 to 64 Years | 595 (27.1%) | $56,378 |
| 65+ Years | 503 (23.0%) | $44,375 |
| Total | 2,192 (100.0%) | $46,116 |
Poverty in Barnesville
Income Below Poverty by Sex and Age in Barnesville
With 12.6% poverty level for males and 19.2% for females among the residents of Barnesville, 5 year old males and 55 to 64 year old females are the most vulnerable to poverty, with 58 males (100.0%) and 107 females (41.6%) in their respective age groups living below the poverty level.
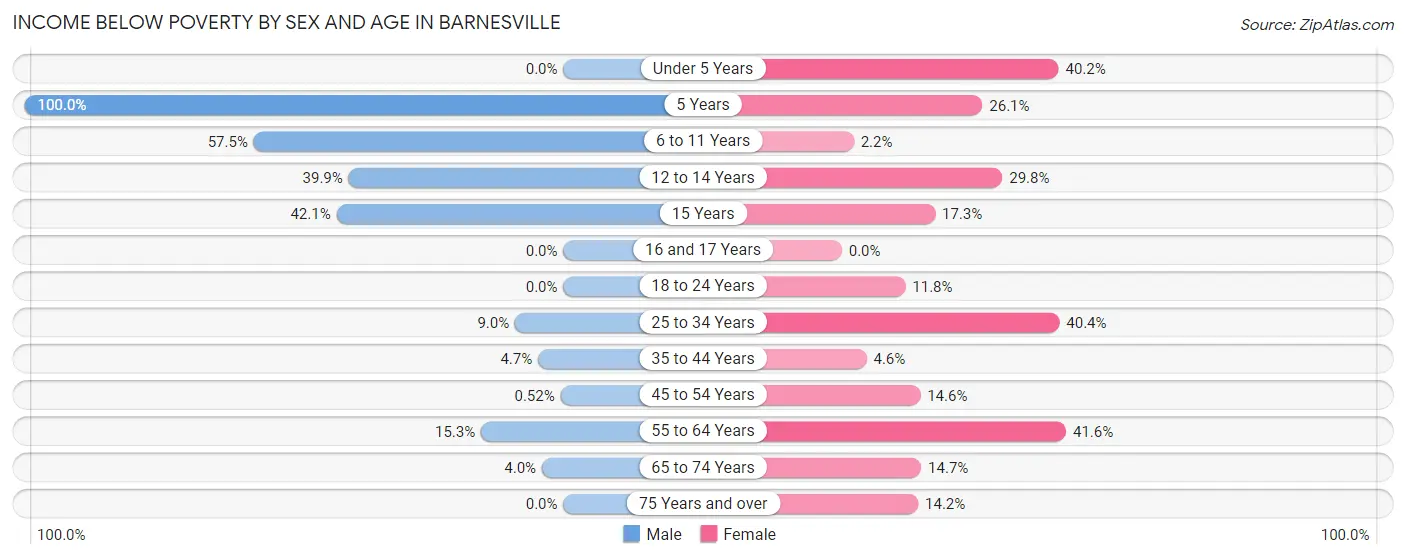
| Age Bracket | Male | Female |
| Under 5 Years | 0 (0.0%) | 33 (40.2%) |
| 5 Years | 58 (100.0%) | 6 (26.1%) |
| 6 to 11 Years | 100 (57.5%) | 5 (2.2%) |
| 12 to 14 Years | 57 (39.9%) | 14 (29.8%) |
| 15 Years | 8 (42.1%) | 9 (17.3%) |
| 16 and 17 Years | 0 (0.0%) | 0 (0.0%) |
| 18 to 24 Years | 0 (0.0%) | 53 (11.8%) |
| 25 to 34 Years | 42 (9.0%) | 172 (40.4%) |
| 35 to 44 Years | 7 (4.7%) | 17 (4.6%) |
| 45 to 54 Years | 2 (0.5%) | 46 (14.6%) |
| 55 to 64 Years | 20 (15.3%) | 107 (41.6%) |
| 65 to 74 Years | 7 (4.0%) | 38 (14.7%) |
| 75 Years and over | 0 (0.0%) | 17 (14.2%) |
| Total | 301 (12.6%) | 517 (19.2%) |
Income Above Poverty by Sex and Age in Barnesville
According to the poverty statistics in Barnesville, males aged under 5 years and females aged 16 and 17 years are the age groups that are most secure financially, with 100.0% of males and 100.0% of females in these age groups living above the poverty line.
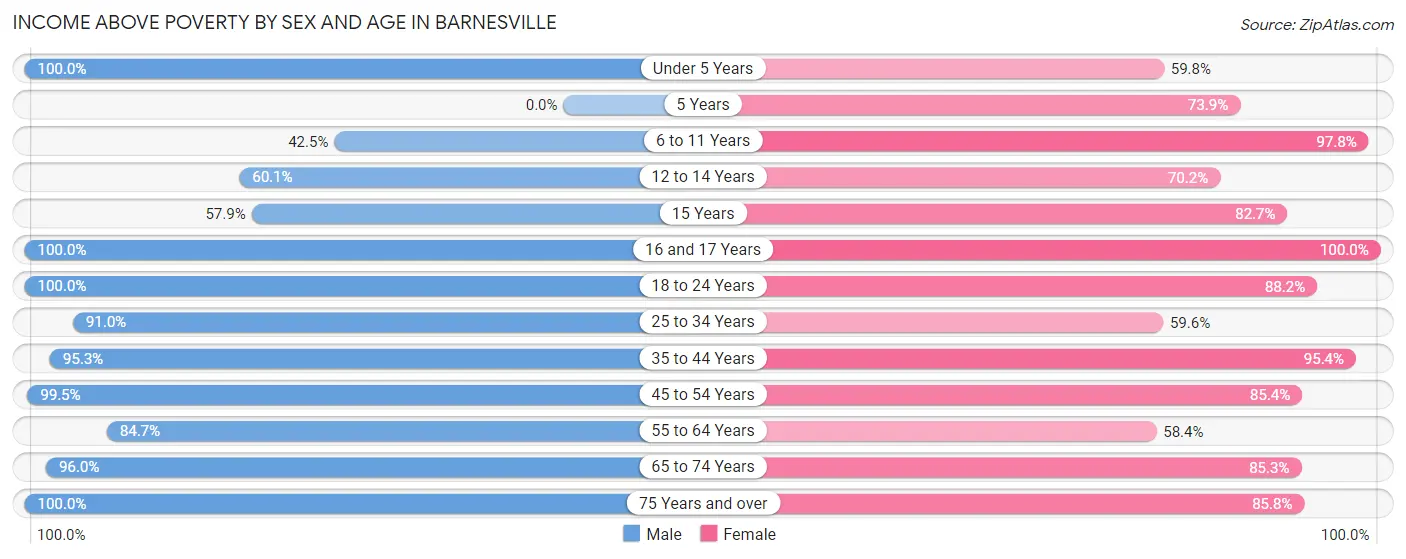
| Age Bracket | Male | Female |
| Under 5 Years | 71 (100.0%) | 49 (59.8%) |
| 5 Years | 0 (0.0%) | 17 (73.9%) |
| 6 to 11 Years | 74 (42.5%) | 221 (97.8%) |
| 12 to 14 Years | 86 (60.1%) | 33 (70.2%) |
| 15 Years | 11 (57.9%) | 43 (82.7%) |
| 16 and 17 Years | 113 (100.0%) | 71 (100.0%) |
| 18 to 24 Years | 353 (100.0%) | 396 (88.2%) |
| 25 to 34 Years | 426 (91.0%) | 254 (59.6%) |
| 35 to 44 Years | 142 (95.3%) | 353 (95.4%) |
| 45 to 54 Years | 380 (99.5%) | 270 (85.4%) |
| 55 to 64 Years | 111 (84.7%) | 150 (58.4%) |
| 65 to 74 Years | 169 (96.0%) | 220 (85.3%) |
| 75 Years and over | 147 (100.0%) | 103 (85.8%) |
| Total | 2,083 (87.4%) | 2,180 (80.8%) |
Income Below Poverty Among Married-Couple Families in Barnesville
The poverty statistics for married-couple families in Barnesville show that 2.1% or 18 of the total 844 families live below the poverty line. Families with 1 or 2 children have the highest poverty rate of 6.0%, comprising of 18 families. On the other hand, families with no children have the lowest poverty rate of 0.0%, which includes 0 families.
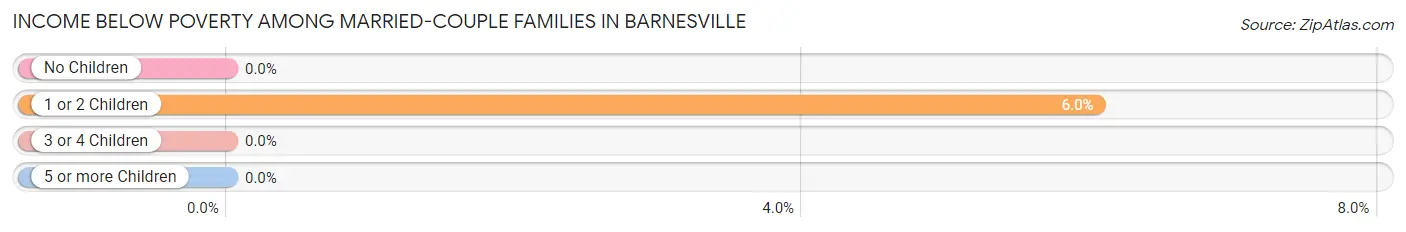
| Children | Above Poverty | Below Poverty |
| No Children | 512 (100.0%) | 0 (0.0%) |
| 1 or 2 Children | 280 (94.0%) | 18 (6.0%) |
| 3 or 4 Children | 10 (100.0%) | 0 (0.0%) |
| 5 or more Children | 24 (100.0%) | 0 (0.0%) |
| Total | 826 (97.9%) | 18 (2.1%) |
Income Below Poverty Among Single-Parent Households in Barnesville
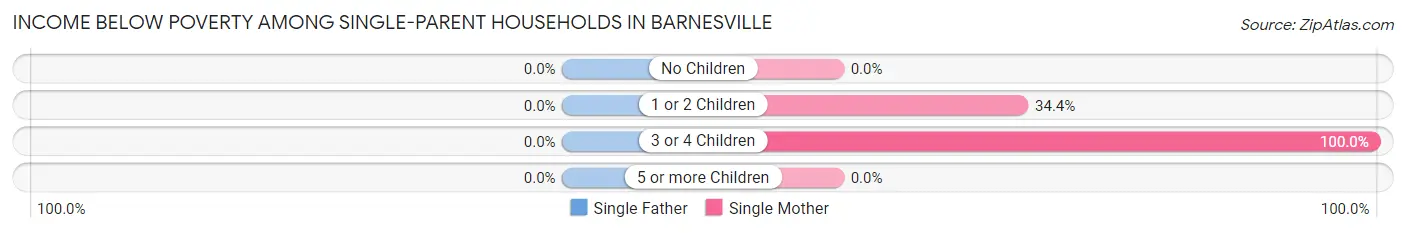
| Children | Single Father | Single Mother |
| No Children | 0 (0.0%) | 0 (0.0%) |
| 1 or 2 Children | 0 (0.0%) | 56 (34.4%) |
| 3 or 4 Children | 0 (0.0%) | 99 (100.0%) |
| 5 or more Children | 0 (0.0%) | 0 (0.0%) |
| Total | 0 (0.0%) | 155 (42.6%) |
Income Below Poverty Among Married-Couple vs Single-Parent Households in Barnesville
The poverty data for Barnesville shows that 18 of the married-couple family households (2.1%) and 155 of the single-parent households (30.6%) are living below the poverty level. Within the married-couple family households, those with 1 or 2 children have the highest poverty rate, with 18 households (6.0%) falling below the poverty line. Among the single-parent households, those with 3 or 4 children have the highest poverty rate, with 99 household (100.0%) living below poverty.
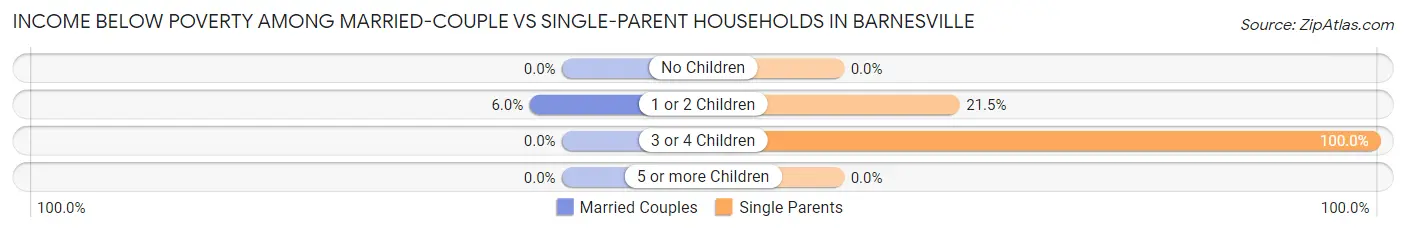
| Children | Married-Couple Families | Single-Parent Households |
| No Children | 0 (0.0%) | 0 (0.0%) |
| 1 or 2 Children | 18 (6.0%) | 56 (21.5%) |
| 3 or 4 Children | 0 (0.0%) | 99 (100.0%) |
| 5 or more Children | 0 (0.0%) | 0 (0.0%) |
| Total | 18 (2.1%) | 155 (30.6%) |
Race in Barnesville
The most populous races in Barnesville are Black / African American (2,972 | 47.9%), White / Caucasian (2,846 | 45.9%), and Two or more Races (312 | 5.0%).
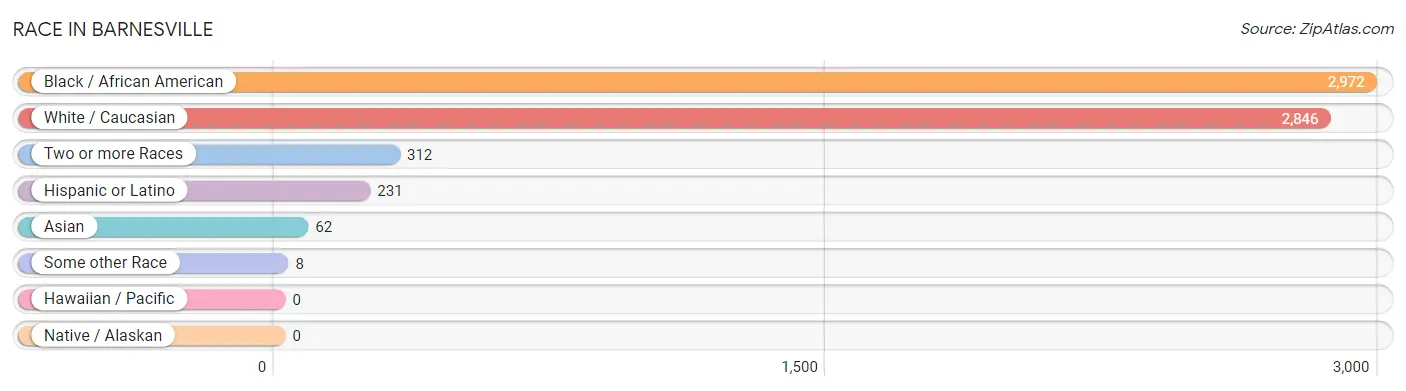
| Race | # Population | % Population |
| Asian | 62 | 1.0% |
| Black / African American | 2,972 | 47.9% |
| Hawaiian / Pacific | 0 | 0.0% |
| Hispanic or Latino | 231 | 3.7% |
| Native / Alaskan | 0 | 0.0% |
| White / Caucasian | 2,846 | 45.9% |
| Two or more Races | 312 | 5.0% |
| Some other Race | 8 | 0.1% |
| Total | 6,200 | 100.0% |
Ancestry in Barnesville
The most populous ancestries reported in Barnesville are American (422 | 6.8%), English (307 | 5.0%), Irish (212 | 3.4%), Mexican (205 | 3.3%), and Subsaharan African (160 | 2.6%), together accounting for 21.1% of all Barnesville residents.
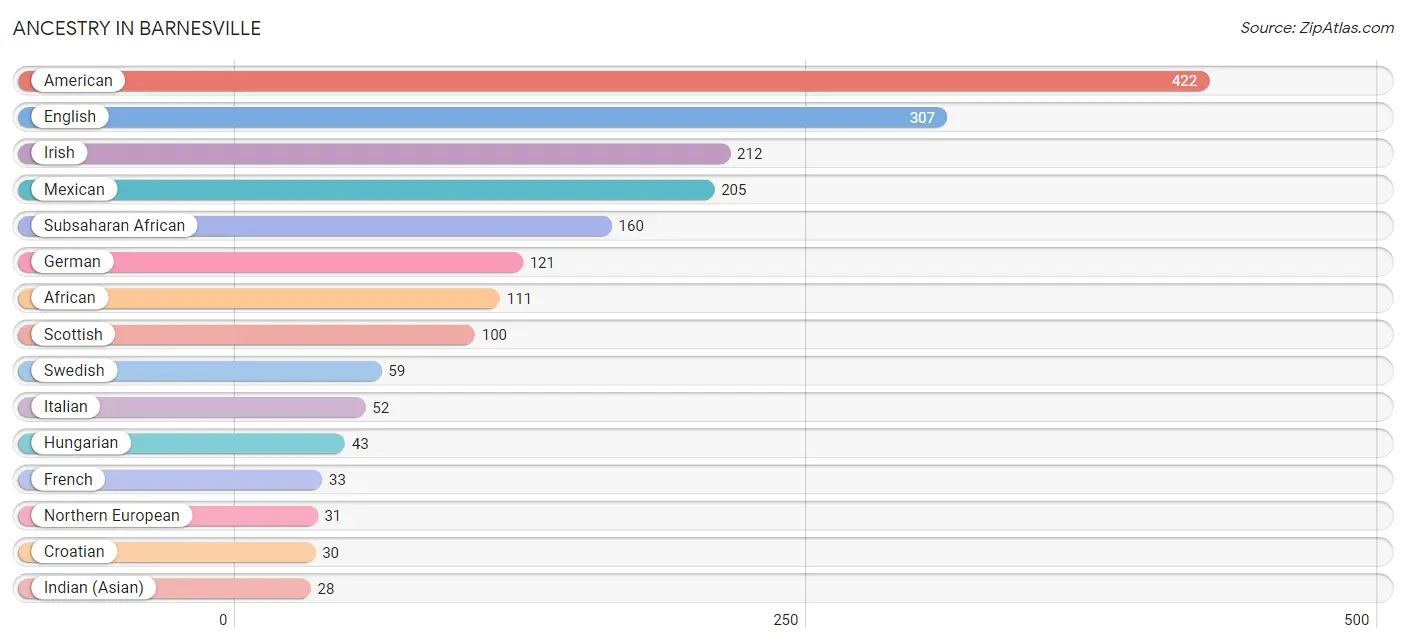
| Ancestry | # Population | % Population |
| African | 111 | 1.8% |
| American | 422 | 6.8% |
| Arab | 12 | 0.2% |
| Austrian | 7 | 0.1% |
| Burmese | 9 | 0.2% |
| Central American | 8 | 0.1% |
| Cherokee | 3 | 0.1% |
| Croatian | 30 | 0.5% |
| Dutch | 13 | 0.2% |
| English | 307 | 5.0% |
| European | 7 | 0.1% |
| French | 33 | 0.5% |
| German | 121 | 1.9% |
| Ghanaian | 26 | 0.4% |
| Hungarian | 43 | 0.7% |
| Indian (Asian) | 28 | 0.4% |
| Irish | 212 | 3.4% |
| Italian | 52 | 0.8% |
| Lebanese | 12 | 0.2% |
| Mexican | 205 | 3.3% |
| Nigerian | 23 | 0.4% |
| Northern European | 31 | 0.5% |
| Norwegian | 2 | 0.0% |
| Panamanian | 8 | 0.1% |
| Peruvian | 10 | 0.2% |
| Polish | 14 | 0.2% |
| Puerto Rican | 8 | 0.1% |
| Scotch-Irish | 24 | 0.4% |
| Scottish | 100 | 1.6% |
| South American | 10 | 0.2% |
| Sri Lankan | 11 | 0.2% |
| Subsaharan African | 160 | 2.6% |
| Swedish | 59 | 0.9% |
| Swiss | 6 | 0.1% |
| Thai | 14 | 0.2% |
| Welsh | 6 | 0.1% | View All 36 Rows |
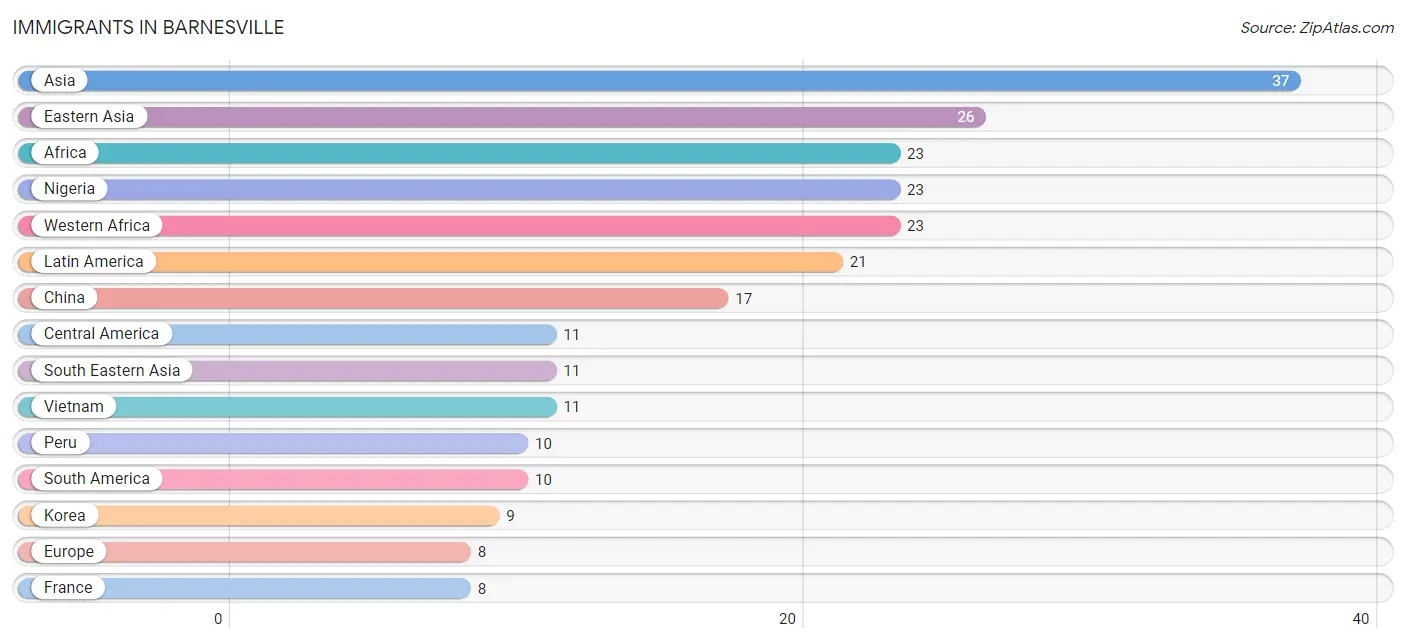
Immigrants in Barnesville
The most numerous immigrant groups reported in Barnesville came from Asia (37 | 0.6%), Eastern Asia (26 | 0.4%), Africa (23 | 0.4%), Nigeria (23 | 0.4%), and Western Africa (23 | 0.4%), together accounting for 2.1% of all Barnesville residents.
| Immigration Origin | # Population | % Population |
| Africa | 23 | 0.4% |
| Asia | 37 | 0.6% |
| Central America | 11 | 0.2% |
| China | 17 | 0.3% |
| Eastern Asia | 26 | 0.4% |
| Europe | 8 | 0.1% |
| France | 8 | 0.1% |
| Korea | 9 | 0.2% |
| Latin America | 21 | 0.3% |
| Mexico | 3 | 0.1% |
| Nigeria | 23 | 0.4% |
| Panama | 8 | 0.1% |
| Peru | 10 | 0.2% |
| South America | 10 | 0.2% |
| South Eastern Asia | 11 | 0.2% |
| Vietnam | 11 | 0.2% |
| Western Africa | 23 | 0.4% |
| Western Europe | 8 | 0.1% | View All 18 Rows |
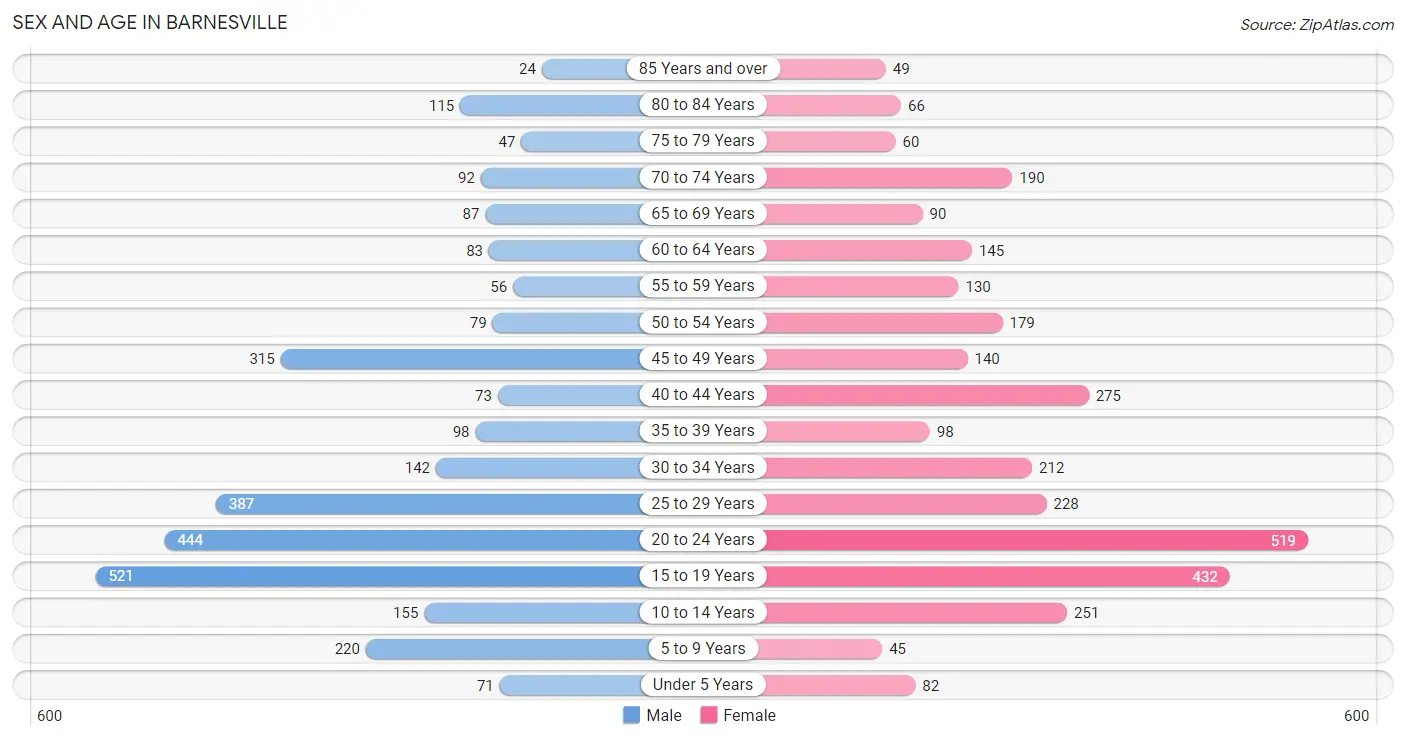
Sex and Age in Barnesville
Sex and Age in Barnesville
The most populous age groups in Barnesville are 15 to 19 Years (521 | 17.3%) for men and 20 to 24 Years (519 | 16.3%) for women.
| Age Bracket | Male | Female |
| Under 5 Years | 71 (2.4%) | 82 (2.6%) |
| 5 to 9 Years | 220 (7.3%) | 45 (1.4%) |
| 10 to 14 Years | 155 (5.1%) | 251 (7.9%) |
| 15 to 19 Years | 521 (17.3%) | 432 (13.5%) |
| 20 to 24 Years | 444 (14.8%) | 519 (16.3%) |
| 25 to 29 Years | 387 (12.9%) | 228 (7.1%) |
| 30 to 34 Years | 142 (4.7%) | 212 (6.6%) |
| 35 to 39 Years | 98 (3.3%) | 98 (3.1%) |
| 40 to 44 Years | 73 (2.4%) | 275 (8.6%) |
| 45 to 49 Years | 315 (10.5%) | 140 (4.4%) |
| 50 to 54 Years | 79 (2.6%) | 179 (5.6%) |
| 55 to 59 Years | 56 (1.9%) | 130 (4.1%) |
| 60 to 64 Years | 83 (2.8%) | 145 (4.5%) |
| 65 to 69 Years | 87 (2.9%) | 90 (2.8%) |
| 70 to 74 Years | 92 (3.1%) | 190 (5.9%) |
| 75 to 79 Years | 47 (1.6%) | 60 (1.9%) |
| 80 to 84 Years | 115 (3.8%) | 66 (2.1%) |
| 85 Years and over | 24 (0.8%) | 49 (1.5%) |
| Total | 3,009 (100.0%) | 3,191 (100.0%) |
Families and Households in Barnesville
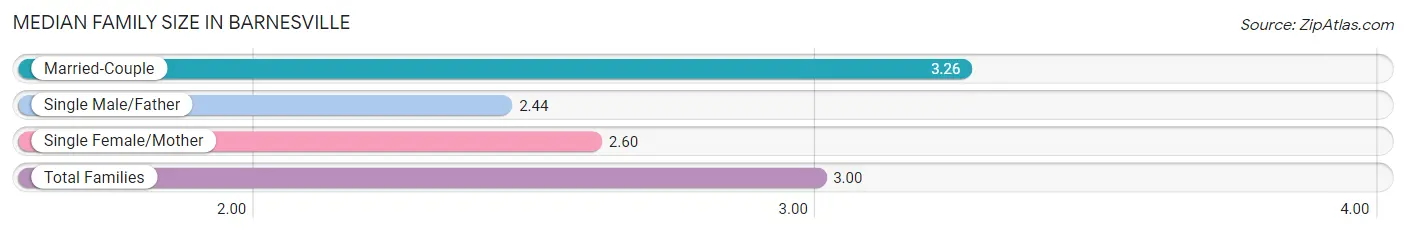
Median Family Size in Barnesville
The median family size in Barnesville is 3.00 persons per family, with married-couple families (844 | 62.5%) accounting for the largest median family size of 3.26 persons per family. On the other hand, single male/father families (143 | 10.6%) represent the smallest median family size with 2.44 persons per family.
| Family Type | # Families | Family Size |
| Married-Couple | 844 (62.5%) | 3.26 |
| Single Male/Father | 143 (10.6%) | 2.44 |
| Single Female/Mother | 364 (26.9%) | 2.60 |
| Total Families | 1,351 (100.0%) | 3.00 |
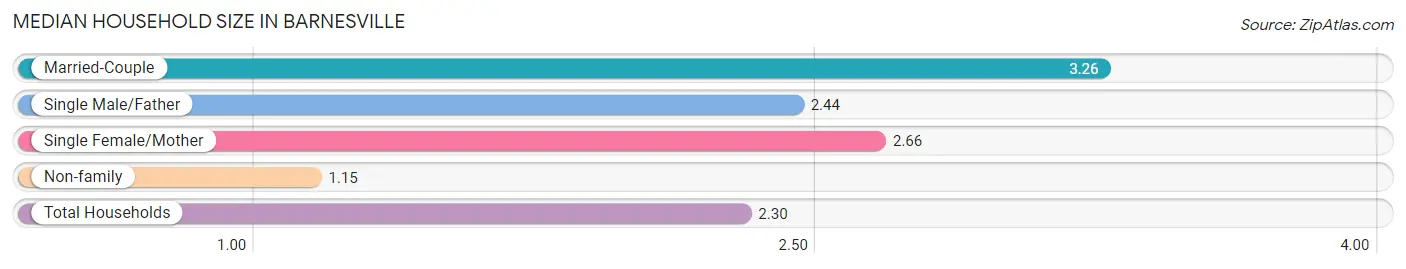
Median Household Size in Barnesville
The median household size in Barnesville is 2.30 persons per household, with married-couple households (844 | 38.5%) accounting for the largest median household size of 3.26 persons per household. non-family households (841 | 38.4%) represent the smallest median household size with 1.15 persons per household.
| Household Type | # Households | Household Size |
| Married-Couple | 844 (38.5%) | 3.26 |
| Single Male/Father | 143 (6.5%) | 2.44 |
| Single Female/Mother | 364 (16.6%) | 2.66 |
| Non-family | 841 (38.4%) | 1.15 |
| Total Households | 2,192 (100.0%) | 2.30 |
Household Size by Marriage Status in Barnesville
Out of a total of 2,192 households in Barnesville, 1,351 (61.6%) are family households, while 841 (38.4%) are nonfamily households. The most numerous type of family households are 2-person households, comprising 606, and the most common type of nonfamily households are 1-person households, comprising 692.
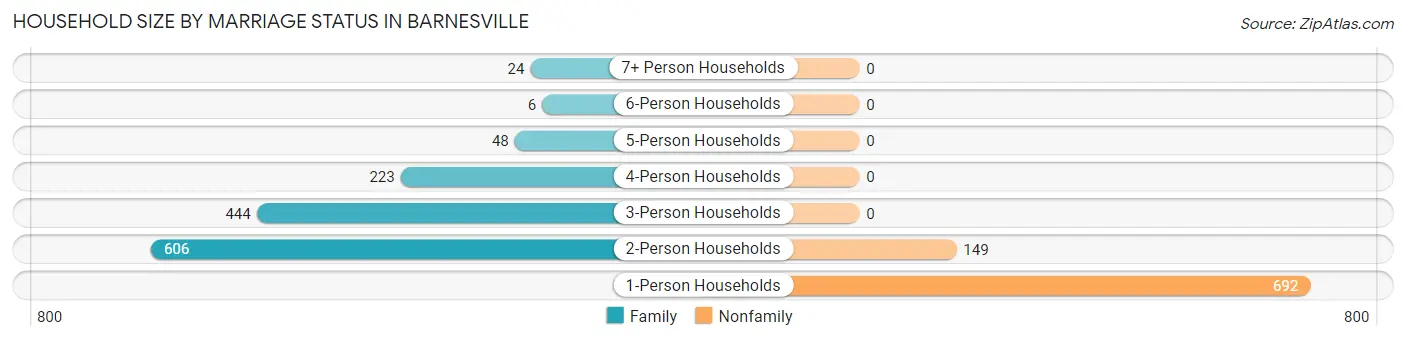
| Household Size | Family Households | Nonfamily Households |
| 1-Person Households | - | 692 (31.6%) |
| 2-Person Households | 606 (27.7%) | 149 (6.8%) |
| 3-Person Households | 444 (20.3%) | 0 (0.0%) |
| 4-Person Households | 223 (10.2%) | 0 (0.0%) |
| 5-Person Households | 48 (2.2%) | 0 (0.0%) |
| 6-Person Households | 6 (0.3%) | 0 (0.0%) |
| 7+ Person Households | 24 (1.1%) | 0 (0.0%) |
| Total | 1,351 (61.6%) | 841 (38.4%) |
Female Fertility in Barnesville
Fertility by Age in Barnesville
Average fertility rate in Barnesville is 54.0 births per 1,000 women. Women in the age bracket of 20 to 34 years have the highest fertility rate with 113.0 births per 1,000 women. Women in the age bracket of 20 to 34 years acount for 100.0% of all women with births.
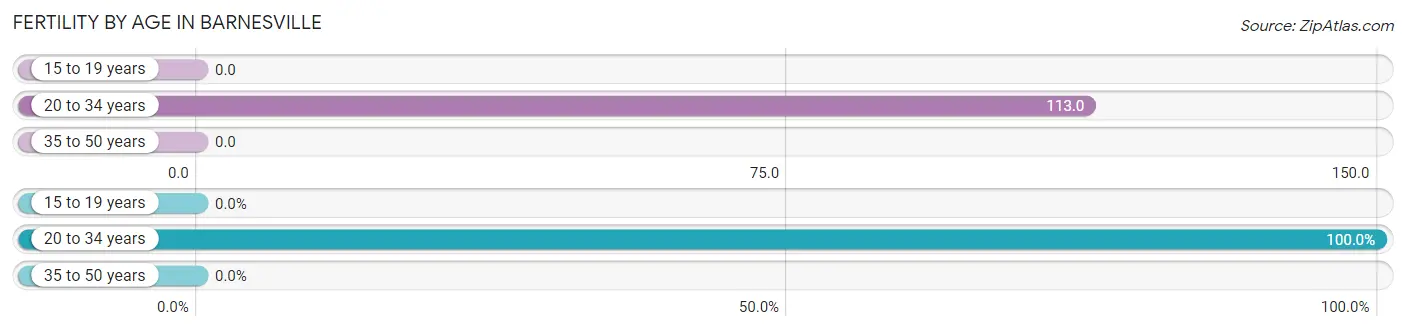
| Age Bracket | Women with Births | Births / 1,000 Women |
| 15 to 19 years | 0 (0.0%) | 0.0 |
| 20 to 34 years | 108 (100.0%) | 113.0 |
| 35 to 50 years | 0 (0.0%) | 0.0 |
| Total | 108 (100.0%) | 54.0 |
Fertility by Age by Marriage Status in Barnesville
54.6% of women with births (108) in Barnesville are married. The highest percentage of unmarried women with births falls into 20 to 34 years age bracket with 45.4% of them unmarried at the time of birth, while the lowest percentage of unmarried women with births belong to 20 to 34 years age bracket with 45.4% of them unmarried.
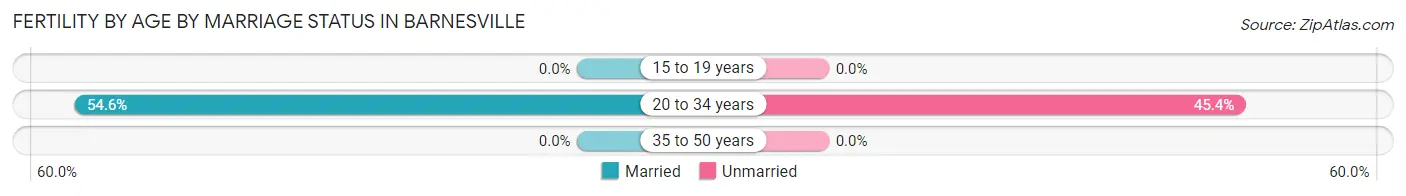
| Age Bracket | Married | Unmarried |
| 15 to 19 years | 0 (0.0%) | 0 (0.0%) |
| 20 to 34 years | 59 (54.6%) | 49 (45.4%) |
| 35 to 50 years | 0 (0.0%) | 0 (0.0%) |
| Total | 59 (54.6%) | 49 (45.4%) |
Fertility by Education in Barnesville
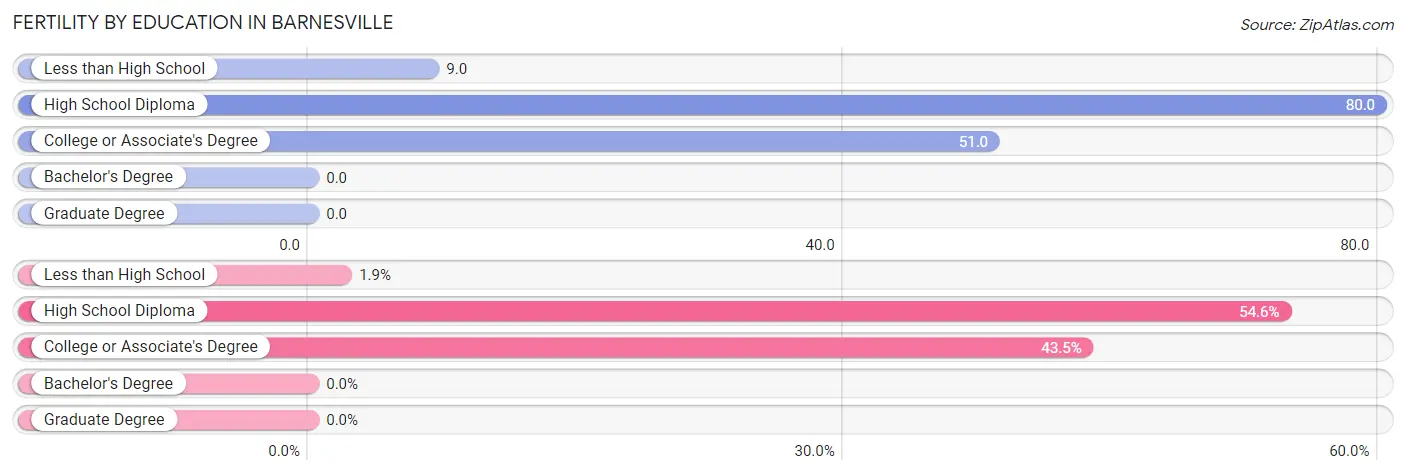
| Educational Attainment | Women with Births | Births / 1,000 Women |
| Less than High School | 2 (1.8%) | 9.0 |
| High School Diploma | 59 (54.6%) | 80.0 |
| College or Associate's Degree | 47 (43.5%) | 51.0 |
| Bachelor's Degree | 0 (0.0%) | 0.0 |
| Graduate Degree | 0 (0.0%) | 0.0 |
| Total | 108 (100.0%) | 54.0 |
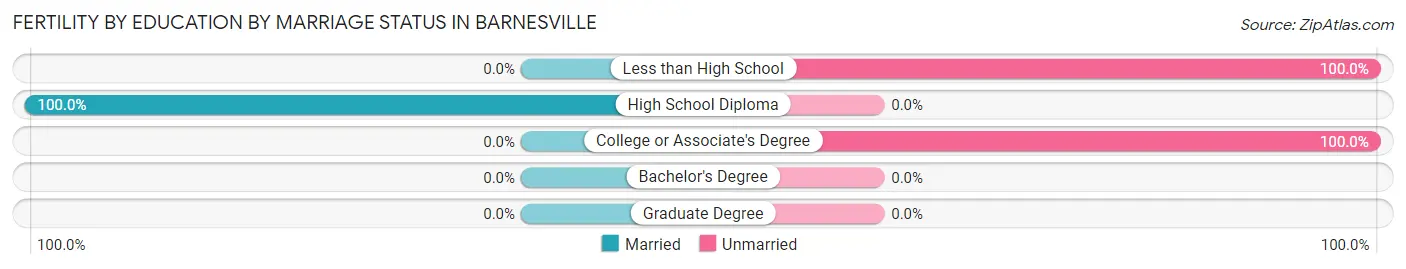
Fertility by Education by Marriage Status in Barnesville
45.4% of women with births in Barnesville are unmarried. Women with the educational attainment of high school diploma are most likely to be married with 100.0% of them married at childbirth, while women with the educational attainment of less than high school are least likely to be married with 100.0% of them unmarried at childbirth.
| Educational Attainment | Married | Unmarried |
| Less than High School | 0 (0.0%) | 2 (100.0%) |
| High School Diploma | 59 (100.0%) | 0 (0.0%) |
| College or Associate's Degree | 0 (0.0%) | 47 (100.0%) |
| Bachelor's Degree | 0 (0.0%) | 0 (0.0%) |
| Graduate Degree | 0 (0.0%) | 0 (0.0%) |
| Total | 59 (54.6%) | 49 (45.4%) |
Employment Characteristics in Barnesville
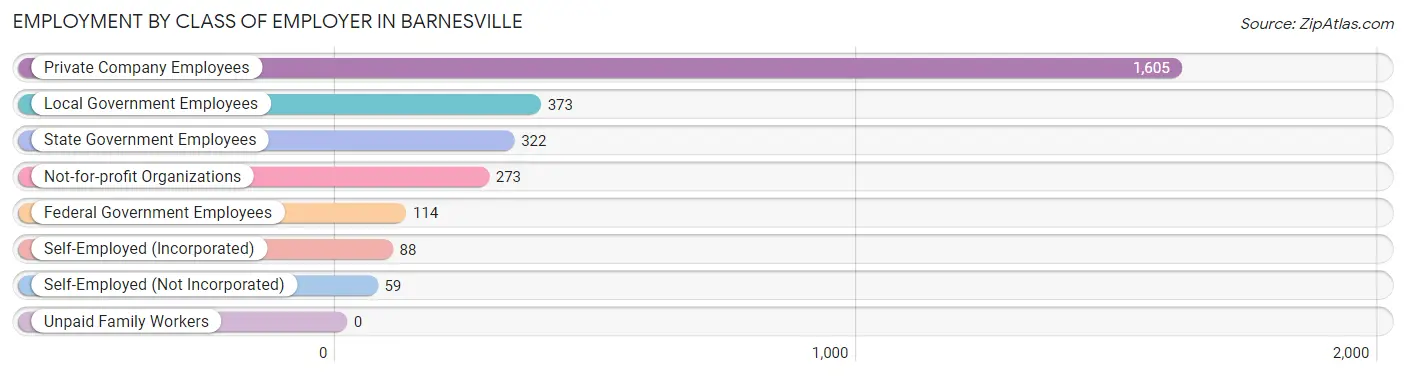
Employment by Class of Employer in Barnesville
Among the 2,834 employed individuals in Barnesville, private company employees (1,605 | 56.6%), local government employees (373 | 13.2%), and state government employees (322 | 11.4%) make up the most common classes of employment.
| Employer Class | # Employees | % Employees |
| Private Company Employees | 1,605 | 56.6% |
| Self-Employed (Incorporated) | 88 | 3.1% |
| Self-Employed (Not Incorporated) | 59 | 2.1% |
| Not-for-profit Organizations | 273 | 9.6% |
| Local Government Employees | 373 | 13.2% |
| State Government Employees | 322 | 11.4% |
| Federal Government Employees | 114 | 4.0% |
| Unpaid Family Workers | 0 | 0.0% |
| Total | 2,834 | 100.0% |
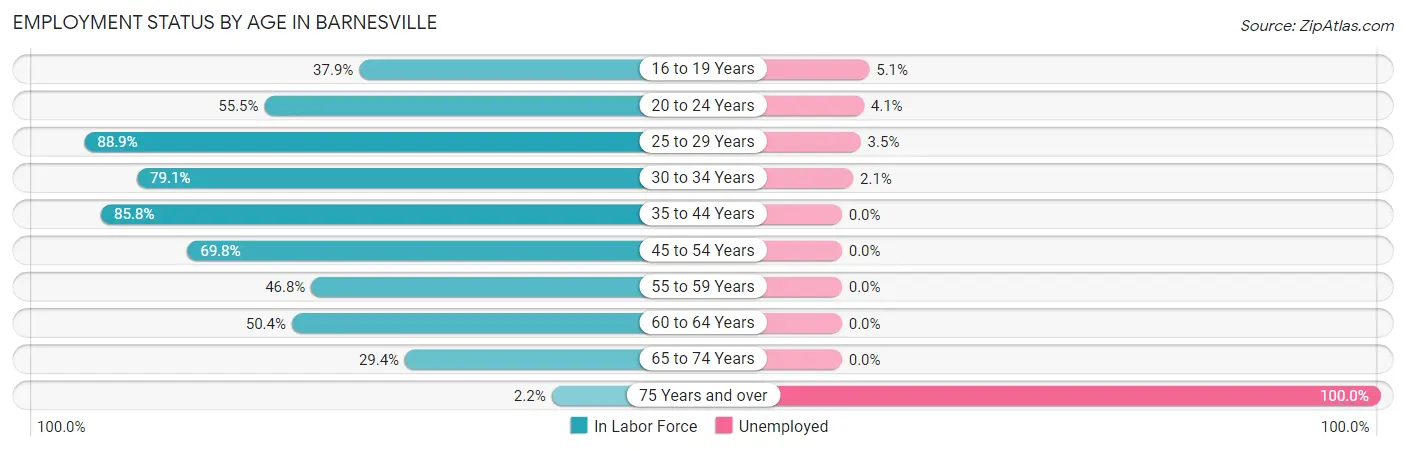
Employment Status by Age in Barnesville
According to the labor force statistics for Barnesville, out of the total population over 16 years of age (5,305), 56.6% or 3,003 individuals are in the labor force, with 2.4% or 72 of them unemployed. The age group with the highest labor force participation rate is 25 to 29 years, with 88.9% or 547 individuals in the labor force. Within the labor force, the 75 years and over age range has the highest percentage of unemployed individuals, with 100.0% or 8 of them being unemployed.
| Age Bracket | In Labor Force | Unemployed |
| 16 to 19 Years | 334 (37.9%) | 17 (5.1%) |
| 20 to 24 Years | 534 (55.5%) | 22 (4.1%) |
| 25 to 29 Years | 547 (88.9%) | 19 (3.5%) |
| 30 to 34 Years | 280 (79.1%) | 6 (2.1%) |
| 35 to 44 Years | 467 (85.8%) | 0 (0.0%) |
| 45 to 54 Years | 498 (69.8%) | 0 (0.0%) |
| 55 to 59 Years | 87 (46.8%) | 0 (0.0%) |
| 60 to 64 Years | 115 (50.4%) | 0 (0.0%) |
| 65 to 74 Years | 135 (29.4%) | 0 (0.0%) |
| 75 Years and over | 8 (2.2%) | 8 (100.0%) |
| Total | 3,003 (56.6%) | 72 (2.4%) |
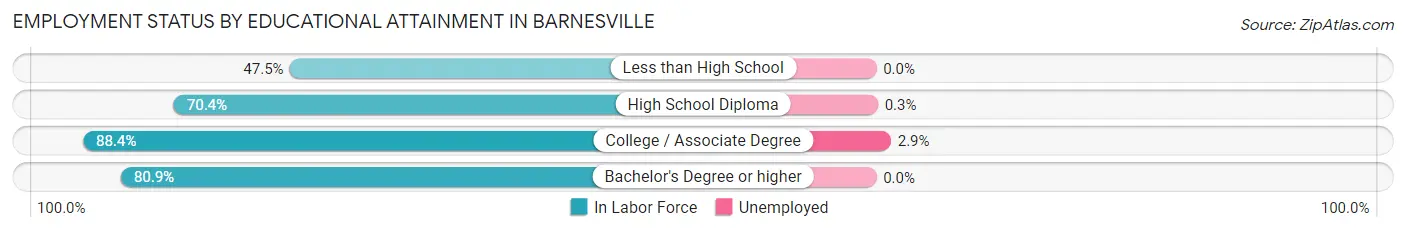
Employment Status by Educational Attainment in Barnesville
According to labor force statistics for Barnesville, 75.5% of individuals (1,993) out of the total population between 25 and 64 years of age (2,640) are in the labor force, with 1.3% or 26 of them being unemployed. The group with the highest labor force participation rate are those with the educational attainment of college / associate degree, with 88.4% or 784 individuals in the labor force. Within the labor force, individuals with college / associate degree education have the highest percentage of unemployment, with 2.9% or 23 of them being unemployed.
| Educational Attainment | In Labor Force | Unemployed |
| Less than High School | 140 (47.5%) | 0 (0.0%) |
| High School Diploma | 735 (70.4%) | 3 (0.3%) |
| College / Associate Degree | 784 (88.4%) | 26 (2.9%) |
| Bachelor's Degree or higher | 335 (80.9%) | 0 (0.0%) |
| Total | 1,993 (75.5%) | 34 (1.3%) |
Employment Occupations by Sex in Barnesville
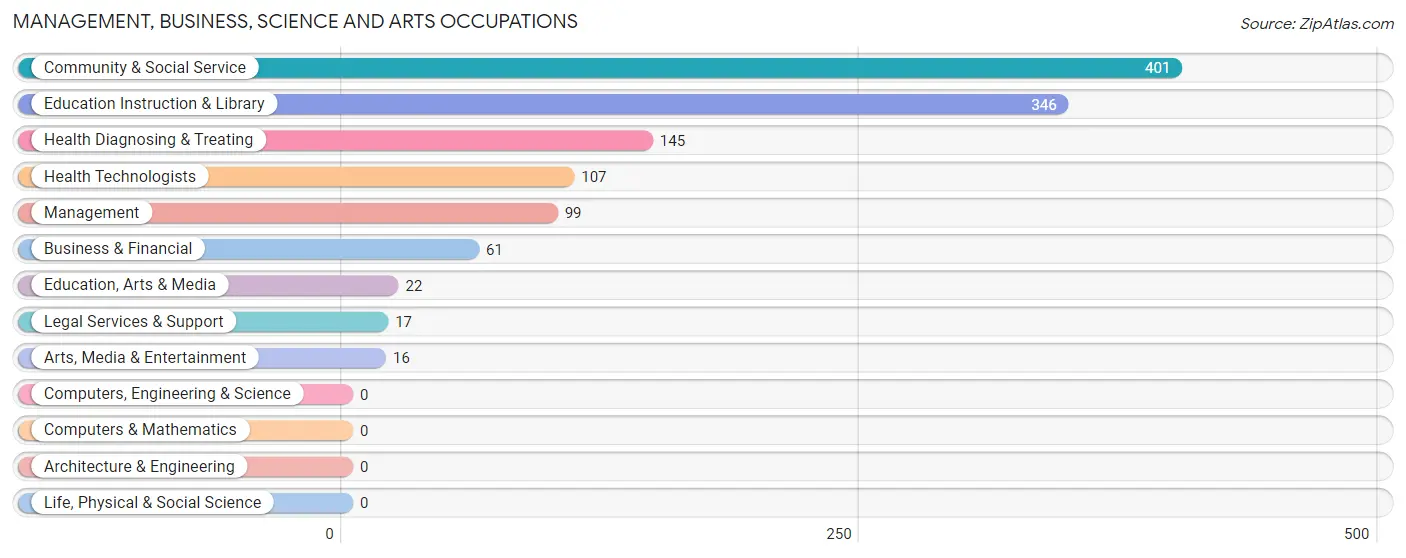
Management, Business, Science and Arts Occupations
The most common Management, Business, Science and Arts occupations in Barnesville are Community & Social Service (401 | 13.9%), Education Instruction & Library (346 | 12.0%), Health Diagnosing & Treating (145 | 5.0%), Health Technologists (107 | 3.7%), and Management (99 | 3.4%).
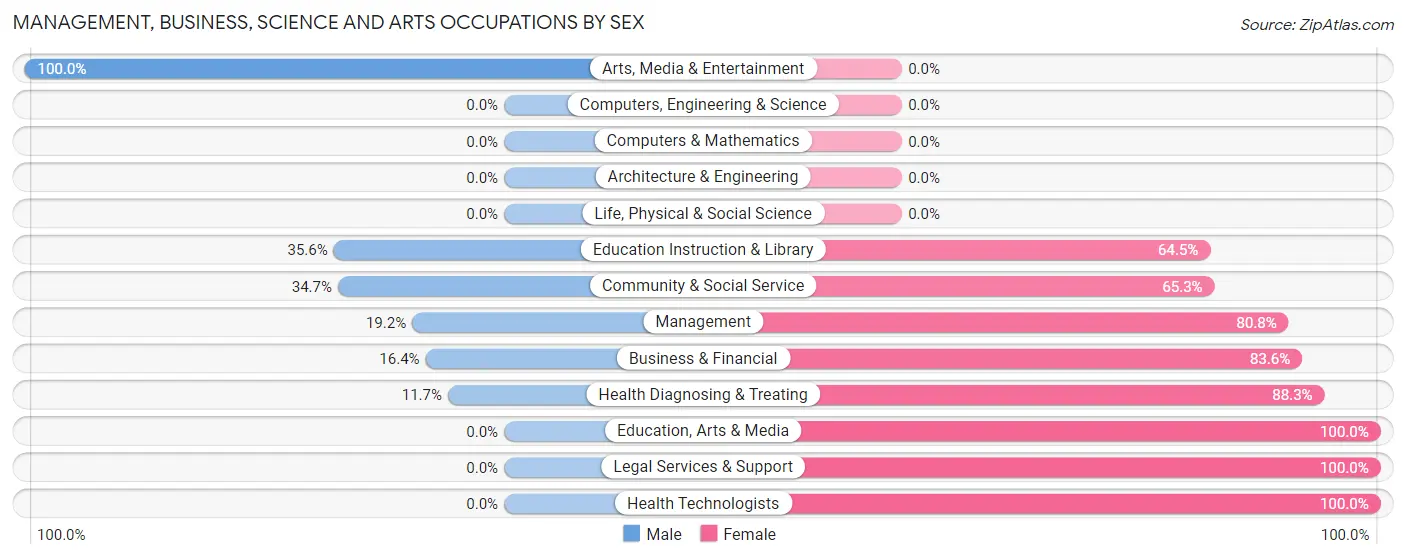
Management, Business, Science and Arts Occupations by Sex
Within the Management, Business, Science and Arts occupations in Barnesville, the most male-oriented occupations are Arts, Media & Entertainment (100.0%), Education Instruction & Library (35.5%), and Community & Social Service (34.7%), while the most female-oriented occupations are Education, Arts & Media (100.0%), Legal Services & Support (100.0%), and Health Technologists (100.0%).
| Occupation | Male | Female |
| Management | 19 (19.2%) | 80 (80.8%) |
| Business & Financial | 10 (16.4%) | 51 (83.6%) |
| Computers, Engineering & Science | 0 (0.0%) | 0 (0.0%) |
| Computers & Mathematics | 0 (0.0%) | 0 (0.0%) |
| Architecture & Engineering | 0 (0.0%) | 0 (0.0%) |
| Life, Physical & Social Science | 0 (0.0%) | 0 (0.0%) |
| Community & Social Service | 139 (34.7%) | 262 (65.3%) |
| Education, Arts & Media | 0 (0.0%) | 22 (100.0%) |
| Legal Services & Support | 0 (0.0%) | 17 (100.0%) |
| Education Instruction & Library | 123 (35.5%) | 223 (64.4%) |
| Arts, Media & Entertainment | 16 (100.0%) | 0 (0.0%) |
| Health Diagnosing & Treating | 17 (11.7%) | 128 (88.3%) |
| Health Technologists | 0 (0.0%) | 107 (100.0%) |
| Total (Category) | 185 (26.2%) | 521 (73.8%) |
| Total (Overall) | 1,237 (42.8%) | 1,653 (57.2%) |
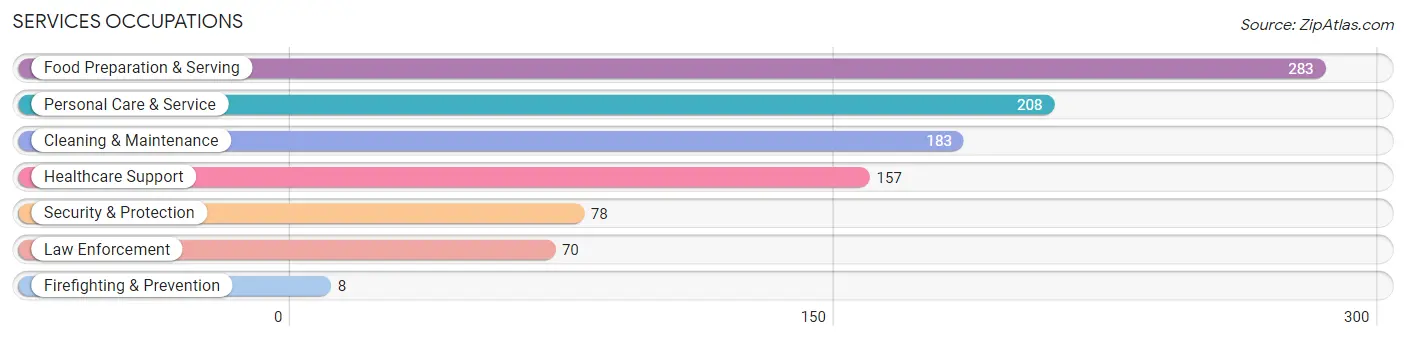
Services Occupations
The most common Services occupations in Barnesville are Food Preparation & Serving (283 | 9.8%), Personal Care & Service (208 | 7.2%), Cleaning & Maintenance (183 | 6.3%), Healthcare Support (157 | 5.4%), and Security & Protection (78 | 2.7%).
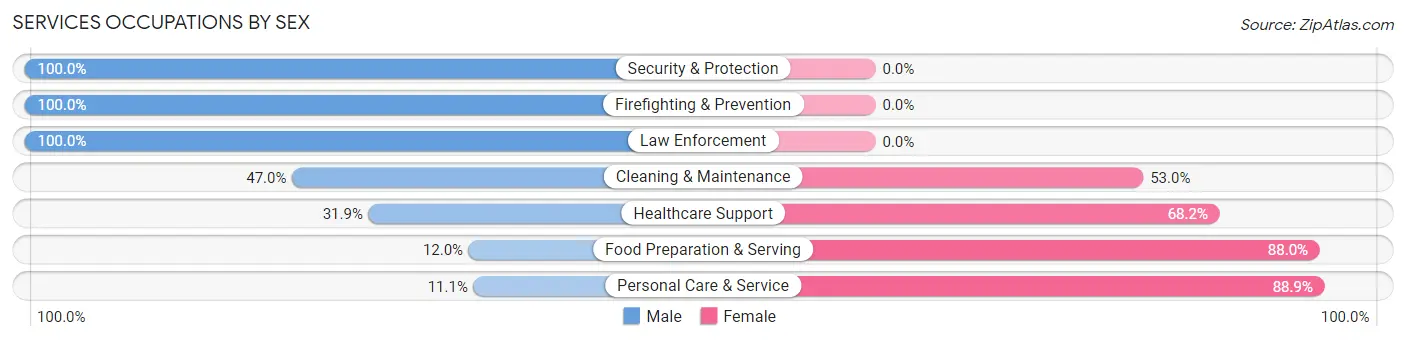
Services Occupations by Sex
Within the Services occupations in Barnesville, the most male-oriented occupations are Security & Protection (100.0%), Firefighting & Prevention (100.0%), and Law Enforcement (100.0%), while the most female-oriented occupations are Personal Care & Service (88.9%), Food Preparation & Serving (88.0%), and Healthcare Support (68.1%).
| Occupation | Male | Female |
| Healthcare Support | 50 (31.9%) | 107 (68.1%) |
| Security & Protection | 78 (100.0%) | 0 (0.0%) |
| Firefighting & Prevention | 8 (100.0%) | 0 (0.0%) |
| Law Enforcement | 70 (100.0%) | 0 (0.0%) |
| Food Preparation & Serving | 34 (12.0%) | 249 (88.0%) |
| Cleaning & Maintenance | 86 (47.0%) | 97 (53.0%) |
| Personal Care & Service | 23 (11.1%) | 185 (88.9%) |
| Total (Category) | 271 (29.8%) | 638 (70.2%) |
| Total (Overall) | 1,237 (42.8%) | 1,653 (57.2%) |
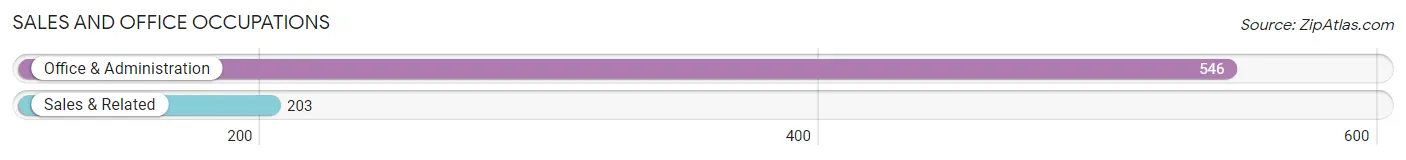
Sales and Office Occupations
The most common Sales and Office occupations in Barnesville are Office & Administration (546 | 18.9%), and Sales & Related (203 | 7.0%).
Sales and Office Occupations by Sex
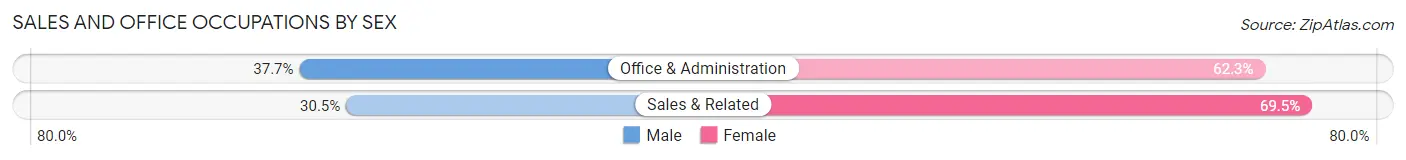
| Occupation | Male | Female |
| Sales & Related | 62 (30.5%) | 141 (69.5%) |
| Office & Administration | 206 (37.7%) | 340 (62.3%) |
| Total (Category) | 268 (35.8%) | 481 (64.2%) |
| Total (Overall) | 1,237 (42.8%) | 1,653 (57.2%) |
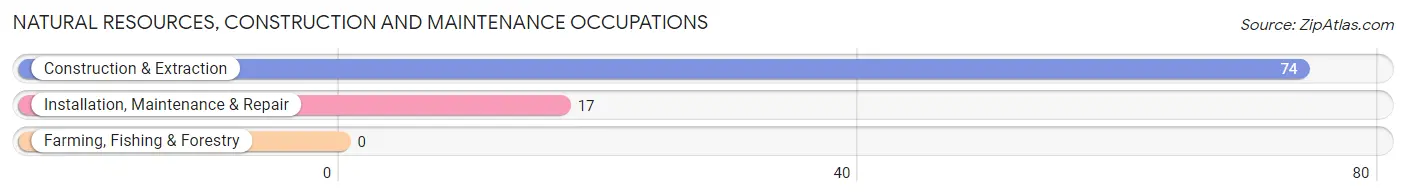
Natural Resources, Construction and Maintenance Occupations
The most common Natural Resources, Construction and Maintenance occupations in Barnesville are Construction & Extraction (74 | 2.6%), and Installation, Maintenance & Repair (17 | 0.6%).
Natural Resources, Construction and Maintenance Occupations by Sex
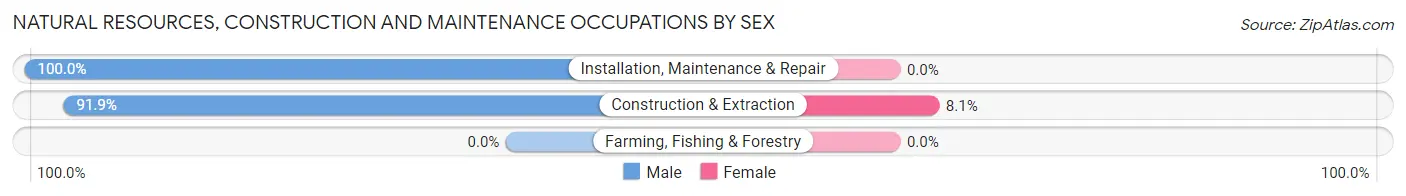
| Occupation | Male | Female |
| Farming, Fishing & Forestry | 0 (0.0%) | 0 (0.0%) |
| Construction & Extraction | 68 (91.9%) | 6 (8.1%) |
| Installation, Maintenance & Repair | 17 (100.0%) | 0 (0.0%) |
| Total (Category) | 85 (93.4%) | 6 (6.6%) |
| Total (Overall) | 1,237 (42.8%) | 1,653 (57.2%) |
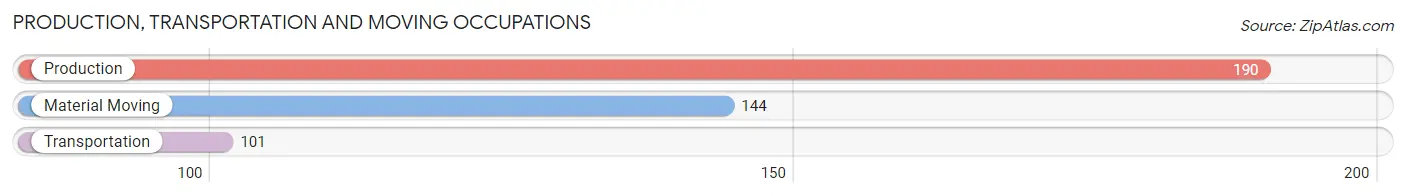
Production, Transportation and Moving Occupations
The most common Production, Transportation and Moving occupations in Barnesville are Production (190 | 6.6%), Material Moving (144 | 5.0%), and Transportation (101 | 3.5%).
Production, Transportation and Moving Occupations by Sex
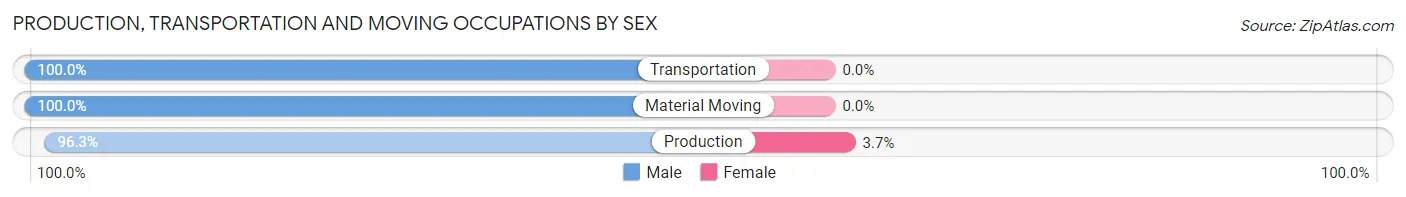
| Occupation | Male | Female |
| Production | 183 (96.3%) | 7 (3.7%) |
| Transportation | 101 (100.0%) | 0 (0.0%) |
| Material Moving | 144 (100.0%) | 0 (0.0%) |
| Total (Category) | 428 (98.4%) | 7 (1.6%) |
| Total (Overall) | 1,237 (42.8%) | 1,653 (57.2%) |
Employment Industries by Sex in Barnesville
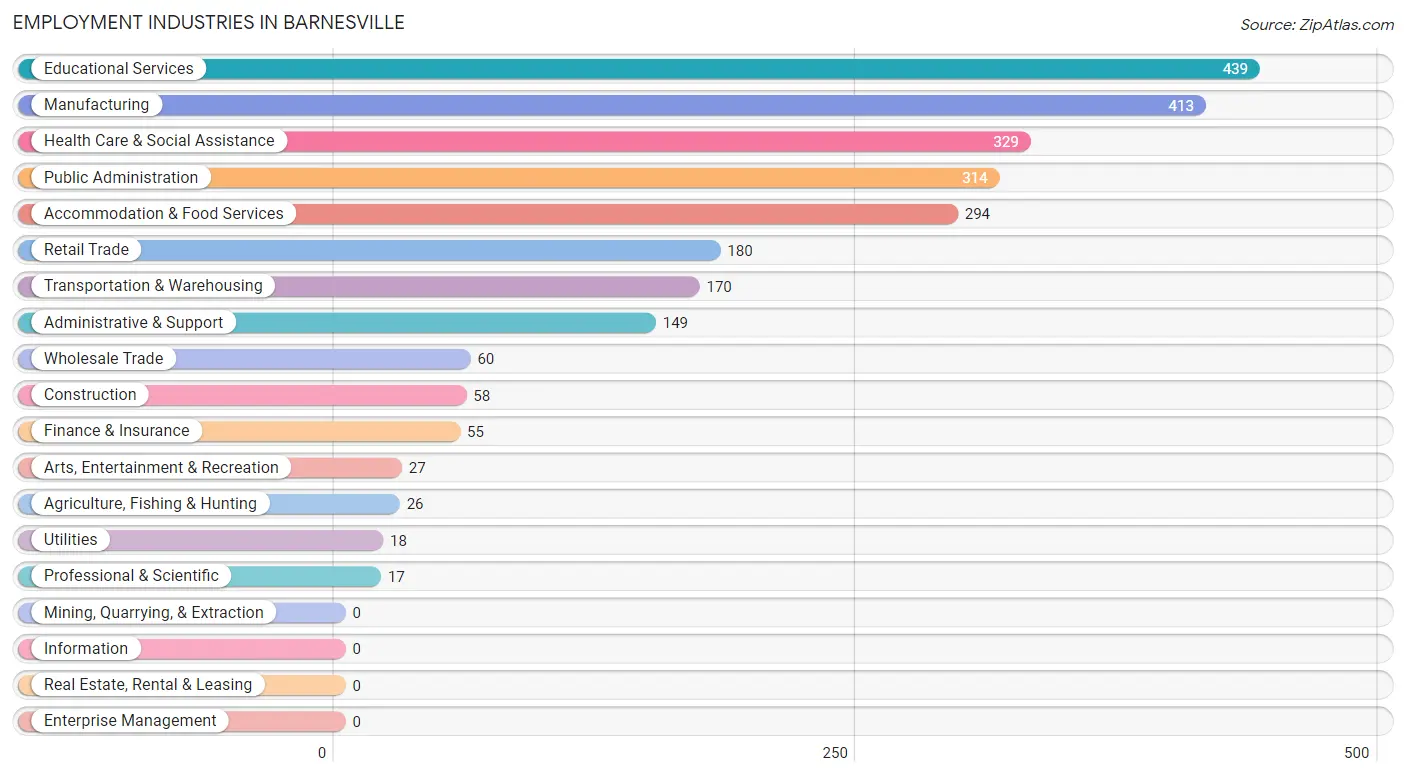
Employment Industries in Barnesville
The major employment industries in Barnesville include Educational Services (439 | 15.2%), Manufacturing (413 | 14.3%), Health Care & Social Assistance (329 | 11.4%), Public Administration (314 | 10.9%), and Accommodation & Food Services (294 | 10.2%).
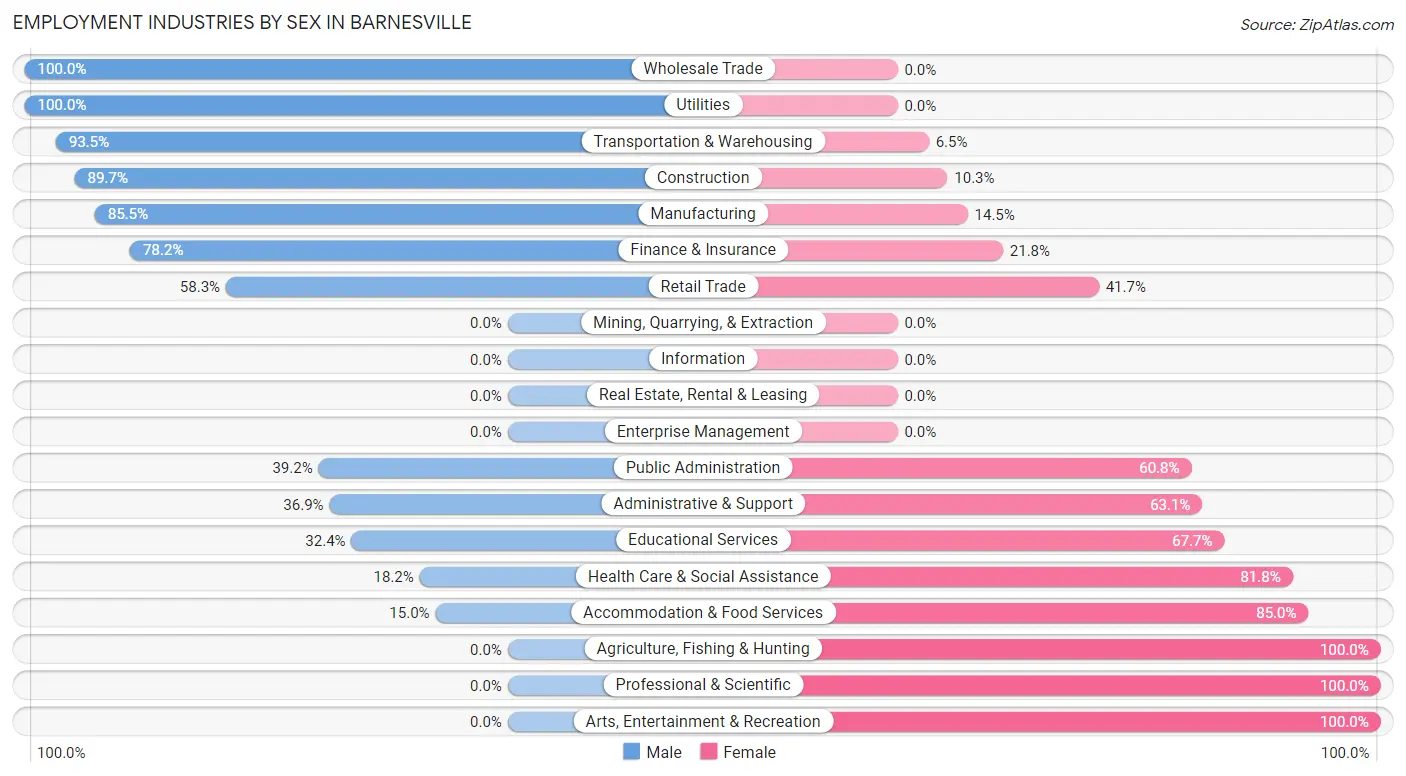
Employment Industries by Sex in Barnesville
The Barnesville industries that see more men than women are Wholesale Trade (100.0%), Utilities (100.0%), and Transportation & Warehousing (93.5%), whereas the industries that tend to have a higher number of women are Agriculture, Fishing & Hunting (100.0%), Professional & Scientific (100.0%), and Arts, Entertainment & Recreation (100.0%).
| Industry | Male | Female |
| Agriculture, Fishing & Hunting | 0 (0.0%) | 26 (100.0%) |
| Mining, Quarrying, & Extraction | 0 (0.0%) | 0 (0.0%) |
| Construction | 52 (89.7%) | 6 (10.3%) |
| Manufacturing | 353 (85.5%) | 60 (14.5%) |
| Wholesale Trade | 60 (100.0%) | 0 (0.0%) |
| Retail Trade | 105 (58.3%) | 75 (41.7%) |
| Transportation & Warehousing | 159 (93.5%) | 11 (6.5%) |
| Utilities | 18 (100.0%) | 0 (0.0%) |
| Information | 0 (0.0%) | 0 (0.0%) |
| Finance & Insurance | 43 (78.2%) | 12 (21.8%) |
| Real Estate, Rental & Leasing | 0 (0.0%) | 0 (0.0%) |
| Professional & Scientific | 0 (0.0%) | 17 (100.0%) |
| Enterprise Management | 0 (0.0%) | 0 (0.0%) |
| Administrative & Support | 55 (36.9%) | 94 (63.1%) |
| Educational Services | 142 (32.4%) | 297 (67.6%) |
| Health Care & Social Assistance | 60 (18.2%) | 269 (81.8%) |
| Arts, Entertainment & Recreation | 0 (0.0%) | 27 (100.0%) |
| Accommodation & Food Services | 44 (15.0%) | 250 (85.0%) |
| Public Administration | 123 (39.2%) | 191 (60.8%) |
| Total | 1,237 (42.8%) | 1,653 (57.2%) |
Education in Barnesville
School Enrollment in Barnesville
The most common levels of schooling among the 2,171 students in Barnesville are college / undergraduate (1,169 | 53.8%), middle school (384 | 17.7%), and high school (329 | 15.1%).
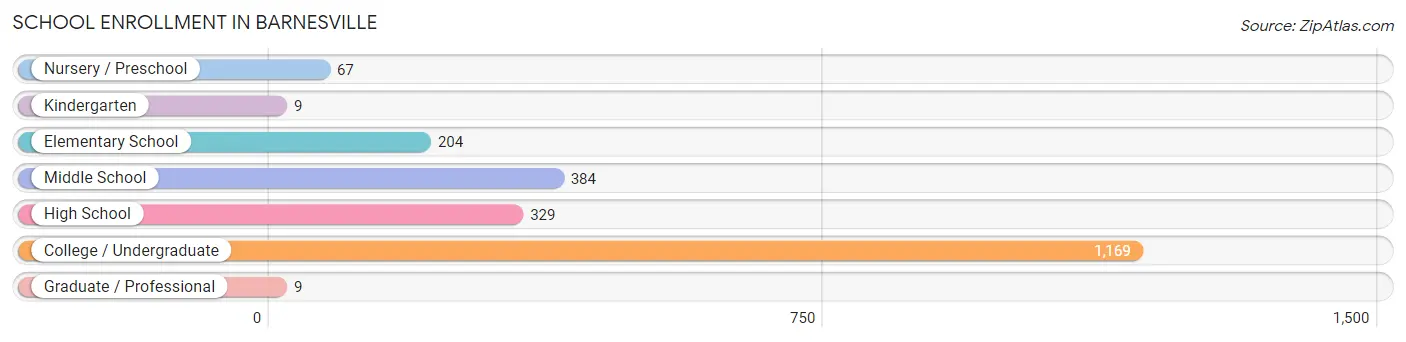
| School Level | # Students | % Students |
| Nursery / Preschool | 67 | 3.1% |
| Kindergarten | 9 | 0.4% |
| Elementary School | 204 | 9.4% |
| Middle School | 384 | 17.7% |
| High School | 329 | 15.1% |
| College / Undergraduate | 1,169 | 53.8% |
| Graduate / Professional | 9 | 0.4% |
| Total | 2,171 | 100.0% |
School Enrollment by Age by Funding Source in Barnesville
Out of a total of 2,171 students who are enrolled in schools in Barnesville, 204 (9.4%) attend a private institution, while the remaining 1,967 (90.6%) are enrolled in public schools. The age group of 20 to 24 year olds has the highest likelihood of being enrolled in private schools, with 131 (25.4% in the age bracket) enrolled. Conversely, the age group of 3 to 4 year olds has the lowest likelihood of being enrolled in a private school, with 9 (100.0% in the age bracket) attending a public institution.
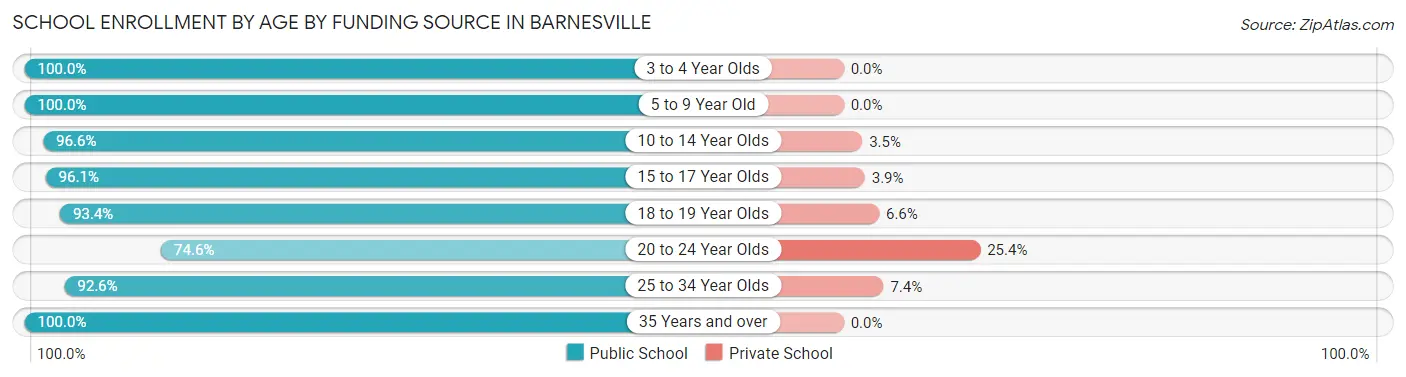
| Age Bracket | Public School | Private School |
| 3 to 4 Year Olds | 9 (100.0%) | 0 (0.0%) |
| 5 to 9 Year Old | 251 (100.0%) | 0 (0.0%) |
| 10 to 14 Year Olds | 392 (96.6%) | 14 (3.5%) |
| 15 to 17 Year Olds | 269 (96.1%) | 11 (3.9%) |
| 18 to 19 Year Olds | 581 (93.4%) | 41 (6.6%) |
| 20 to 24 Year Olds | 384 (74.6%) | 131 (25.4%) |
| 25 to 34 Year Olds | 75 (92.6%) | 6 (7.4%) |
| 35 Years and over | 7 (100.0%) | 0 (0.0%) |
| Total | 1,967 (90.6%) | 204 (9.4%) |
Educational Attainment by Field of Study in Barnesville
Science & technology (133 | 22.6%), education (131 | 22.2%), social sciences (64 | 10.9%), communications (56 | 9.5%), and business (53 | 9.0%) are the most common fields of study among 589 individuals in Barnesville who have obtained a bachelor's degree or higher.
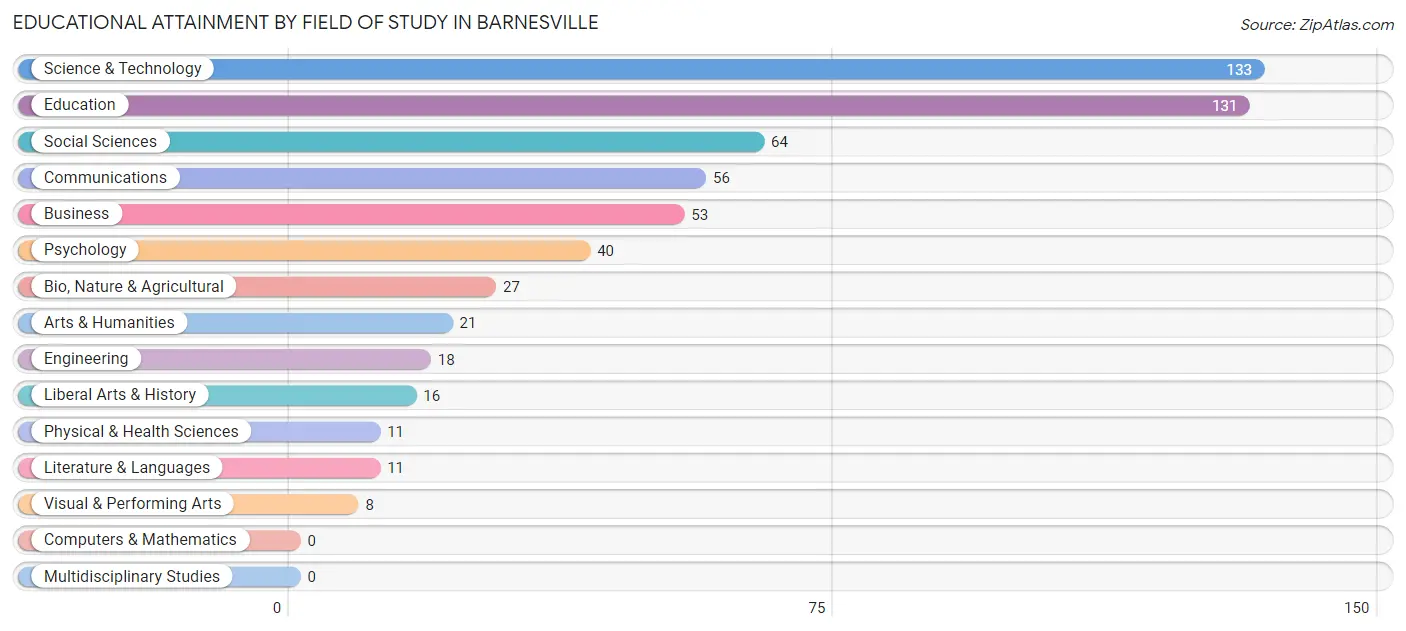
| Field of Study | # Graduates | % Graduates |
| Computers & Mathematics | 0 | 0.0% |
| Bio, Nature & Agricultural | 27 | 4.6% |
| Physical & Health Sciences | 11 | 1.9% |
| Psychology | 40 | 6.8% |
| Social Sciences | 64 | 10.9% |
| Engineering | 18 | 3.1% |
| Multidisciplinary Studies | 0 | 0.0% |
| Science & Technology | 133 | 22.6% |
| Business | 53 | 9.0% |
| Education | 131 | 22.2% |
| Literature & Languages | 11 | 1.9% |
| Liberal Arts & History | 16 | 2.7% |
| Visual & Performing Arts | 8 | 1.4% |
| Communications | 56 | 9.5% |
| Arts & Humanities | 21 | 3.6% |
| Total | 589 | 100.0% |
Transportation & Commute in Barnesville
Vehicle Availability by Sex in Barnesville
The most prevalent vehicle ownership categories in Barnesville are males with 2 vehicles (436, accounting for 37.7%) and females with 2 vehicles (520, making up 30.5%).
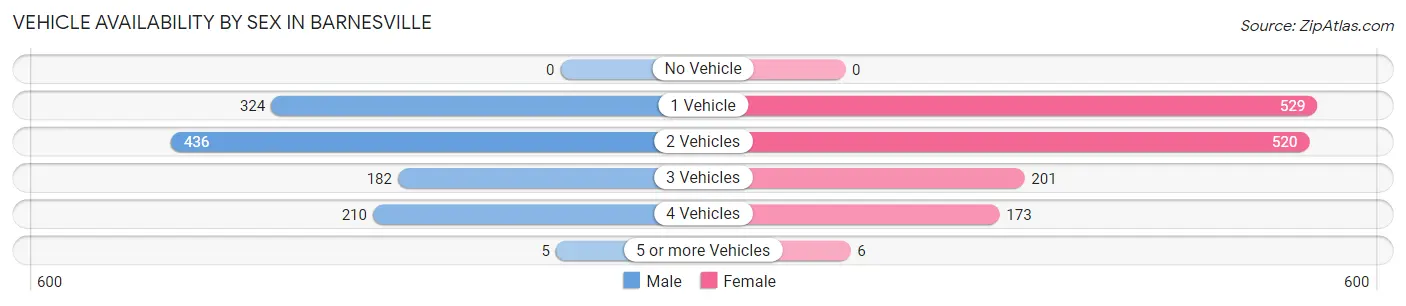
| Vehicles Available | Male | Female |
| No Vehicle | 0 (0.0%) | 0 (0.0%) |
| 1 Vehicle | 324 (28.0%) | 529 (37.0%) |
| 2 Vehicles | 436 (37.7%) | 520 (36.4%) |
| 3 Vehicles | 182 (15.7%) | 201 (14.1%) |
| 4 Vehicles | 210 (18.1%) | 173 (12.1%) |
| 5 or more Vehicles | 5 (0.4%) | 6 (0.4%) |
| Total | 1,157 (100.0%) | 1,429 (100.0%) |
Commute Time in Barnesville
The most frequently occuring commute durations in Barnesville are 5 to 9 minutes (679 commuters, 24.3%), less than 5 minutes (433 commuters, 15.5%), and 20 to 24 minutes (416 commuters, 14.9%).
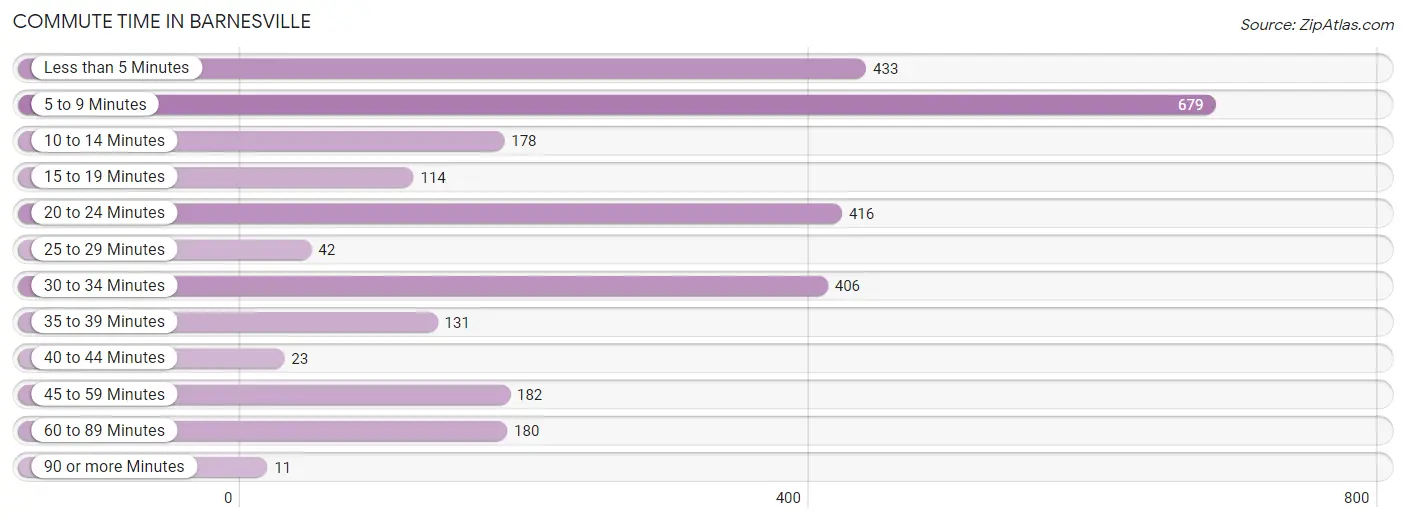
| Commute Time | # Commuters | % Commuters |
| Less than 5 Minutes | 433 | 15.5% |
| 5 to 9 Minutes | 679 | 24.3% |
| 10 to 14 Minutes | 178 | 6.4% |
| 15 to 19 Minutes | 114 | 4.1% |
| 20 to 24 Minutes | 416 | 14.9% |
| 25 to 29 Minutes | 42 | 1.5% |
| 30 to 34 Minutes | 406 | 14.5% |
| 35 to 39 Minutes | 131 | 4.7% |
| 40 to 44 Minutes | 23 | 0.8% |
| 45 to 59 Minutes | 182 | 6.5% |
| 60 to 89 Minutes | 180 | 6.4% |
| 90 or more Minutes | 11 | 0.4% |
Commute Time by Sex in Barnesville
The most common commute times in Barnesville are 5 to 9 minutes (258 commuters, 21.4%) for males and 5 to 9 minutes (421 commuters, 26.5%) for females.
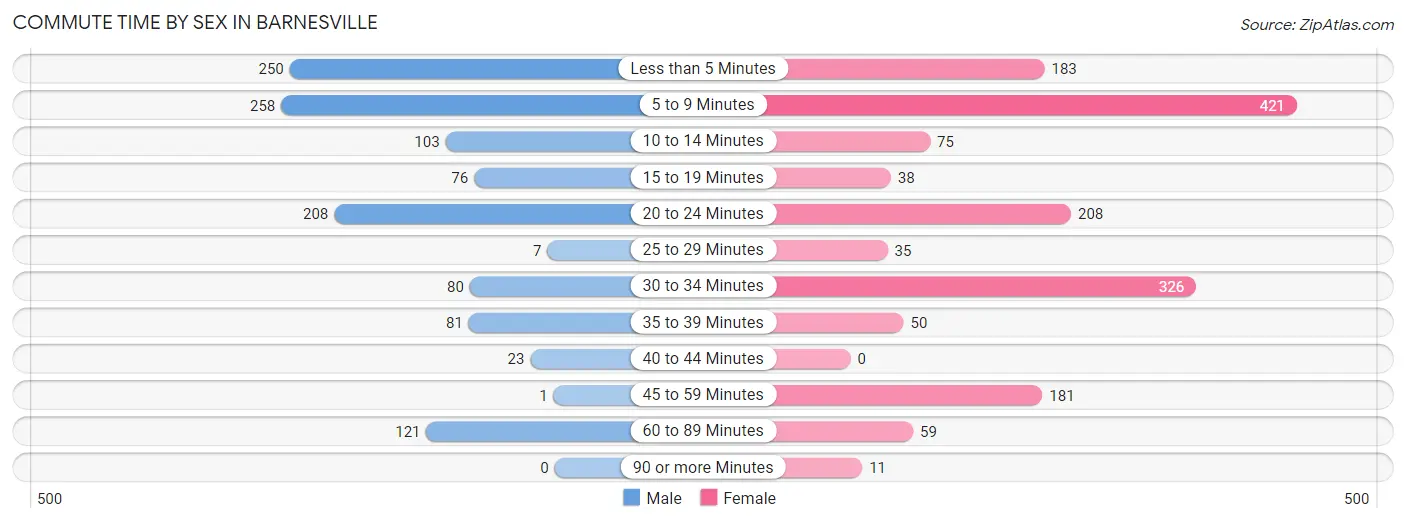
| Commute Time | Male | Female |
| Less than 5 Minutes | 250 (20.7%) | 183 (11.5%) |
| 5 to 9 Minutes | 258 (21.4%) | 421 (26.5%) |
| 10 to 14 Minutes | 103 (8.5%) | 75 (4.7%) |
| 15 to 19 Minutes | 76 (6.3%) | 38 (2.4%) |
| 20 to 24 Minutes | 208 (17.2%) | 208 (13.1%) |
| 25 to 29 Minutes | 7 (0.6%) | 35 (2.2%) |
| 30 to 34 Minutes | 80 (6.6%) | 326 (20.5%) |
| 35 to 39 Minutes | 81 (6.7%) | 50 (3.2%) |
| 40 to 44 Minutes | 23 (1.9%) | 0 (0.0%) |
| 45 to 59 Minutes | 1 (0.1%) | 181 (11.4%) |
| 60 to 89 Minutes | 121 (10.0%) | 59 (3.7%) |
| 90 or more Minutes | 0 (0.0%) | 11 (0.7%) |
Time of Departure to Work by Sex in Barnesville
The most frequent times of departure to work in Barnesville are 7:00 AM to 7:29 AM (290, 24.0%) for males and 7:00 AM to 7:29 AM (314, 19.8%) for females.
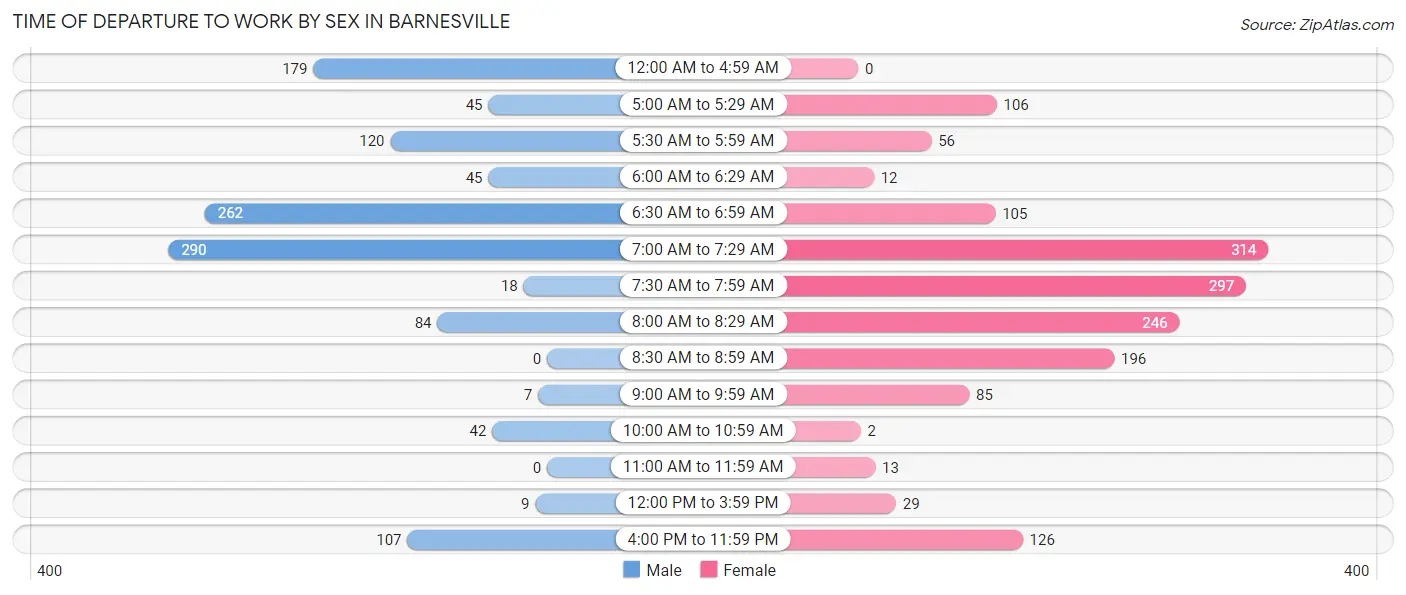
| Time of Departure | Male | Female |
| 12:00 AM to 4:59 AM | 179 (14.8%) | 0 (0.0%) |
| 5:00 AM to 5:29 AM | 45 (3.7%) | 106 (6.7%) |
| 5:30 AM to 5:59 AM | 120 (9.9%) | 56 (3.5%) |
| 6:00 AM to 6:29 AM | 45 (3.7%) | 12 (0.8%) |
| 6:30 AM to 6:59 AM | 262 (21.7%) | 105 (6.6%) |
| 7:00 AM to 7:29 AM | 290 (24.0%) | 314 (19.8%) |
| 7:30 AM to 7:59 AM | 18 (1.5%) | 297 (18.7%) |
| 8:00 AM to 8:29 AM | 84 (7.0%) | 246 (15.5%) |
| 8:30 AM to 8:59 AM | 0 (0.0%) | 196 (12.3%) |
| 9:00 AM to 9:59 AM | 7 (0.6%) | 85 (5.4%) |
| 10:00 AM to 10:59 AM | 42 (3.5%) | 2 (0.1%) |
| 11:00 AM to 11:59 AM | 0 (0.0%) | 13 (0.8%) |
| 12:00 PM to 3:59 PM | 9 (0.7%) | 29 (1.8%) |
| 4:00 PM to 11:59 PM | 107 (8.9%) | 126 (7.9%) |
| Total | 1,208 (100.0%) | 1,587 (100.0%) |
Housing Occupancy in Barnesville
Occupancy by Ownership in Barnesville
Of the total 2,192 dwellings in Barnesville, owner-occupied units account for 1,014 (46.3%), while renter-occupied units make up 1,178 (53.7%).
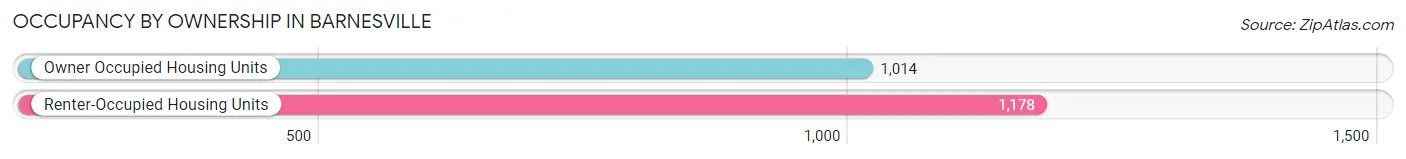
| Occupancy | # Housing Units | % Housing Units |
| Owner Occupied Housing Units | 1,014 | 46.3% |
| Renter-Occupied Housing Units | 1,178 | 53.7% |
| Total Occupied Housing Units | 2,192 | 100.0% |
Occupancy by Household Size in Barnesville
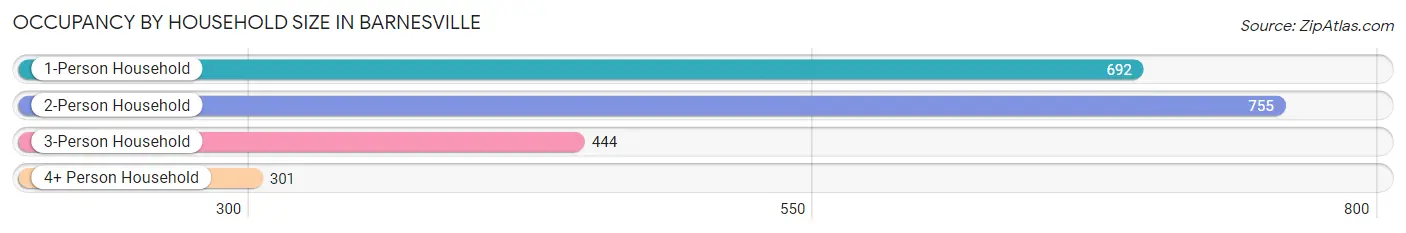
| Household Size | # Housing Units | % Housing Units |
| 1-Person Household | 692 | 31.6% |
| 2-Person Household | 755 | 34.4% |
| 3-Person Household | 444 | 20.3% |
| 4+ Person Household | 301 | 13.7% |
| Total Housing Units | 2,192 | 100.0% |
Occupancy by Ownership by Household Size in Barnesville
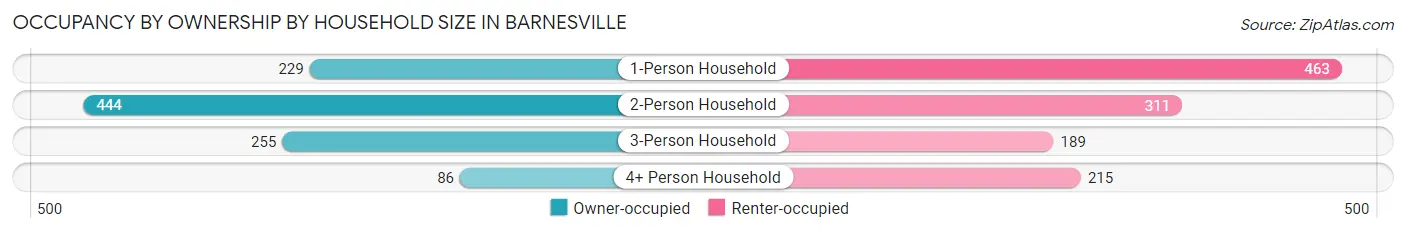
| Household Size | Owner-occupied | Renter-occupied |
| 1-Person Household | 229 (33.1%) | 463 (66.9%) |
| 2-Person Household | 444 (58.8%) | 311 (41.2%) |
| 3-Person Household | 255 (57.4%) | 189 (42.6%) |
| 4+ Person Household | 86 (28.6%) | 215 (71.4%) |
| Total Housing Units | 1,014 (46.3%) | 1,178 (53.7%) |
Occupancy by Educational Attainment in Barnesville
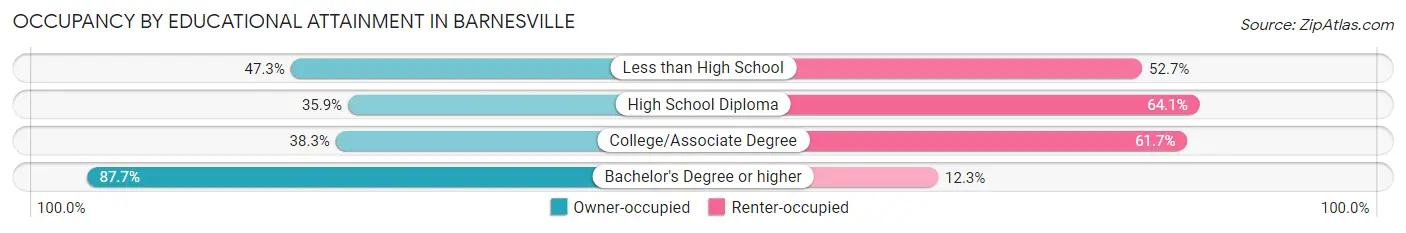
| Household Size | Owner-occupied | Renter-occupied |
| Less than High School | 138 (47.3%) | 154 (52.7%) |
| High School Diploma | 253 (35.9%) | 452 (64.1%) |
| College/Associate Degree | 330 (38.3%) | 531 (61.7%) |
| Bachelor's Degree or higher | 293 (87.7%) | 41 (12.3%) |
Occupancy by Age of Householder in Barnesville
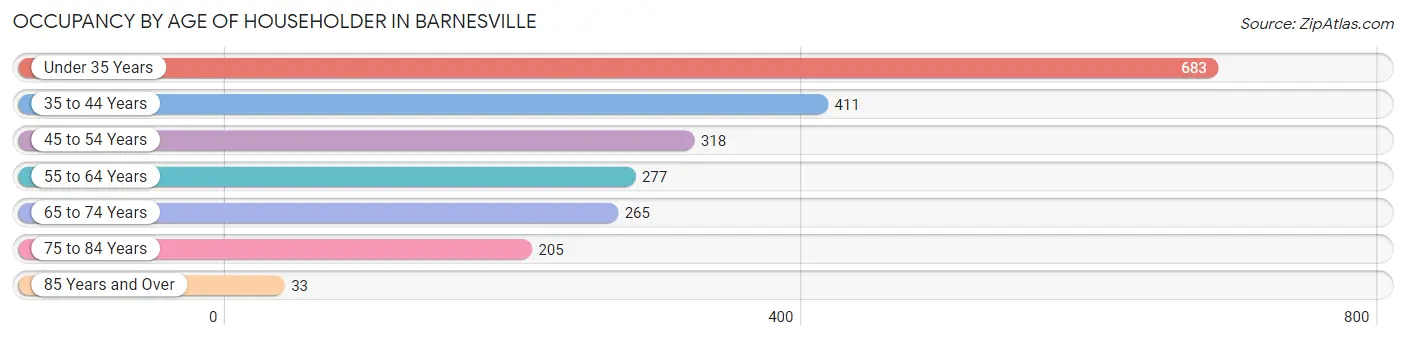
| Age Bracket | # Households | % Households |
| Under 35 Years | 683 | 31.2% |
| 35 to 44 Years | 411 | 18.8% |
| 45 to 54 Years | 318 | 14.5% |
| 55 to 64 Years | 277 | 12.6% |
| 65 to 74 Years | 265 | 12.1% |
| 75 to 84 Years | 205 | 9.3% |
| 85 Years and Over | 33 | 1.5% |
| Total | 2,192 | 100.0% |
Housing Finances in Barnesville
Median Income by Occupancy in Barnesville
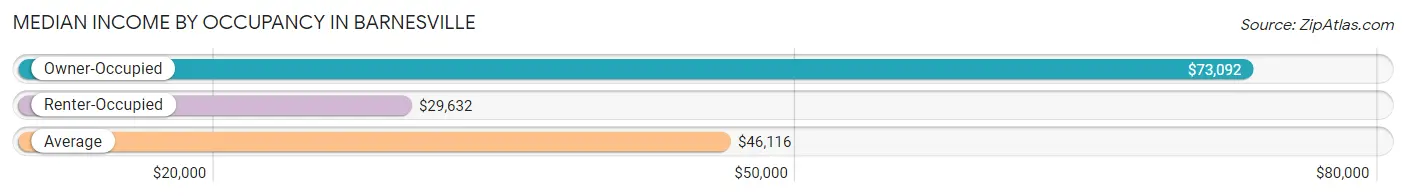
| Occupancy Type | # Households | Median Income |
| Owner-Occupied | 1,014 (46.3%) | $73,092 |
| Renter-Occupied | 1,178 (53.7%) | $29,632 |
| Average | 2,192 (100.0%) | $46,116 |
Occupancy by Householder Income Bracket in Barnesville
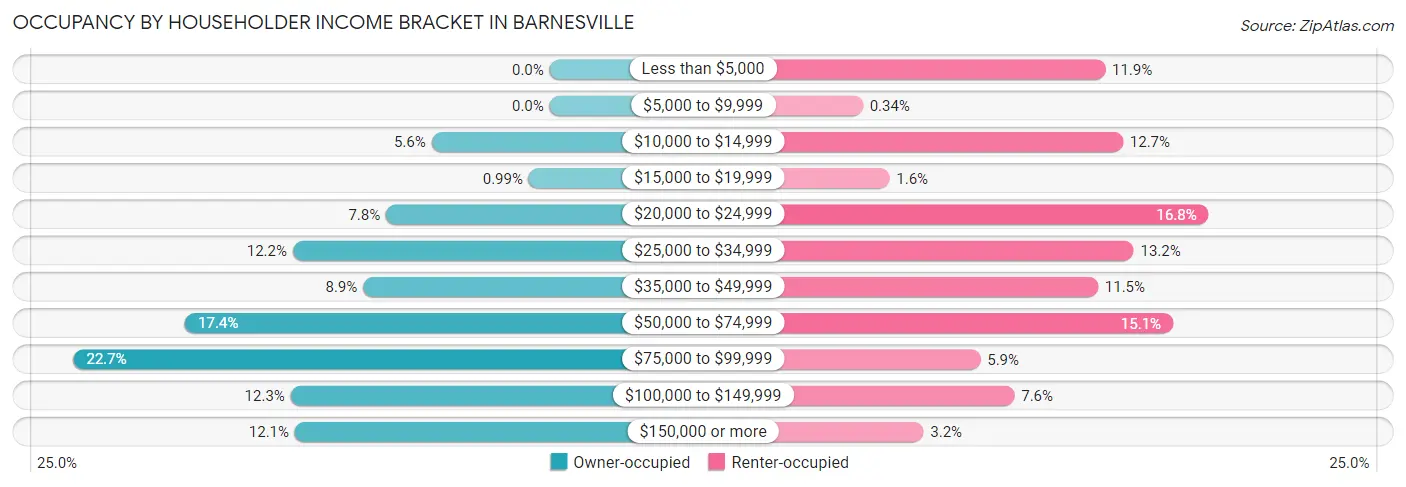
| Income Bracket | Owner-occupied | Renter-occupied |
| Less than $5,000 | 0 (0.0%) | 140 (11.9%) |
| $5,000 to $9,999 | 0 (0.0%) | 4 (0.3%) |
| $10,000 to $14,999 | 57 (5.6%) | 150 (12.7%) |
| $15,000 to $19,999 | 10 (1.0%) | 19 (1.6%) |
| $20,000 to $24,999 | 79 (7.8%) | 198 (16.8%) |
| $25,000 to $34,999 | 124 (12.2%) | 156 (13.2%) |
| $35,000 to $49,999 | 90 (8.9%) | 136 (11.5%) |
| $50,000 to $74,999 | 176 (17.4%) | 178 (15.1%) |
| $75,000 to $99,999 | 230 (22.7%) | 70 (5.9%) |
| $100,000 to $149,999 | 125 (12.3%) | 89 (7.6%) |
| $150,000 or more | 123 (12.1%) | 38 (3.2%) |
| Total | 1,014 (100.0%) | 1,178 (100.0%) |
Monthly Housing Cost Tiers in Barnesville
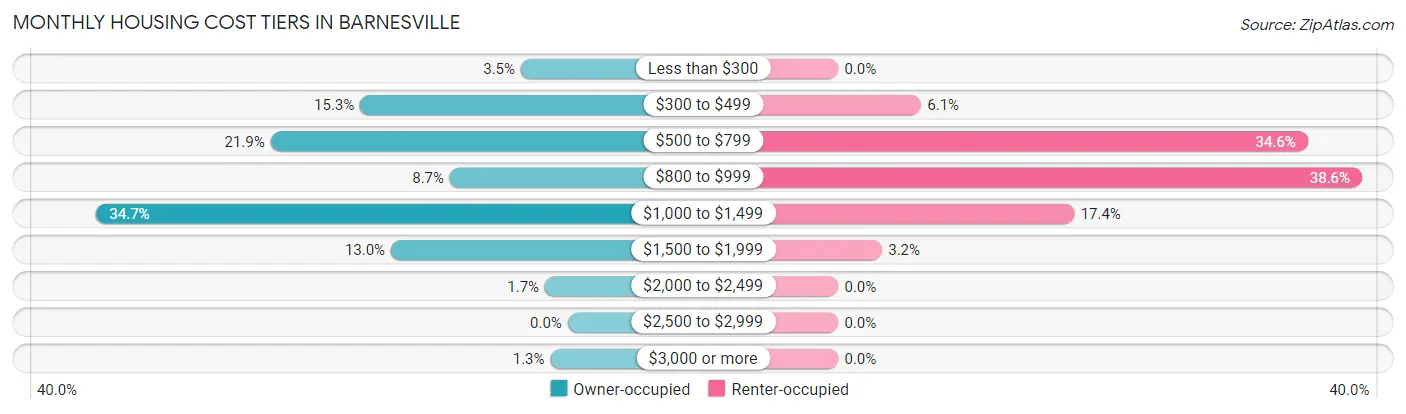
| Monthly Cost | Owner-occupied | Renter-occupied |
| Less than $300 | 35 (3.5%) | 0 (0.0%) |
| $300 to $499 | 155 (15.3%) | 72 (6.1%) |
| $500 to $799 | 222 (21.9%) | 408 (34.6%) |
| $800 to $999 | 88 (8.7%) | 455 (38.6%) |
| $1,000 to $1,499 | 352 (34.7%) | 205 (17.4%) |
| $1,500 to $1,999 | 132 (13.0%) | 38 (3.2%) |
| $2,000 to $2,499 | 17 (1.7%) | 0 (0.0%) |
| $2,500 to $2,999 | 0 (0.0%) | 0 (0.0%) |
| $3,000 or more | 13 (1.3%) | 0 (0.0%) |
| Total | 1,014 (100.0%) | 1,178 (100.0%) |
Physical Housing Characteristics in Barnesville
Housing Structures in Barnesville
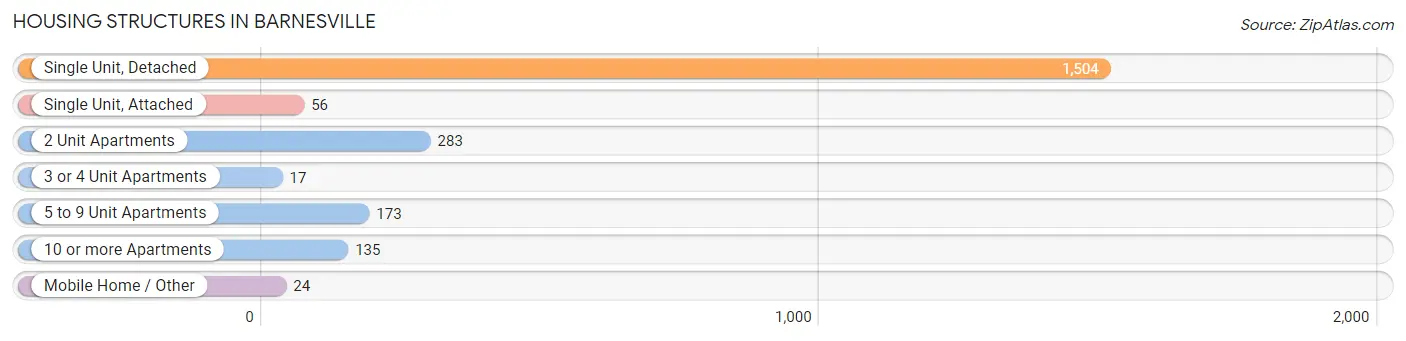
| Structure Type | # Housing Units | % Housing Units |
| Single Unit, Detached | 1,504 | 68.6% |
| Single Unit, Attached | 56 | 2.5% |
| 2 Unit Apartments | 283 | 12.9% |
| 3 or 4 Unit Apartments | 17 | 0.8% |
| 5 to 9 Unit Apartments | 173 | 7.9% |
| 10 or more Apartments | 135 | 6.2% |
| Mobile Home / Other | 24 | 1.1% |
| Total | 2,192 | 100.0% |
Housing Structures by Occupancy in Barnesville
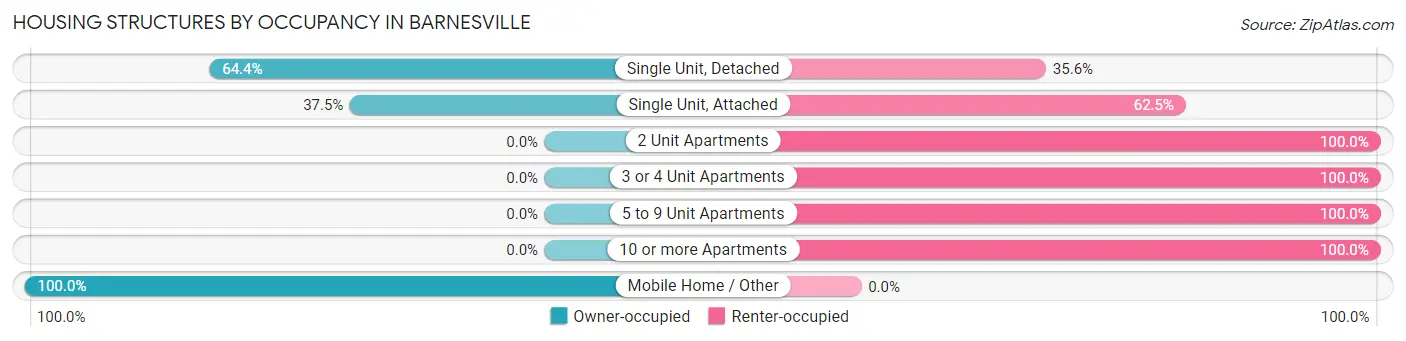
| Structure Type | Owner-occupied | Renter-occupied |
| Single Unit, Detached | 969 (64.4%) | 535 (35.6%) |
| Single Unit, Attached | 21 (37.5%) | 35 (62.5%) |
| 2 Unit Apartments | 0 (0.0%) | 283 (100.0%) |
| 3 or 4 Unit Apartments | 0 (0.0%) | 17 (100.0%) |
| 5 to 9 Unit Apartments | 0 (0.0%) | 173 (100.0%) |
| 10 or more Apartments | 0 (0.0%) | 135 (100.0%) |
| Mobile Home / Other | 24 (100.0%) | 0 (0.0%) |
| Total | 1,014 (46.3%) | 1,178 (53.7%) |
Housing Structures by Number of Rooms in Barnesville
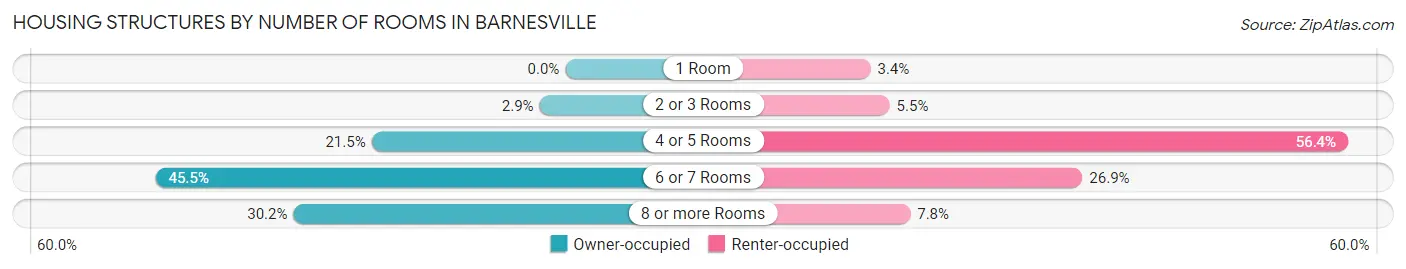
| Number of Rooms | Owner-occupied | Renter-occupied |
| 1 Room | 0 (0.0%) | 40 (3.4%) |
| 2 or 3 Rooms | 29 (2.9%) | 65 (5.5%) |
| 4 or 5 Rooms | 218 (21.5%) | 664 (56.4%) |
| 6 or 7 Rooms | 461 (45.5%) | 317 (26.9%) |
| 8 or more Rooms | 306 (30.2%) | 92 (7.8%) |
| Total | 1,014 (100.0%) | 1,178 (100.0%) |
Housing Structure by Heating Type in Barnesville
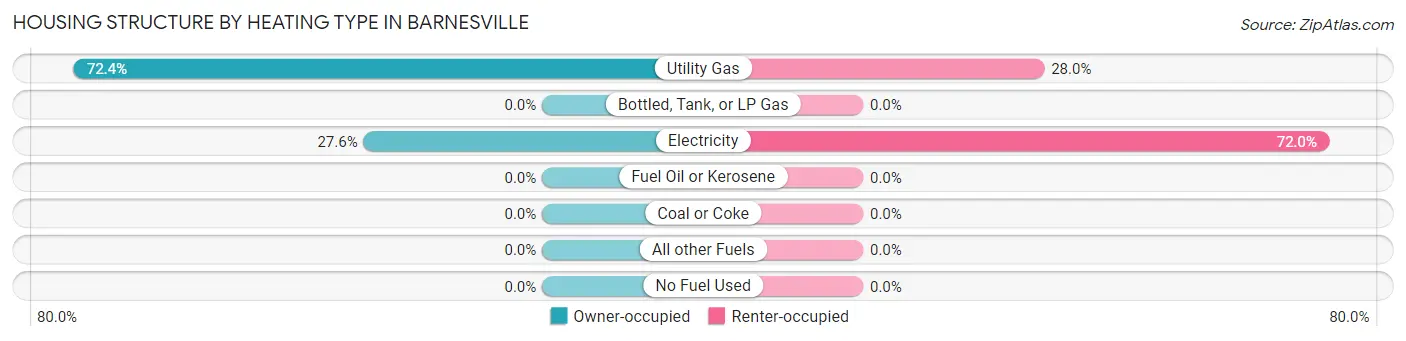
| Heating Type | Owner-occupied | Renter-occupied |
| Utility Gas | 734 (72.4%) | 330 (28.0%) |
| Bottled, Tank, or LP Gas | 0 (0.0%) | 0 (0.0%) |
| Electricity | 280 (27.6%) | 848 (72.0%) |
| Fuel Oil or Kerosene | 0 (0.0%) | 0 (0.0%) |
| Coal or Coke | 0 (0.0%) | 0 (0.0%) |
| All other Fuels | 0 (0.0%) | 0 (0.0%) |
| No Fuel Used | 0 (0.0%) | 0 (0.0%) |
| Total | 1,014 (100.0%) | 1,178 (100.0%) |
Household Vehicle Usage in Barnesville
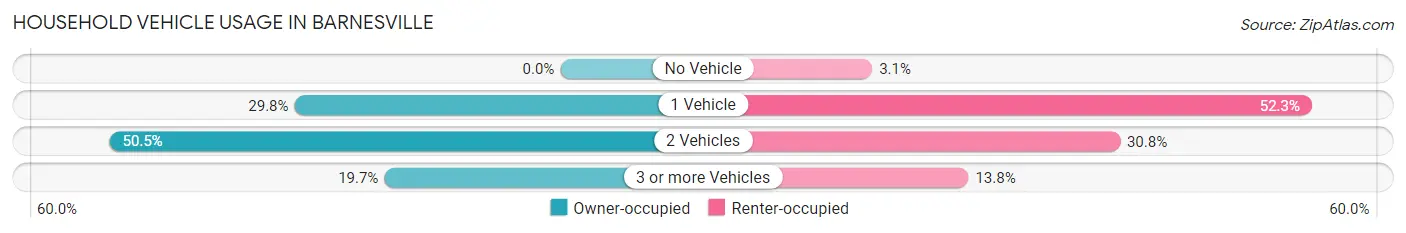
| Vehicles per Household | Owner-occupied | Renter-occupied |
| No Vehicle | 0 (0.0%) | 36 (3.1%) |
| 1 Vehicle | 302 (29.8%) | 616 (52.3%) |
| 2 Vehicles | 512 (50.5%) | 363 (30.8%) |
| 3 or more Vehicles | 200 (19.7%) | 163 (13.8%) |
| Total | 1,014 (100.0%) | 1,178 (100.0%) |
Real Estate & Mortgages in Barnesville
Real Estate and Mortgage Overview in Barnesville
| Characteristic | Without Mortgage | With Mortgage |
| Housing Units | 435 | 579 |
| Median Property Value | $192,000 | $140,600 |
| Median Household Income | - | - |
| Monthly Housing Costs | $537 | $13 |
| Real Estate Taxes | $1,470 | $0 |
Property Value by Mortgage Status in Barnesville
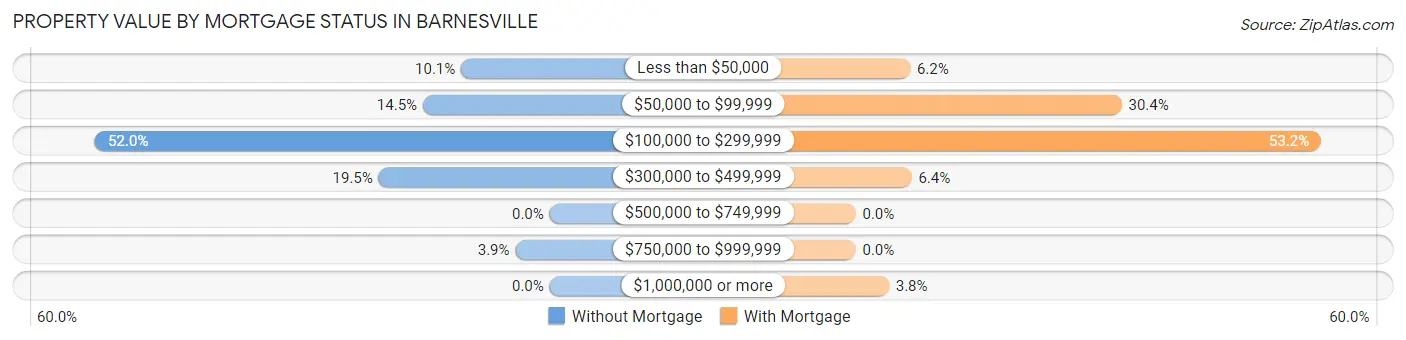
| Property Value | Without Mortgage | With Mortgage |
| Less than $50,000 | 44 (10.1%) | 36 (6.2%) |
| $50,000 to $99,999 | 63 (14.5%) | 176 (30.4%) |
| $100,000 to $299,999 | 226 (51.9%) | 308 (53.2%) |
| $300,000 to $499,999 | 85 (19.5%) | 37 (6.4%) |
| $500,000 to $749,999 | 0 (0.0%) | 0 (0.0%) |
| $750,000 to $999,999 | 17 (3.9%) | 0 (0.0%) |
| $1,000,000 or more | 0 (0.0%) | 22 (3.8%) |
| Total | 435 (100.0%) | 579 (100.0%) |
Household Income by Mortgage Status in Barnesville
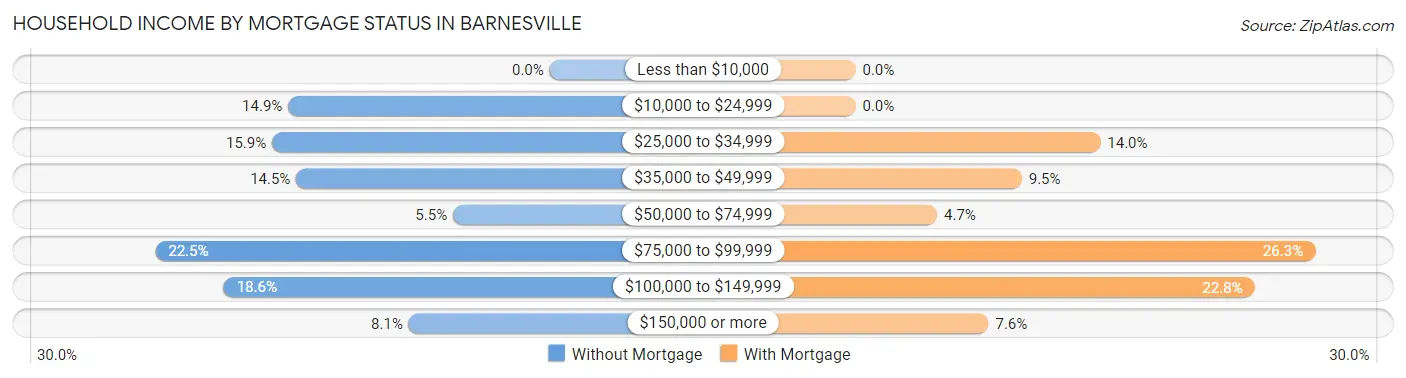
| Household Income | Without Mortgage | With Mortgage |
| Less than $10,000 | 0 (0.0%) | 0 (0.0%) |
| $10,000 to $24,999 | 65 (14.9%) | 0 (0.0%) |
| $25,000 to $34,999 | 69 (15.9%) | 81 (14.0%) |
| $35,000 to $49,999 | 63 (14.5%) | 55 (9.5%) |
| $50,000 to $74,999 | 24 (5.5%) | 27 (4.7%) |
| $75,000 to $99,999 | 98 (22.5%) | 152 (26.3%) |
| $100,000 to $149,999 | 81 (18.6%) | 132 (22.8%) |
| $150,000 or more | 35 (8.1%) | 44 (7.6%) |
| Total | 435 (100.0%) | 579 (100.0%) |
Property Value to Household Income Ratio in Barnesville
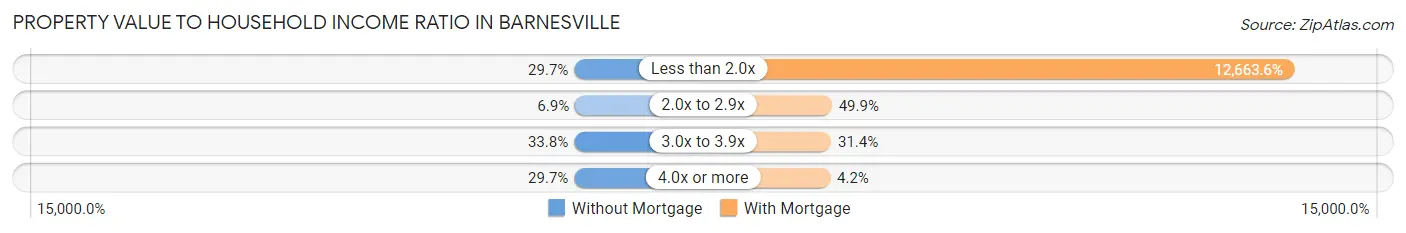
| Value-to-Income Ratio | Without Mortgage | With Mortgage |
| Less than 2.0x | 129 (29.7%) | 73,322 (12,663.6%) |
| 2.0x to 2.9x | 30 (6.9%) | 289 (49.9%) |
| 3.0x to 3.9x | 147 (33.8%) | 182 (31.4%) |
| 4.0x or more | 129 (29.7%) | 24 (4.2%) |
| Total | 435 (100.0%) | 579 (100.0%) |
Real Estate Taxes by Mortgage Status in Barnesville
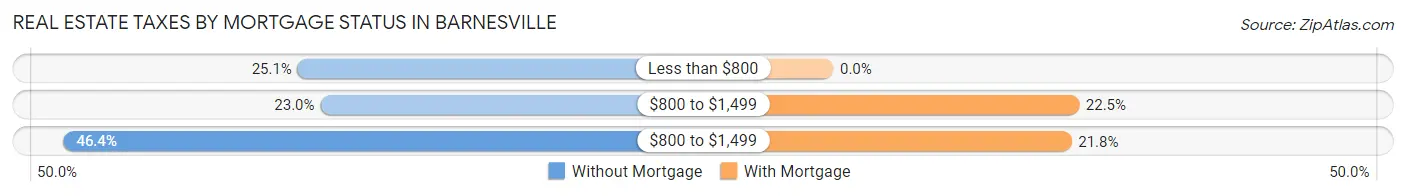
| Property Taxes | Without Mortgage | With Mortgage |
| Less than $800 | 109 (25.1%) | 0 (0.0%) |
| $800 to $1,499 | 100 (23.0%) | 130 (22.5%) |
| $800 to $1,499 | 202 (46.4%) | 126 (21.8%) |
| Total | 435 (100.0%) | 579 (100.0%) |
Health & Disability in Barnesville
Health Insurance Coverage by Age in Barnesville
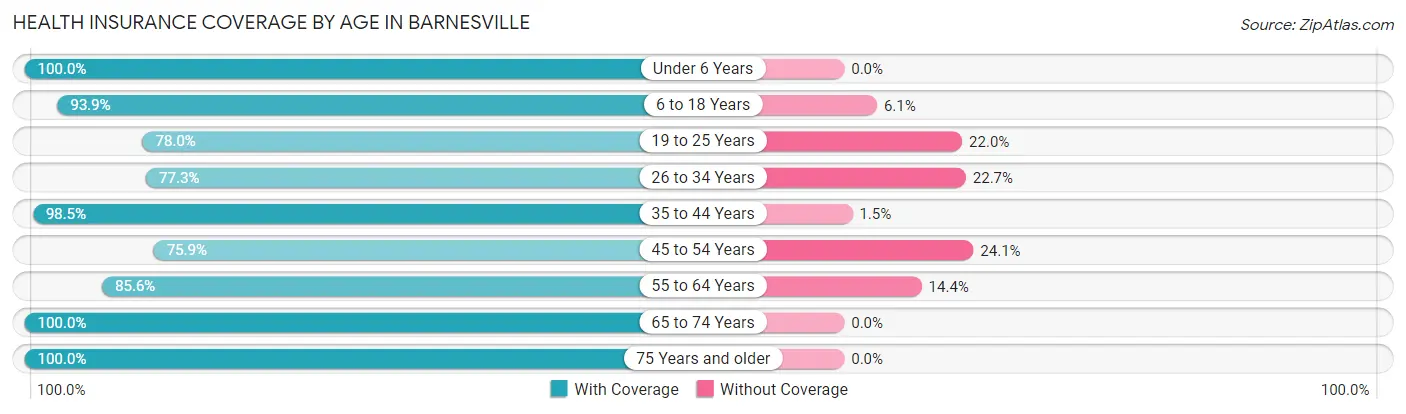
| Age Bracket | With Coverage | Without Coverage |
| Under 6 Years | 234 (100.0%) | 0 (0.0%) |
| 6 to 18 Years | 1,123 (93.9%) | 73 (6.1%) |
| 19 to 25 Years | 1,065 (78.0%) | 300 (22.0%) |
| 26 to 34 Years | 655 (77.3%) | 192 (22.7%) |
| 35 to 44 Years | 518 (98.5%) | 8 (1.5%) |
| 45 to 54 Years | 536 (75.9%) | 170 (24.1%) |
| 55 to 64 Years | 332 (85.6%) | 56 (14.4%) |
| 65 to 74 Years | 434 (100.0%) | 0 (0.0%) |
| 75 Years and older | 267 (100.0%) | 0 (0.0%) |
| Total | 5,164 (86.6%) | 799 (13.4%) |
Health Insurance Coverage by Citizenship Status in Barnesville
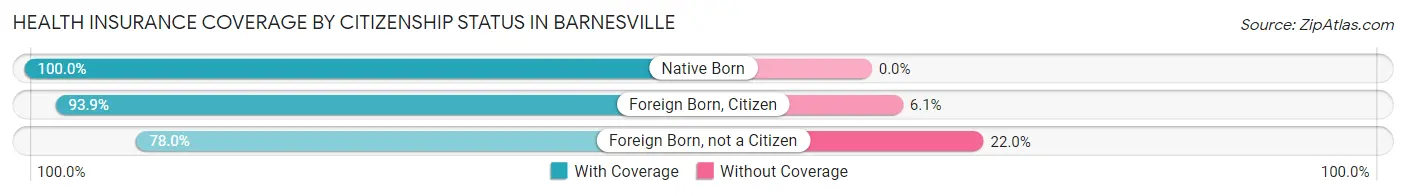
| Citizenship Status | With Coverage | Without Coverage |
| Native Born | 234 (100.0%) | 0 (0.0%) |
| Foreign Born, Citizen | 1,123 (93.9%) | 73 (6.1%) |
| Foreign Born, not a Citizen | 1,065 (78.0%) | 300 (22.0%) |
Health Insurance Coverage by Household Income in Barnesville
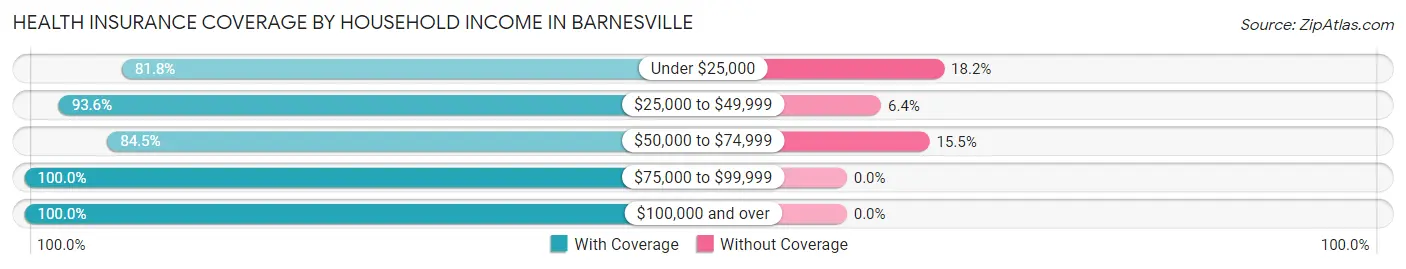
| Household Income | With Coverage | Without Coverage |
| Under $25,000 | 834 (81.8%) | 186 (18.2%) |
| $25,000 to $49,999 | 933 (93.6%) | 64 (6.4%) |
| $50,000 to $74,999 | 1,232 (84.5%) | 226 (15.5%) |
| $75,000 to $99,999 | 544 (100.0%) | 0 (0.0%) |
| $100,000 and over | 974 (100.0%) | 0 (0.0%) |
Public vs Private Health Insurance Coverage by Age in Barnesville
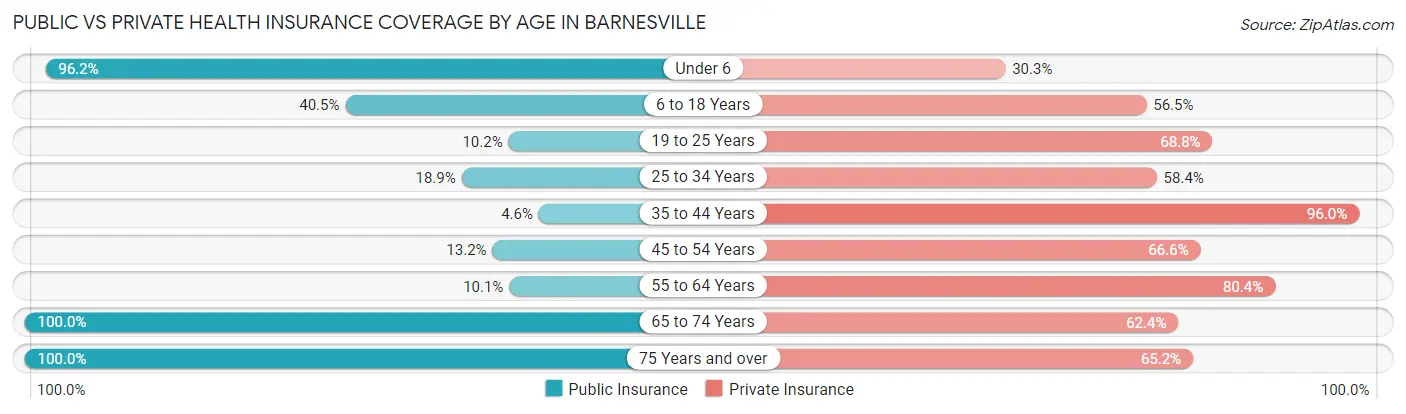
| Age Bracket | Public Insurance | Private Insurance |
| Under 6 | 225 (96.2%) | 71 (30.3%) |
| 6 to 18 Years | 484 (40.5%) | 676 (56.5%) |
| 19 to 25 Years | 139 (10.2%) | 939 (68.8%) |
| 25 to 34 Years | 160 (18.9%) | 495 (58.4%) |
| 35 to 44 Years | 24 (4.6%) | 505 (96.0%) |
| 45 to 54 Years | 93 (13.2%) | 470 (66.6%) |
| 55 to 64 Years | 39 (10.1%) | 312 (80.4%) |
| 65 to 74 Years | 434 (100.0%) | 271 (62.4%) |
| 75 Years and over | 267 (100.0%) | 174 (65.2%) |
| Total | 1,865 (31.3%) | 3,913 (65.6%) |
Disability Status by Sex by Age in Barnesville
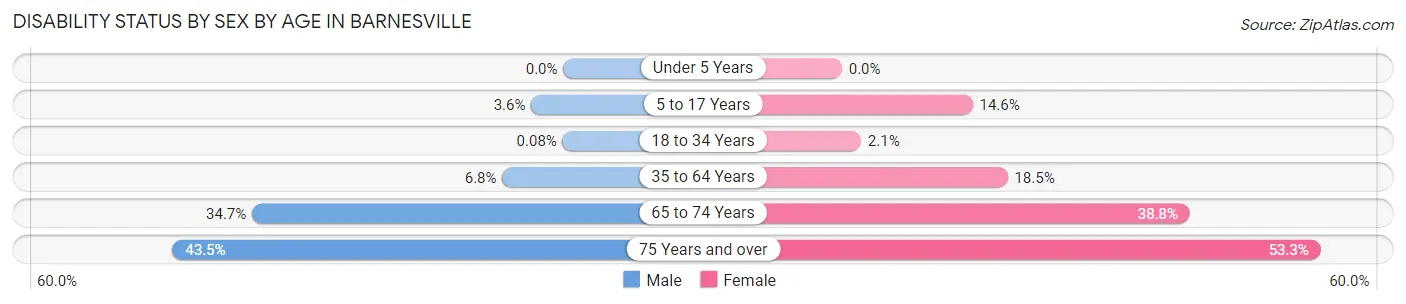
| Age Bracket | Male | Female |
| Under 5 Years | 0 (0.0%) | 0 (0.0%) |
| 5 to 17 Years | 19 (3.6%) | 61 (14.6%) |
| 18 to 34 Years | 1 (0.1%) | 27 (2.1%) |
| 35 to 64 Years | 46 (6.8%) | 174 (18.4%) |
| 65 to 74 Years | 61 (34.7%) | 100 (38.8%) |
| 75 Years and over | 64 (43.5%) | 64 (53.3%) |
Disability Class by Sex by Age in Barnesville
Disability Class: Hearing Difficulty
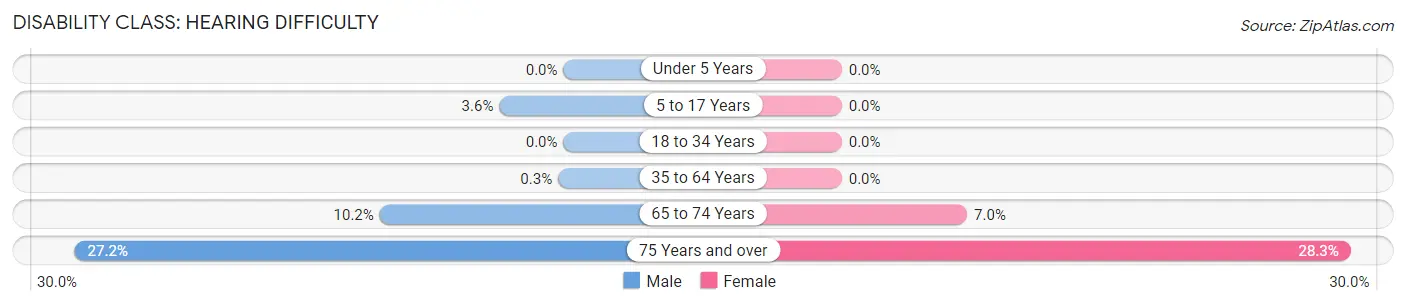
| Age Bracket | Male | Female |
| Under 5 Years | 0 (0.0%) | 0 (0.0%) |
| 5 to 17 Years | 19 (3.6%) | 0 (0.0%) |
| 18 to 34 Years | 0 (0.0%) | 0 (0.0%) |
| 35 to 64 Years | 2 (0.3%) | 0 (0.0%) |
| 65 to 74 Years | 18 (10.2%) | 18 (7.0%) |
| 75 Years and over | 40 (27.2%) | 34 (28.3%) |
Disability Class: Vision Difficulty
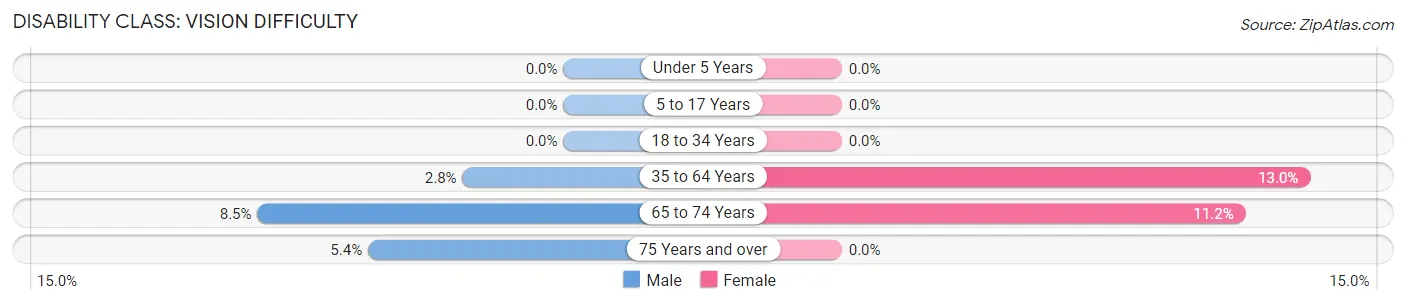
| Age Bracket | Male | Female |
| Under 5 Years | 0 (0.0%) | 0 (0.0%) |
| 5 to 17 Years | 0 (0.0%) | 0 (0.0%) |
| 18 to 34 Years | 0 (0.0%) | 0 (0.0%) |
| 35 to 64 Years | 19 (2.8%) | 123 (13.0%) |
| 65 to 74 Years | 15 (8.5%) | 29 (11.2%) |
| 75 Years and over | 8 (5.4%) | 0 (0.0%) |
Disability Class: Cognitive Difficulty
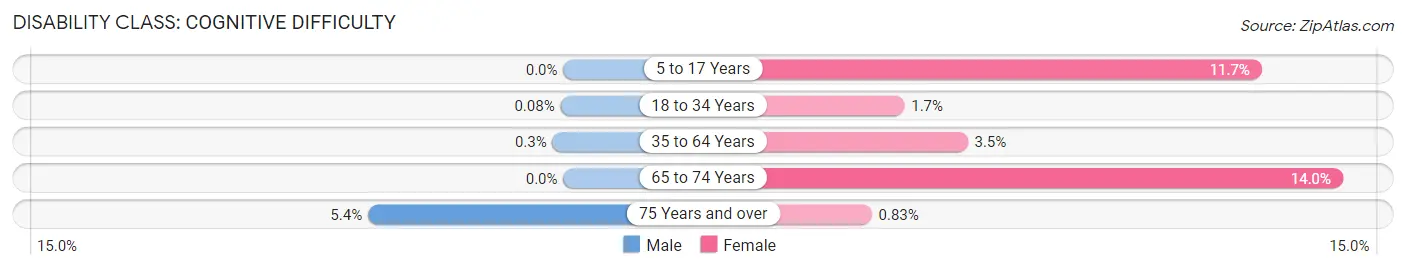
| Age Bracket | Male | Female |
| 5 to 17 Years | 0 (0.0%) | 49 (11.7%) |
| 18 to 34 Years | 1 (0.1%) | 22 (1.7%) |
| 35 to 64 Years | 2 (0.3%) | 33 (3.5%) |
| 65 to 74 Years | 0 (0.0%) | 36 (14.0%) |
| 75 Years and over | 8 (5.4%) | 1 (0.8%) |
Disability Class: Ambulatory Difficulty
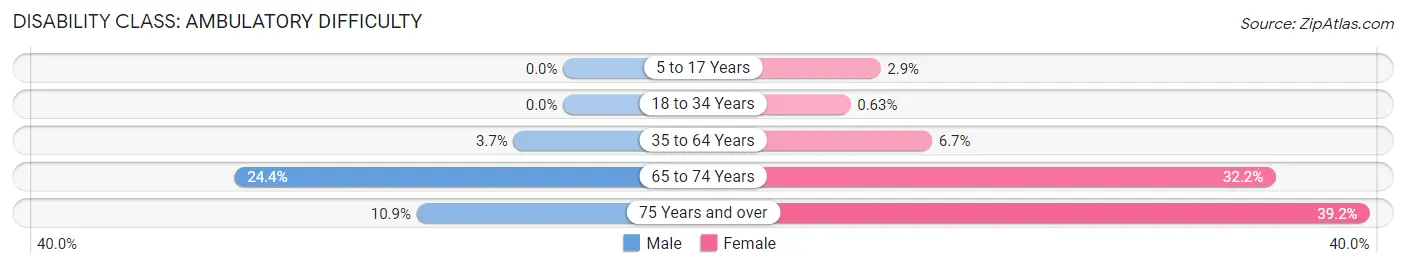
| Age Bracket | Male | Female |
| 5 to 17 Years | 0 (0.0%) | 12 (2.9%) |
| 18 to 34 Years | 0 (0.0%) | 8 (0.6%) |
| 35 to 64 Years | 25 (3.7%) | 63 (6.7%) |
| 65 to 74 Years | 43 (24.4%) | 83 (32.2%) |
| 75 Years and over | 16 (10.9%) | 47 (39.2%) |
Disability Class: Self-Care Difficulty
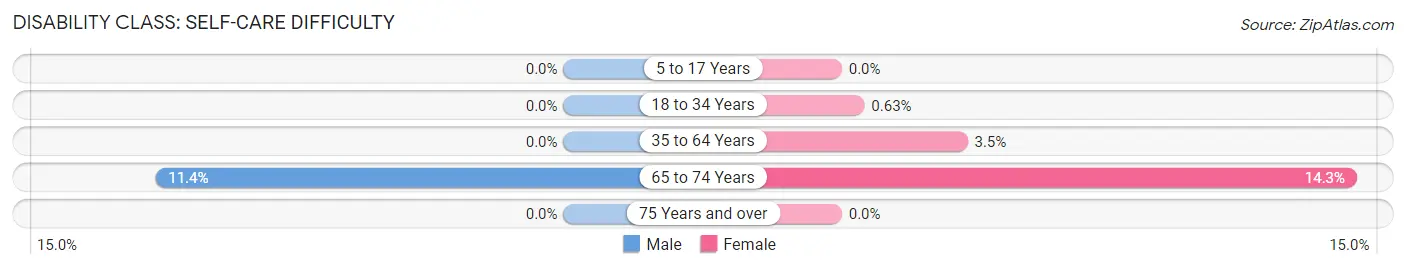
| Age Bracket | Male | Female |
| 5 to 17 Years | 0 (0.0%) | 0 (0.0%) |
| 18 to 34 Years | 0 (0.0%) | 8 (0.6%) |
| 35 to 64 Years | 0 (0.0%) | 33 (3.5%) |
| 65 to 74 Years | 20 (11.4%) | 37 (14.3%) |
| 75 Years and over | 0 (0.0%) | 0 (0.0%) |
Technology Access in Barnesville
Computing Device Access in Barnesville
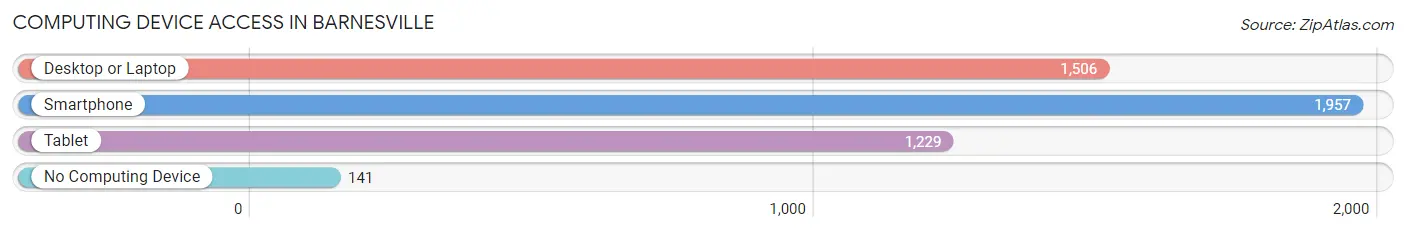
| Device Type | # Households | % Households |
| Desktop or Laptop | 1,506 | 68.7% |
| Smartphone | 1,957 | 89.3% |
| Tablet | 1,229 | 56.1% |
| No Computing Device | 141 | 6.4% |
| Total | 2,192 | 100.0% |
Internet Access in Barnesville
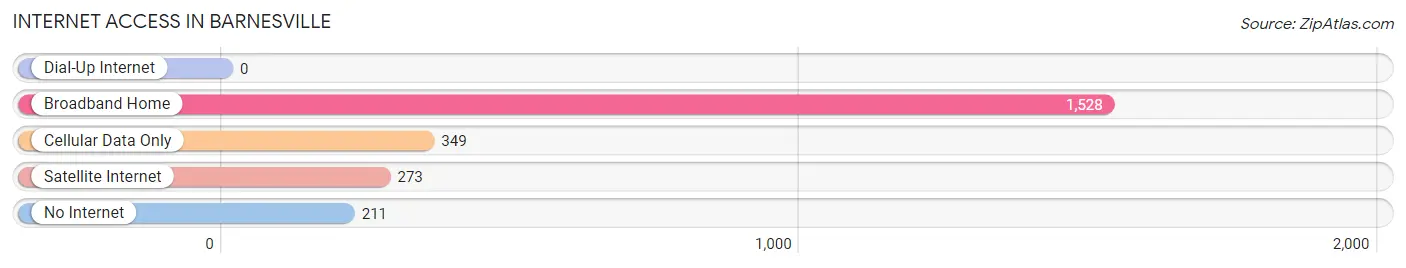
| Internet Type | # Households | % Households |
| Dial-Up Internet | 0 | 0.0% |
| Broadband Home | 1,528 | 69.7% |
| Cellular Data Only | 349 | 15.9% |
| Satellite Internet | 273 | 12.4% |
| No Internet | 211 | 9.6% |
| Total | 2,192 | 100.0% |
Barnesville Summary
Barnesville, Georgia is a small city located in Lamar County, Georgia, United States. It is the county seat of Lamar County and is located approximately 60 miles south of Atlanta. The city has a population of 6,744 as of the 2010 census.
History
Barnesville was founded in 1826 by William Barns, a Revolutionary War veteran. The city was named after him and was incorporated in 1856. The city was a major cotton producer in the 19th century and was known as the “Cotton Capital of Georgia”. The city was also a major railroad hub in the late 19th and early 20th centuries.
Geography
Barnesville is located at 33°5'25"N 84°10'25"W (33.0903, -84.1737). The city is situated in the Piedmont region of Georgia and is located in the foothills of the Appalachian Mountains. The city is located in the center of Lamar County and is bordered by the cities of Milner, Meansville, and Griffin. The city is located approximately 60 miles south of Atlanta and is accessible via Interstate 75 and U.S. Route 41.
Economy
Barnesville’s economy is largely based on agriculture and manufacturing. The city is home to several large poultry processing plants, as well as a number of smaller manufacturing companies. The city is also home to several large retail stores, including Walmart, Lowe’s, and Home Depot.
Demographics
As of the 2010 census, Barnesville had a population of 6,744. The racial makeup of the city was 73.3% White, 22.2% African American, 0.3% Native American, 0.7% Asian, 0.1% Pacific Islander, 1.7% from other races, and 1.9% from two or more races. Hispanic or Latino of any race were 3.3% of the population.
The median income for a household in the city was $31,944, and the median income for a family was $41,944. The per capita income for the city was $17,845. About 17.2% of families and 20.3% of the population were below the poverty line, including 28.2% of those under age 18 and 16.2% of those age 65 or over.
Barnesville is served by the Lamar County School District, which includes two elementary schools, one middle school, and one high school. The city is also home to Gordon State College, a two-year college.
Barnesville is home to several churches, including the First United Methodist Church, the First Baptist Church, and the Church of God. The city is also home to several parks, including the Lamar County Park, the Barnesville City Park, and the Lamar County Recreation Center.
Common Questions
What is Per Capita Income in Barnesville?
Per Capita income in Barnesville is $23,049.
What is the Median Family Income in Barnesville?
Median Family Income in Barnesville is $65,865.
What is the Median Household income in Barnesville?
Median Household Income in Barnesville is $46,116.
What is Income or Wage Gap in Barnesville?
Income or Wage Gap in Barnesville is 19.7%.
Women in Barnesville earn 80.3 cents for every dollar earned by a man.
What is Inequality or Gini Index in Barnesville?
Inequality or Gini Index in Barnesville is 0.45.
What is the Total Population of Barnesville?
Total Population of Barnesville is 6,200.
What is the Total Male Population of Barnesville?
Total Male Population of Barnesville is 3,009.
What is the Total Female Population of Barnesville?
Total Female Population of Barnesville is 3,191.
What is the Ratio of Males per 100 Females in Barnesville?
There are 94.30 Males per 100 Females in Barnesville.
What is the Ratio of Females per 100 Males in Barnesville?
There are 106.05 Females per 100 Males in Barnesville.
What is the Median Population Age in Barnesville?
Median Population Age in Barnesville is 27.7 Years.
What is the Average Family Size in Barnesville
Average Family Size in Barnesville is 3.0 People.
What is the Average Household Size in Barnesville
Average Household Size in Barnesville is 2.3 People.
How Large is the Labor Force in Barnesville?
There are 3,003 People in the Labor Forcein in Barnesville.
What is the Percentage of People in the Labor Force in Barnesville?
56.6% of People are in the Labor Force in Barnesville.
What is the Unemployment Rate in Barnesville?
Unemployment Rate in Barnesville is 2.4%.