Zip Codes with the Highest Percentage of Population Employed in Food Preparation & Serving in Ellijay, GA
RELATED REPORTS & OPTIONS
Food Preparation & Serving
Ellijay
Compare Zip Codes
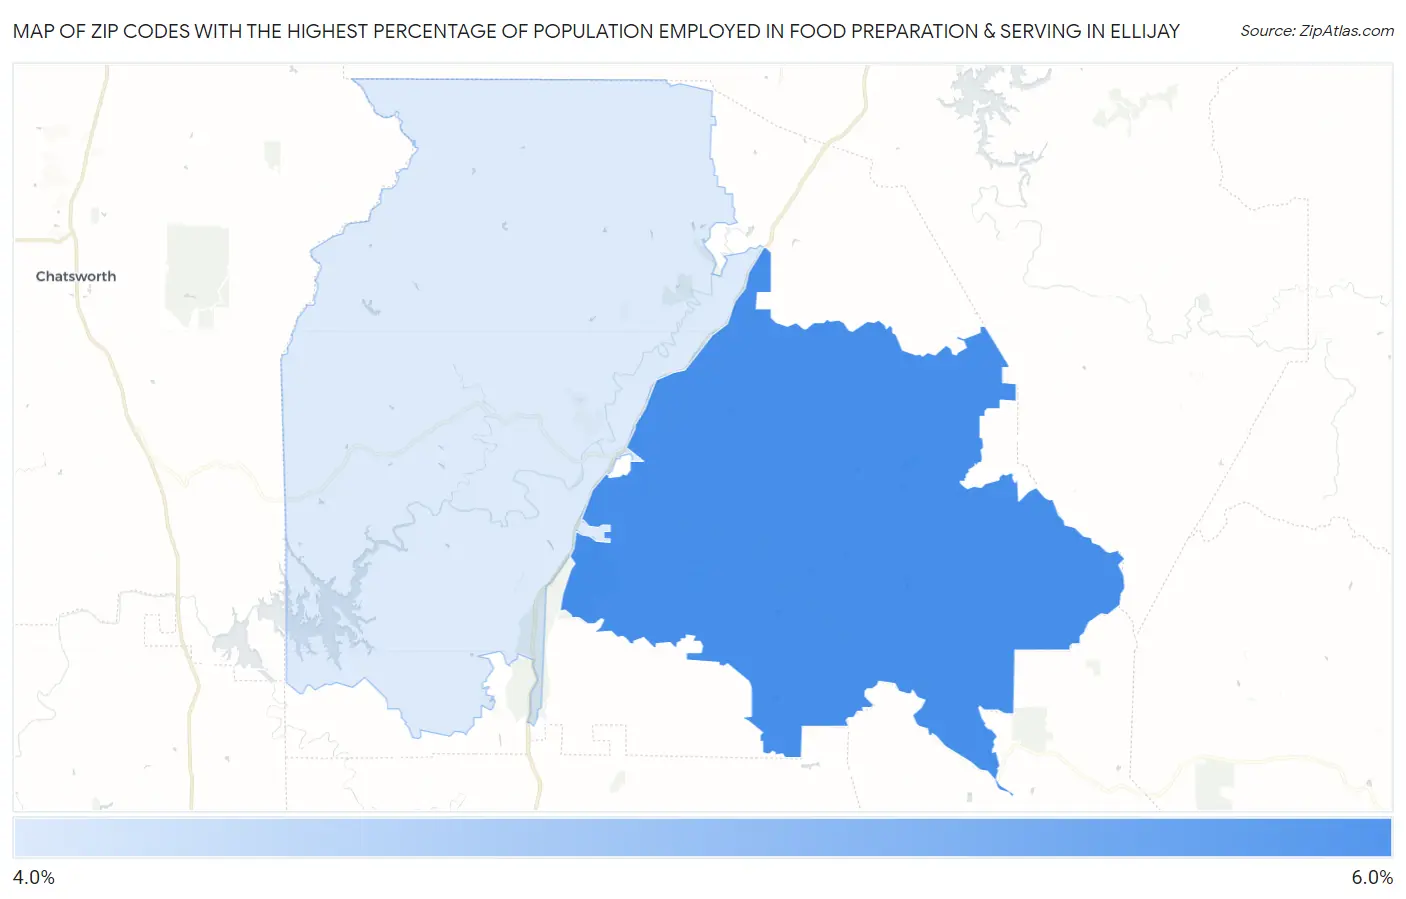
Map of Zip Codes with the Highest Percentage of Population Employed in Food Preparation & Serving in Ellijay
4.5%
5.1%
Zip Codes with the Highest Percentage of Population Employed in Food Preparation & Serving in Ellijay, GA
| Zip Code | % Employed | vs State | vs National | |
| 1. | 30536 | 5.1% | 5.1%(-0.012)#283 | 5.3%(-0.153)#12,419 |
| 2. | 30540 | 4.5% | 5.1%(-0.677)#352 | 5.3%(-0.819)#15,155 |
1
Common Questions
What are the Top Zip Codes with the Highest Percentage of Population Employed in Food Preparation & Serving in Ellijay, GA?
Top Zip Codes with the Highest Percentage of Population Employed in Food Preparation & Serving in Ellijay, GA are:
What zip code has the Highest Percentage of Population Employed in Food Preparation & Serving in Ellijay, GA?
30536 has the Highest Percentage of Population Employed in Food Preparation & Serving in Ellijay, GA with 5.1%.
What is the Percentage of Population Employed in Food Preparation & Serving in Ellijay, GA?
Percentage of Population Employed in Food Preparation & Serving in Ellijay is 8.0%.
What is the Percentage of Population Employed in Food Preparation & Serving in Georgia?
Percentage of Population Employed in Food Preparation & Serving in Georgia is 5.1%.
What is the Percentage of Population Employed in Food Preparation & Serving in the United States?
Percentage of Population Employed in Food Preparation & Serving in the United States is 5.3%.