Milan, GA Map & Demographics
Milan Map
Milan Overview
$18,044
PER CAPITA INCOME
$22,188
AVG HOUSEHOLD INCOME
$10,665
FAMILY INCOME DEFICIT
0.57
INEQUALITY / GINI INDEX
649
TOTAL POPULATION
287
MALE POPULATION
362
FEMALE POPULATION
79.28
MALES / 100 FEMALES
126.13
FEMALES / 100 MALES
51.3
MEDIAN AGE
3.3
AVG FAMILY SIZE
2.2
AVG HOUSEHOLD SIZE
213
LABOR FORCE [ PEOPLE ]
37.8%
PERCENT IN LABOR FORCE
15.5%
UNEMPLOYMENT RATE
Milan Zip Codes
Milan Area Codes
Income in Milan
Income Overview in Milan
| Characteristic | Number | Measure |
| Per Capita Income | 649 | $18,044 |
| Median Family Income | 133 | $0 |
| Mean Family Income | 133 | $44,799 |
| Median Household Income | 281 | $22,188 |
| Mean Household Income | 281 | $34,325 |
| Income Deficit | 133 | $10,665 |
| Wage / Income Gap (%) | 649 | 0.00% |
| Wage / Income Gap ($) | 649 | 100.00¢ per $1 |
| Gini / Inequality Index | 649 | 0.57 |
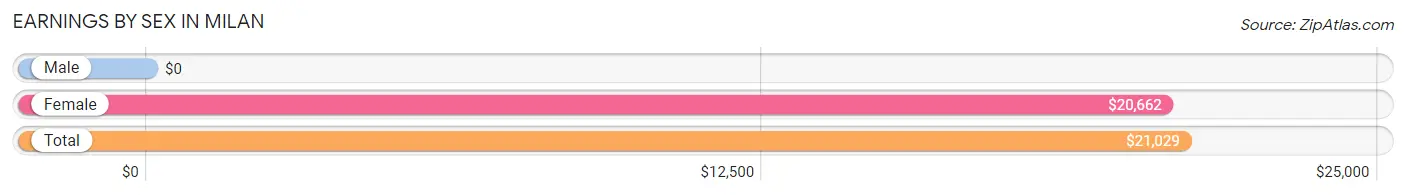
Earnings by Sex in Milan
| Sex | Number | Average Earnings |
| Male | 85 (42.5%) | $0 |
| Female | 115 (57.5%) | $20,662 |
| Total | 200 (100.0%) | $21,029 |
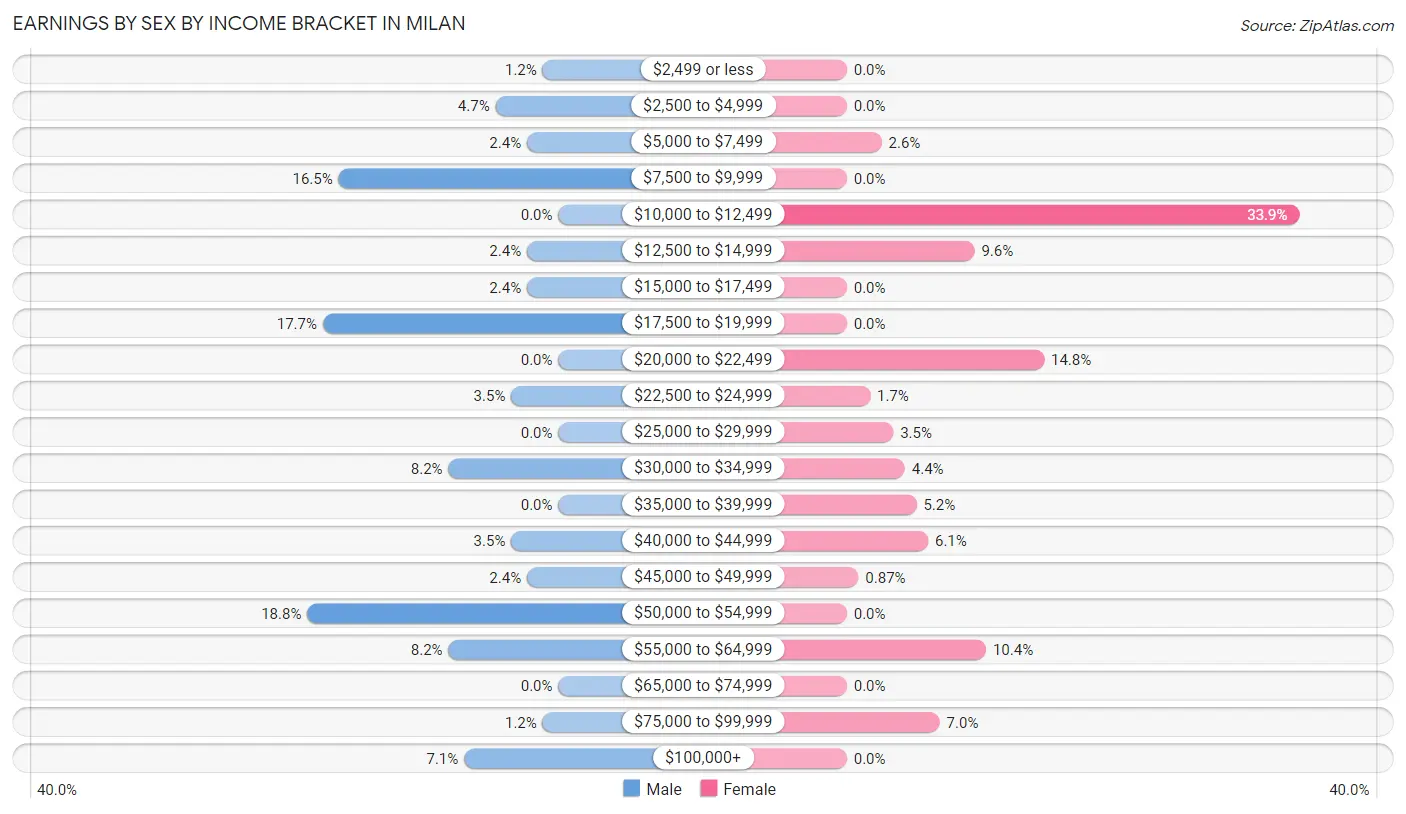
Earnings by Sex by Income Bracket in Milan
The most common earnings brackets in Milan are $50,000 to $54,999 for men (16 | 18.8%) and $10,000 to $12,499 for women (39 | 33.9%).
| Income | Male | Female |
| $2,499 or less | 1 (1.2%) | 0 (0.0%) |
| $2,500 to $4,999 | 4 (4.7%) | 0 (0.0%) |
| $5,000 to $7,499 | 2 (2.4%) | 3 (2.6%) |
| $7,500 to $9,999 | 14 (16.5%) | 0 (0.0%) |
| $10,000 to $12,499 | 0 (0.0%) | 39 (33.9%) |
| $12,500 to $14,999 | 2 (2.4%) | 11 (9.6%) |
| $15,000 to $17,499 | 2 (2.4%) | 0 (0.0%) |
| $17,500 to $19,999 | 15 (17.6%) | 0 (0.0%) |
| $20,000 to $22,499 | 0 (0.0%) | 17 (14.8%) |
| $22,500 to $24,999 | 3 (3.5%) | 2 (1.7%) |
| $25,000 to $29,999 | 0 (0.0%) | 4 (3.5%) |
| $30,000 to $34,999 | 7 (8.2%) | 5 (4.3%) |
| $35,000 to $39,999 | 0 (0.0%) | 6 (5.2%) |
| $40,000 to $44,999 | 3 (3.5%) | 7 (6.1%) |
| $45,000 to $49,999 | 2 (2.4%) | 1 (0.9%) |
| $50,000 to $54,999 | 16 (18.8%) | 0 (0.0%) |
| $55,000 to $64,999 | 7 (8.2%) | 12 (10.4%) |
| $65,000 to $74,999 | 0 (0.0%) | 0 (0.0%) |
| $75,000 to $99,999 | 1 (1.2%) | 8 (7.0%) |
| $100,000+ | 6 (7.1%) | 0 (0.0%) |
| Total | 85 (100.0%) | 115 (100.0%) |
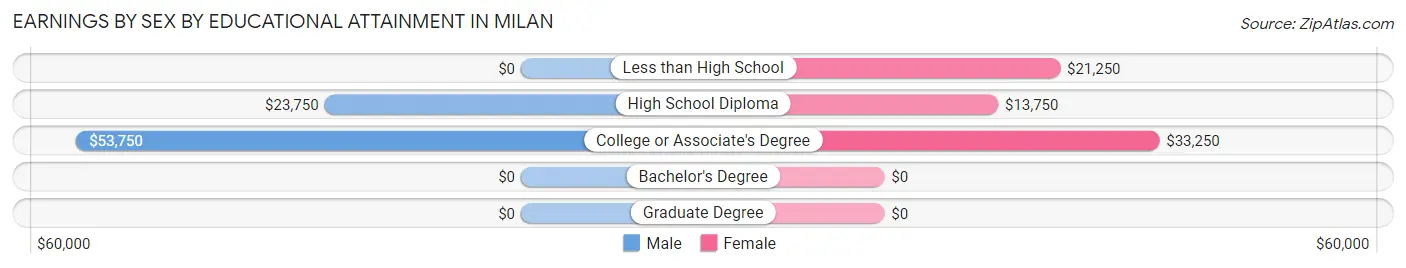
Earnings by Sex by Educational Attainment in Milan
Average earnings in Milan are $52,656 for men and $20,882 for women, a difference of 60.3%. Men with an educational attainment of college or associate's degree enjoy the highest average annual earnings of $53,750, while those with high school diploma education earn the least with $23,750. Women with an educational attainment of college or associate's degree earn the most with the average annual earnings of $33,250, while those with high school diploma education have the smallest earnings of $13,750.
| Educational Attainment | Male Income | Female Income |
| Less than High School | - | - |
| High School Diploma | $23,750 | $13,750 |
| College or Associate's Degree | $53,750 | $33,250 |
| Bachelor's Degree | - | - |
| Graduate Degree | - | - |
| Total | $52,656 | $20,882 |
Family Income in Milan
Family Income Brackets in Milan
According to the Milan family income data, there are 41 families falling into the less than $10,000 income range, which is the most common income bracket and makes up 30.8% of all families.
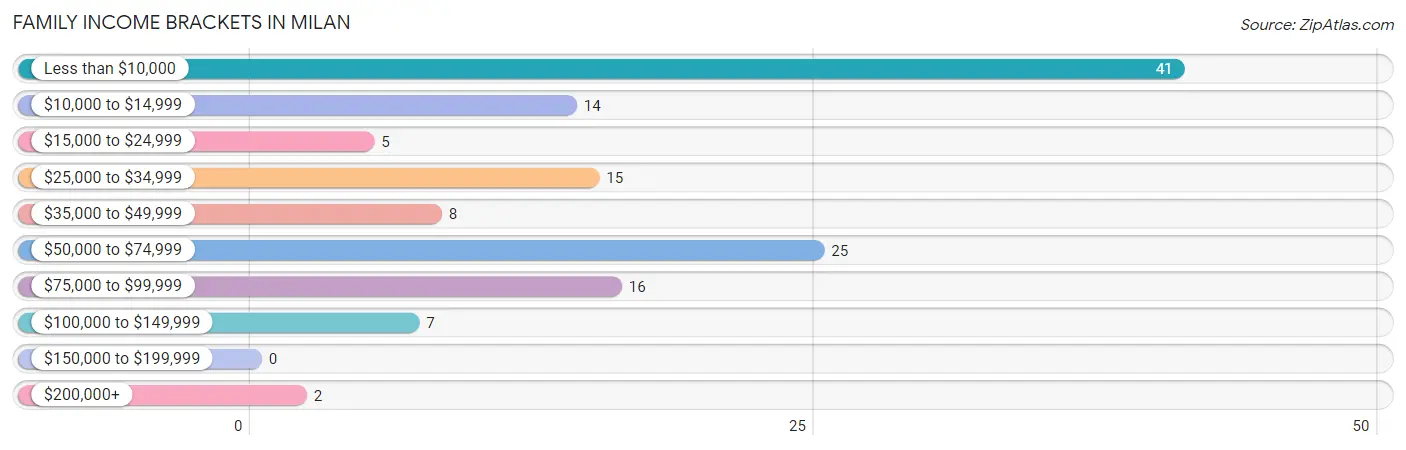
| Income Bracket | # Families | % Families |
| Less than $10,000 | 41 | 30.8% |
| $10,000 to $14,999 | 14 | 10.5% |
| $15,000 to $24,999 | 5 | 3.8% |
| $25,000 to $34,999 | 15 | 11.3% |
| $35,000 to $49,999 | 8 | 6.0% |
| $50,000 to $74,999 | 25 | 18.8% |
| $75,000 to $99,999 | 16 | 12.0% |
| $100,000 to $149,999 | 7 | 5.3% |
| $150,000 to $199,999 | 0 | 0.0% |
| $200,000+ | 2 | 1.5% |
Family Income by Famaliy Size in Milan
4-person families (21 | 15.8%) account for the highest median family income in Milan with $61,042 per family, while 4-person families (21 | 15.8%) have the highest median income of $15,260 per family member.
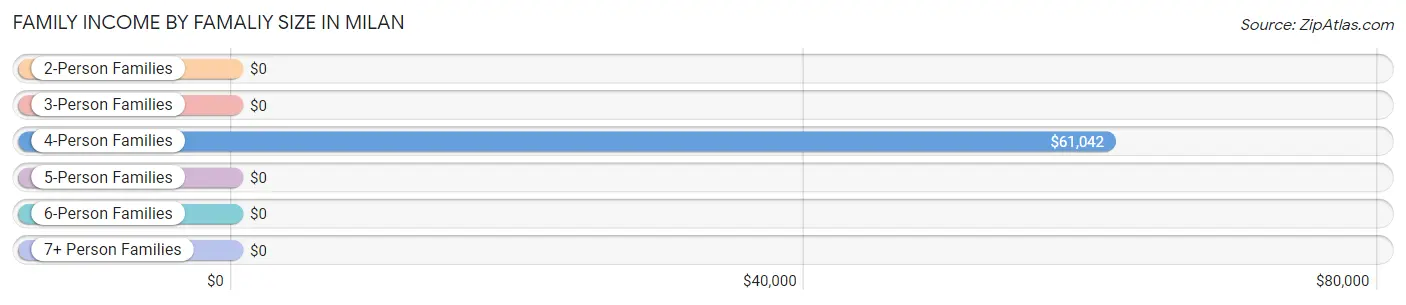
| Income Bracket | # Families | Median Income |
| 2-Person Families | 84 (63.2%) | $0 |
| 3-Person Families | 19 (14.3%) | $0 |
| 4-Person Families | 21 (15.8%) | $61,042 |
| 5-Person Families | 6 (4.5%) | $0 |
| 6-Person Families | 0 (0.0%) | $0 |
| 7+ Person Families | 3 (2.3%) | $0 |
| Total | 133 (100.0%) | $0 |
Family Income by Number of Earners in Milan
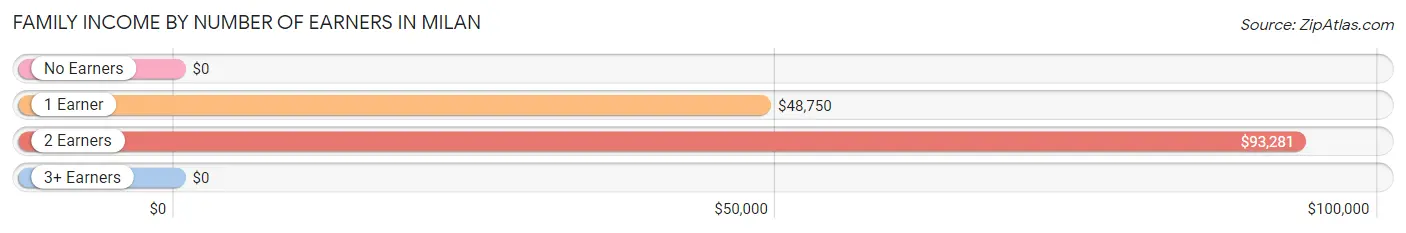
| Number of Earners | # Families | Median Income |
| No Earners | 66 (49.6%) | $0 |
| 1 Earner | 26 (19.6%) | $48,750 |
| 2 Earners | 23 (17.3%) | $93,281 |
| 3+ Earners | 18 (13.5%) | $0 |
| Total | 133 (100.0%) | $0 |
Household Income in Milan
Household Income Brackets in Milan
With 101 households falling in the category, the less than $10,000 income range is the most frequent in Milan, accounting for 35.9% of all households.
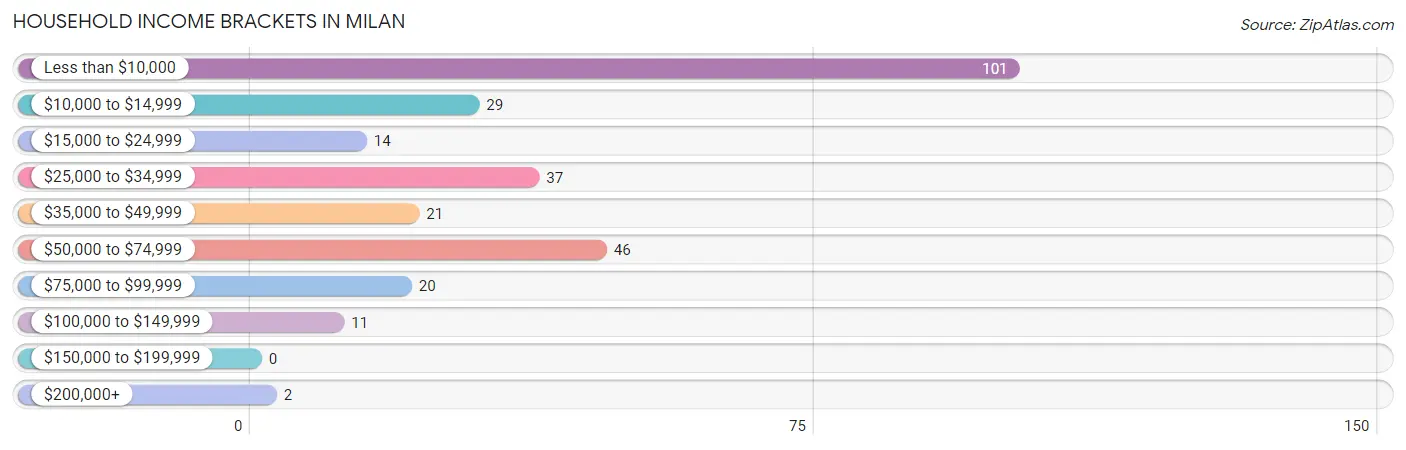
| Income Bracket | # Households | % Households |
| Less than $10,000 | 101 | 35.9% |
| $10,000 to $14,999 | 29 | 10.3% |
| $15,000 to $24,999 | 14 | 5.0% |
| $25,000 to $34,999 | 37 | 13.2% |
| $35,000 to $49,999 | 21 | 7.5% |
| $50,000 to $74,999 | 46 | 16.4% |
| $75,000 to $99,999 | 20 | 7.1% |
| $100,000 to $149,999 | 11 | 3.9% |
| $150,000 to $199,999 | 0 | 0.0% |
| $200,000+ | 2 | 0.7% |
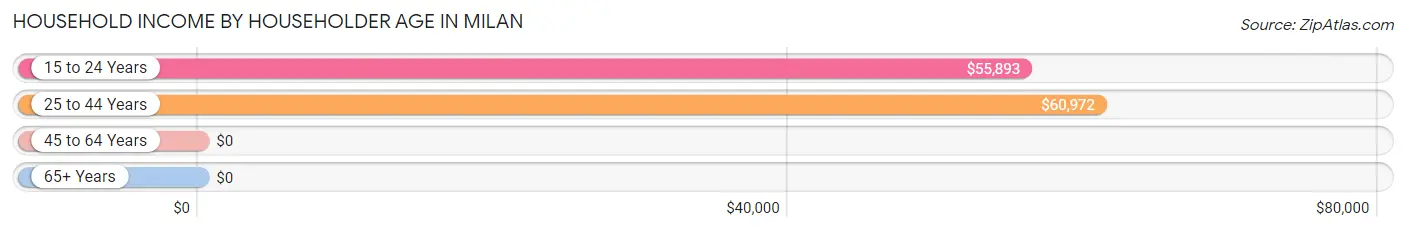
Household Income by Householder Age in Milan
The median household income in Milan is $22,188, with the highest median household income of $60,972 found in the 25 to 44 years age bracket for the primary householder. A total of 46 households (16.4%) fall into this category. Meanwhile, the 45 to 64 years age bracket for the primary householder has the lowest median household income of $0, with 74 households (26.3%) in this group.
| Income Bracket | # Households | Median Income |
| 15 to 24 Years | 9 (3.2%) | $55,893 |
| 25 to 44 Years | 46 (16.4%) | $60,972 |
| 45 to 64 Years | 74 (26.3%) | $0 |
| 65+ Years | 152 (54.1%) | $0 |
| Total | 281 (100.0%) | $22,188 |
Poverty in Milan
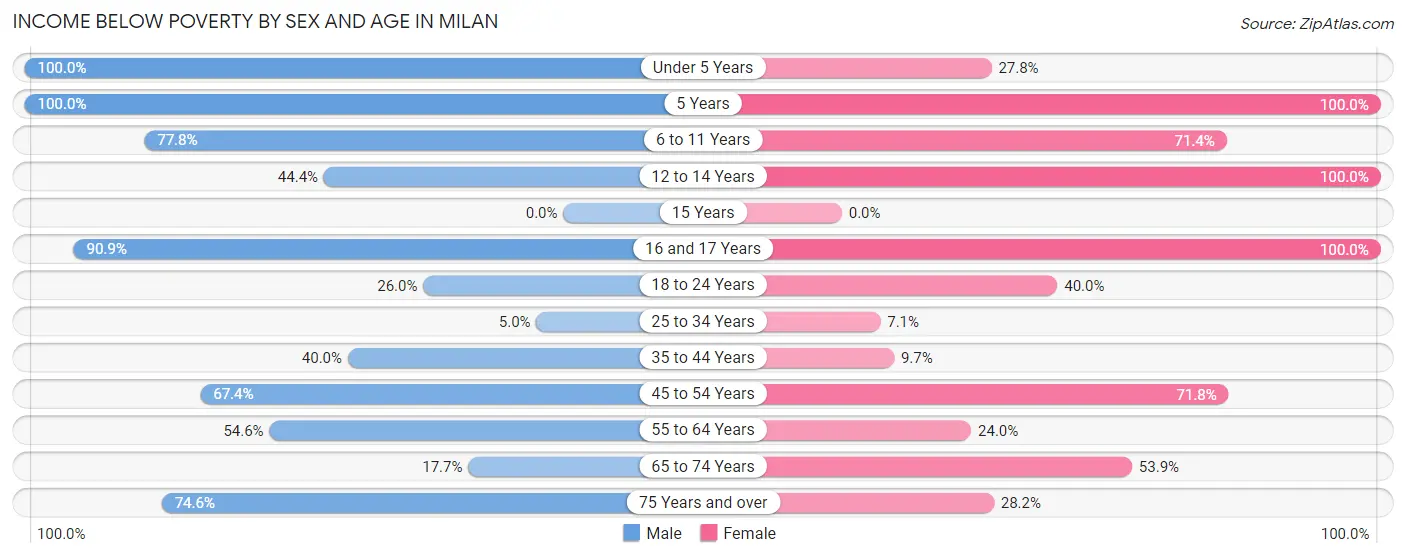
Income Below Poverty by Sex and Age in Milan
With 52.0% poverty level for males and 42.3% for females among the residents of Milan, under 5 year old males and 5 year old females are the most vulnerable to poverty, with 7 males (100.0%) and 4 females (100.0%) in their respective age groups living below the poverty level.
| Age Bracket | Male | Female |
| Under 5 Years | 7 (100.0%) | 10 (27.8%) |
| 5 Years | 1 (100.0%) | 4 (100.0%) |
| 6 to 11 Years | 7 (77.8%) | 10 (71.4%) |
| 12 to 14 Years | 4 (44.4%) | 1 (100.0%) |
| 15 Years | 0 (0.0%) | 0 (0.0%) |
| 16 and 17 Years | 10 (90.9%) | 6 (100.0%) |
| 18 to 24 Years | 13 (26.0%) | 2 (40.0%) |
| 25 to 34 Years | 1 (5.0%) | 2 (7.1%) |
| 35 to 44 Years | 4 (40.0%) | 3 (9.7%) |
| 45 to 54 Years | 31 (67.4%) | 28 (71.8%) |
| 55 to 64 Years | 6 (54.5%) | 6 (24.0%) |
| 65 to 74 Years | 3 (17.6%) | 70 (53.8%) |
| 75 Years and over | 41 (74.6%) | 11 (28.2%) |
| Total | 128 (52.0%) | 153 (42.3%) |
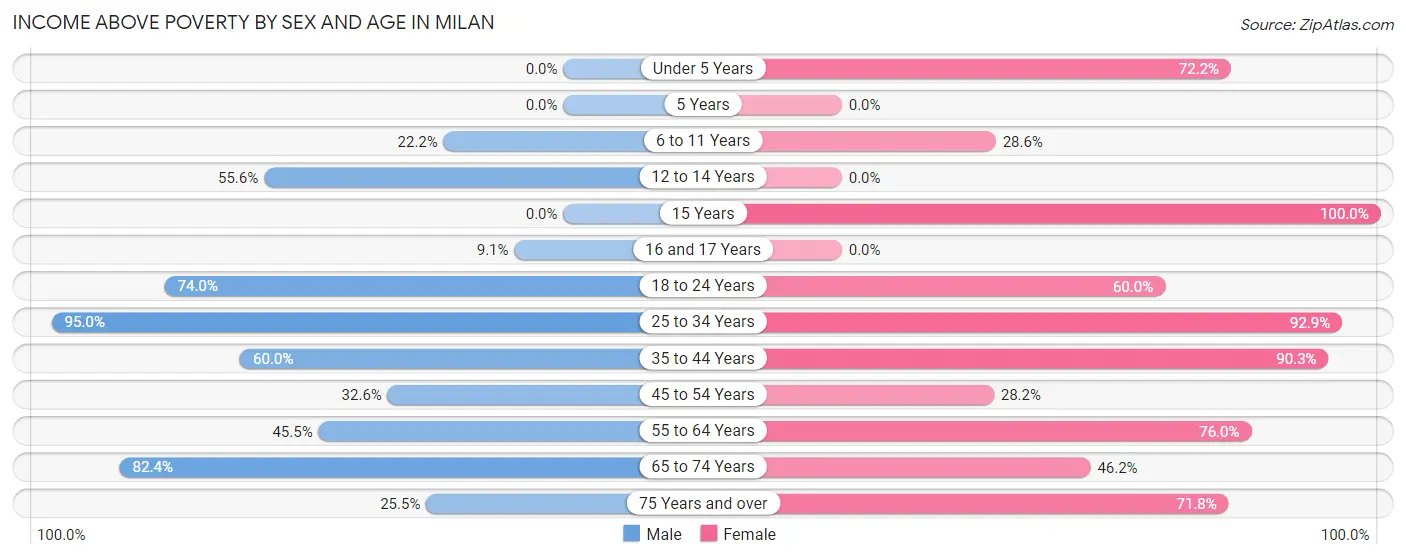
Income Above Poverty by Sex and Age in Milan
According to the poverty statistics in Milan, males aged 25 to 34 years and females aged 15 years are the age groups that are most secure financially, with 95.0% of males and 100.0% of females in these age groups living above the poverty line.
| Age Bracket | Male | Female |
| Under 5 Years | 0 (0.0%) | 26 (72.2%) |
| 5 Years | 0 (0.0%) | 0 (0.0%) |
| 6 to 11 Years | 2 (22.2%) | 4 (28.6%) |
| 12 to 14 Years | 5 (55.6%) | 0 (0.0%) |
| 15 Years | 0 (0.0%) | 4 (100.0%) |
| 16 and 17 Years | 1 (9.1%) | 0 (0.0%) |
| 18 to 24 Years | 37 (74.0%) | 3 (60.0%) |
| 25 to 34 Years | 19 (95.0%) | 26 (92.9%) |
| 35 to 44 Years | 6 (60.0%) | 28 (90.3%) |
| 45 to 54 Years | 15 (32.6%) | 11 (28.2%) |
| 55 to 64 Years | 5 (45.5%) | 19 (76.0%) |
| 65 to 74 Years | 14 (82.4%) | 60 (46.2%) |
| 75 Years and over | 14 (25.5%) | 28 (71.8%) |
| Total | 118 (48.0%) | 209 (57.7%) |
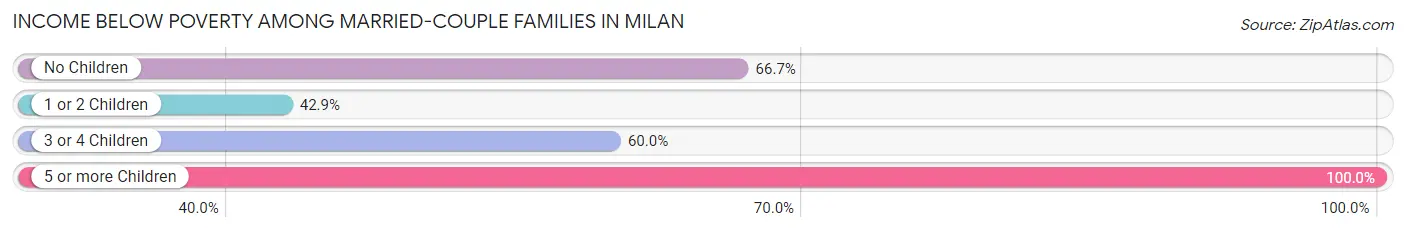
Income Below Poverty Among Married-Couple Families in Milan
The poverty statistics for married-couple families in Milan show that 63.6% or 56 of the total 88 families live below the poverty line. Families with 5 or more children have the highest poverty rate of 100.0%, comprising of 3 families. On the other hand, families with 1 or 2 children have the lowest poverty rate of 42.9%, which includes 6 families.
| Children | Above Poverty | Below Poverty |
| No Children | 22 (33.3%) | 44 (66.7%) |
| 1 or 2 Children | 8 (57.1%) | 6 (42.9%) |
| 3 or 4 Children | 2 (40.0%) | 3 (60.0%) |
| 5 or more Children | 0 (0.0%) | 3 (100.0%) |
| Total | 32 (36.4%) | 56 (63.6%) |
Income Below Poverty Among Single-Parent Households in Milan
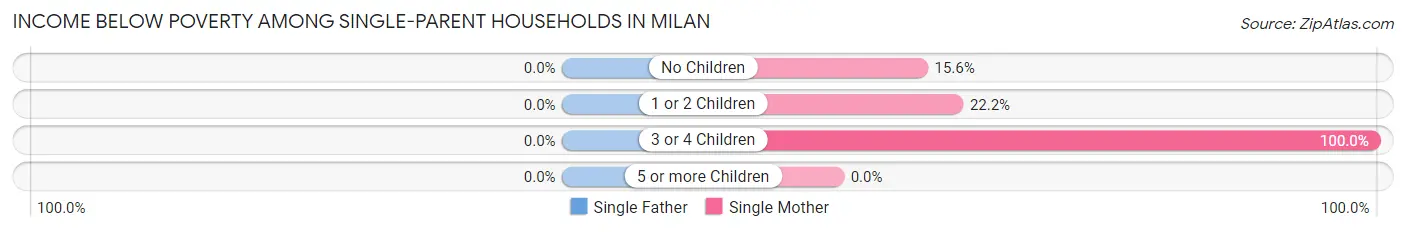
| Children | Single Father | Single Mother |
| No Children | 0 (0.0%) | 5 (15.6%) |
| 1 or 2 Children | 0 (0.0%) | 2 (22.2%) |
| 3 or 4 Children | 0 (0.0%) | 2 (100.0%) |
| 5 or more Children | 0 (0.0%) | 0 (0.0%) |
| Total | 0 (0.0%) | 9 (20.9%) |
Income Below Poverty Among Married-Couple vs Single-Parent Households in Milan
The poverty data for Milan shows that 56 of the married-couple family households (63.6%) and 9 of the single-parent households (20.0%) are living below the poverty level. Within the married-couple family households, those with 5 or more children have the highest poverty rate, with 3 households (100.0%) falling below the poverty line. Among the single-parent households, those with 3 or 4 children have the highest poverty rate, with 2 household (100.0%) living below poverty.
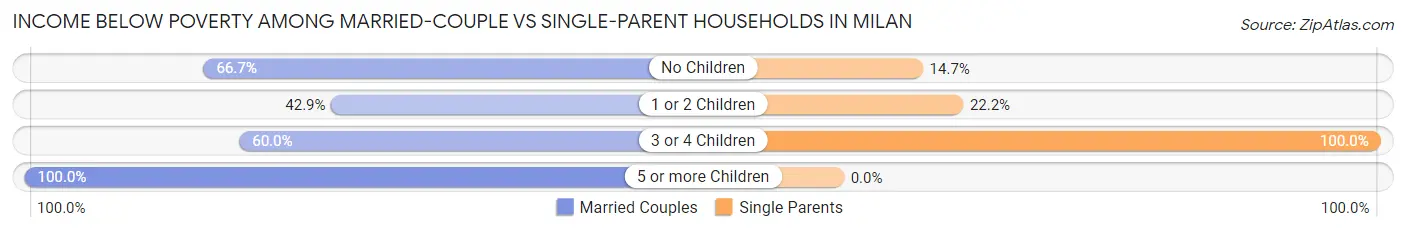
| Children | Married-Couple Families | Single-Parent Households |
| No Children | 44 (66.7%) | 5 (14.7%) |
| 1 or 2 Children | 6 (42.9%) | 2 (22.2%) |
| 3 or 4 Children | 3 (60.0%) | 2 (100.0%) |
| 5 or more Children | 3 (100.0%) | 0 (0.0%) |
| Total | 56 (63.6%) | 9 (20.0%) |
Race in Milan
The most populous races in Milan are White / Caucasian (492 | 75.8%), Black / African American (132 | 20.3%), and Hispanic or Latino (23 | 3.5%).
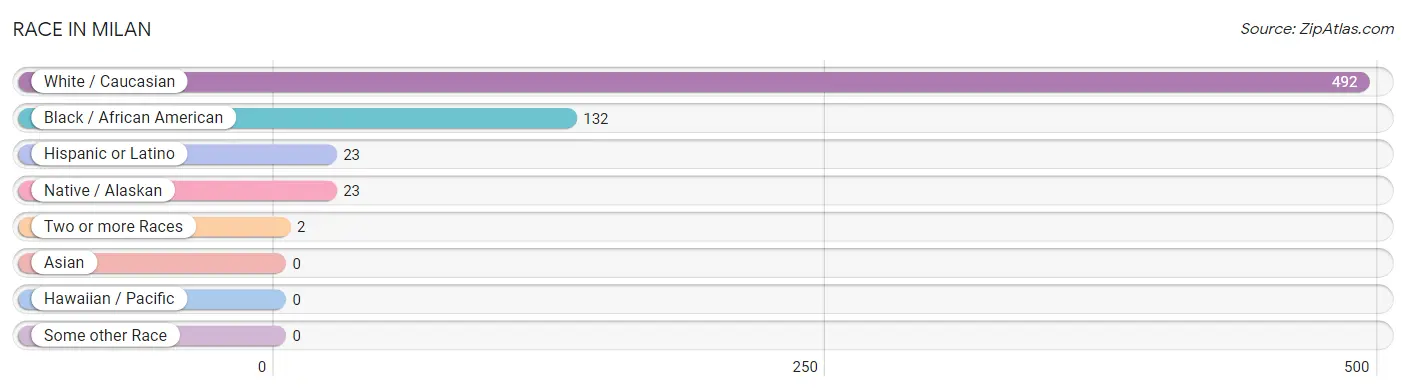
| Race | # Population | % Population |
| Asian | 0 | 0.0% |
| Black / African American | 132 | 20.3% |
| Hawaiian / Pacific | 0 | 0.0% |
| Hispanic or Latino | 23 | 3.5% |
| Native / Alaskan | 23 | 3.5% |
| White / Caucasian | 492 | 75.8% |
| Two or more Races | 2 | 0.3% |
| Some other Race | 0 | 0.0% |
| Total | 649 | 100.0% |
Ancestry in Milan
The most populous ancestries reported in Milan are American (108 | 16.6%), English (50 | 7.7%), Cuban (23 | 3.5%), German (9 | 1.4%), and Irish (7 | 1.1%), together accounting for 30.3% of all Milan residents.
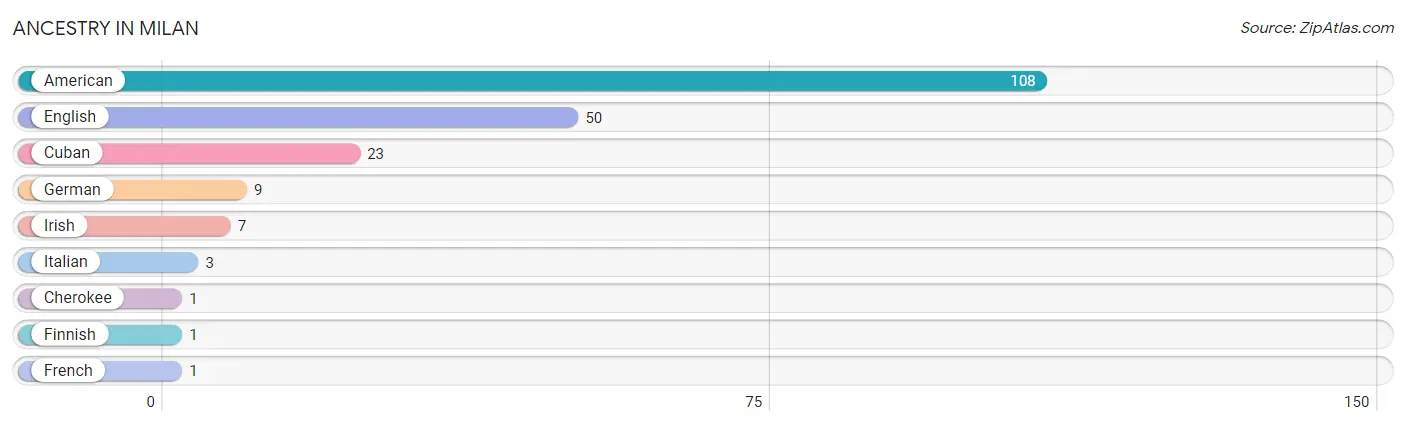
| Ancestry | # Population | % Population |
| American | 108 | 16.6% |
| Cherokee | 1 | 0.2% |
| Cuban | 23 | 3.5% |
| English | 50 | 7.7% |
| Finnish | 1 | 0.2% |
| French | 1 | 0.2% |
| German | 9 | 1.4% |
| Irish | 7 | 1.1% |
| Italian | 3 | 0.5% | View All 9 Rows |
Immigrants in Milan
The most numerous immigrant groups reported in Milan came from , and Canada (1 | 0.2%), together accounting for 0.2% of all Milan residents.

| Immigration Origin | # Population | % Population |
| Canada | 1 | 0.2% | View All 1 Rows |
Sex and Age in Milan
Sex and Age in Milan
The most populous age groups in Milan are 75 to 79 Years (51 | 17.8%) for men and 65 to 69 Years (79 | 21.8%) for women.
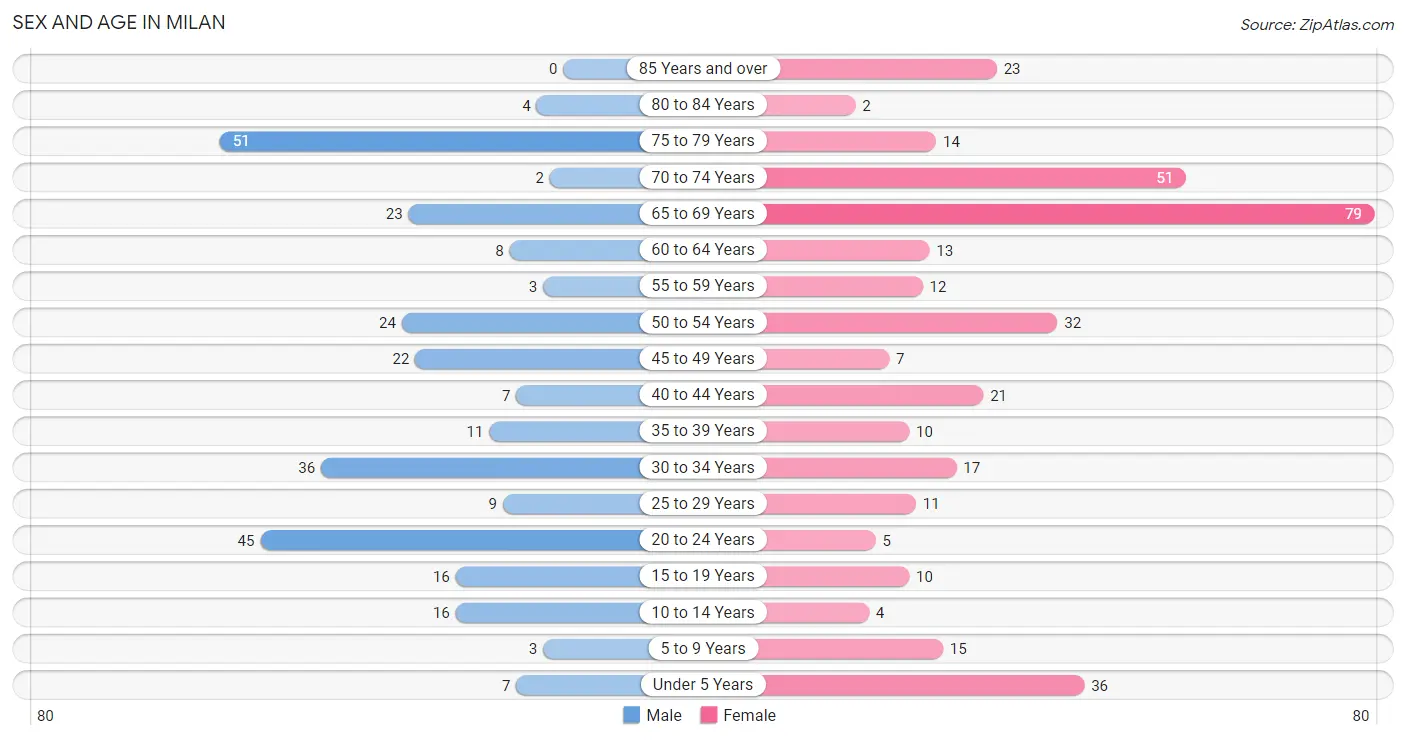
| Age Bracket | Male | Female |
| Under 5 Years | 7 (2.4%) | 36 (9.9%) |
| 5 to 9 Years | 3 (1.1%) | 15 (4.1%) |
| 10 to 14 Years | 16 (5.6%) | 4 (1.1%) |
| 15 to 19 Years | 16 (5.6%) | 10 (2.8%) |
| 20 to 24 Years | 45 (15.7%) | 5 (1.4%) |
| 25 to 29 Years | 9 (3.1%) | 11 (3.0%) |
| 30 to 34 Years | 36 (12.5%) | 17 (4.7%) |
| 35 to 39 Years | 11 (3.8%) | 10 (2.8%) |
| 40 to 44 Years | 7 (2.4%) | 21 (5.8%) |
| 45 to 49 Years | 22 (7.7%) | 7 (1.9%) |
| 50 to 54 Years | 24 (8.4%) | 32 (8.8%) |
| 55 to 59 Years | 3 (1.1%) | 12 (3.3%) |
| 60 to 64 Years | 8 (2.8%) | 13 (3.6%) |
| 65 to 69 Years | 23 (8.0%) | 79 (21.8%) |
| 70 to 74 Years | 2 (0.7%) | 51 (14.1%) |
| 75 to 79 Years | 51 (17.8%) | 14 (3.9%) |
| 80 to 84 Years | 4 (1.4%) | 2 (0.5%) |
| 85 Years and over | 0 (0.0%) | 23 (6.4%) |
| Total | 287 (100.0%) | 362 (100.0%) |
Families and Households in Milan
Median Family Size in Milan
The median family size in Milan is 3.29 persons per family, with single male/father families (2 | 1.5%) accounting for the largest median family size of 9 persons per family. On the other hand, married-couple families (88 | 66.2%) represent the smallest median family size with 3.00 persons per family.
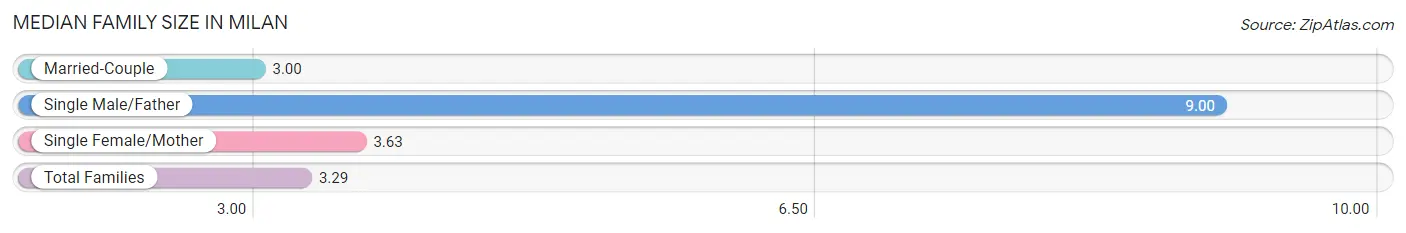
| Family Type | # Families | Family Size |
| Married-Couple | 88 (66.2%) | 3.00 |
| Single Male/Father | 2 (1.5%) | 9.00 |
| Single Female/Mother | 43 (32.3%) | 3.63 |
| Total Families | 133 (100.0%) | 3.29 |
Median Household Size in Milan
The median household size in Milan is 2.16 persons per household, with single male/father households (2 | 0.7%) accounting for the largest median household size of 9 persons per household. non-family households (148 | 52.7%) represent the smallest median household size with 1.09 persons per household.
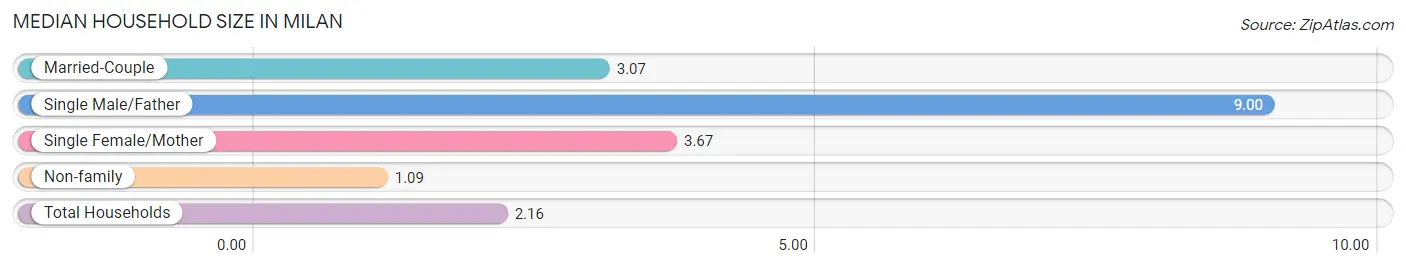
| Household Type | # Households | Household Size |
| Married-Couple | 88 (31.3%) | 3.07 |
| Single Male/Father | 2 (0.7%) | 9.00 |
| Single Female/Mother | 43 (15.3%) | 3.67 |
| Non-family | 148 (52.7%) | 1.09 |
| Total Households | 281 (100.0%) | 2.16 |
Household Size by Marriage Status in Milan
Out of a total of 281 households in Milan, 133 (47.3%) are family households, while 148 (52.7%) are nonfamily households. The most numerous type of family households are 2-person households, comprising 77, and the most common type of nonfamily households are 1-person households, comprising 144.
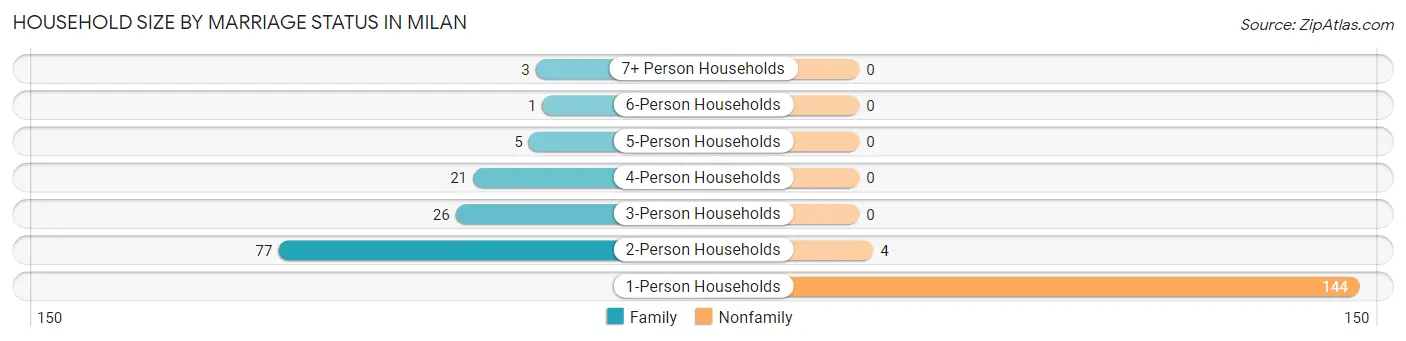
| Household Size | Family Households | Nonfamily Households |
| 1-Person Households | - | 144 (51.2%) |
| 2-Person Households | 77 (27.4%) | 4 (1.4%) |
| 3-Person Households | 26 (9.2%) | 0 (0.0%) |
| 4-Person Households | 21 (7.5%) | 0 (0.0%) |
| 5-Person Households | 5 (1.8%) | 0 (0.0%) |
| 6-Person Households | 1 (0.4%) | 0 (0.0%) |
| 7+ Person Households | 3 (1.1%) | 0 (0.0%) |
| Total | 133 (47.3%) | 148 (52.7%) |
Female Fertility in Milan
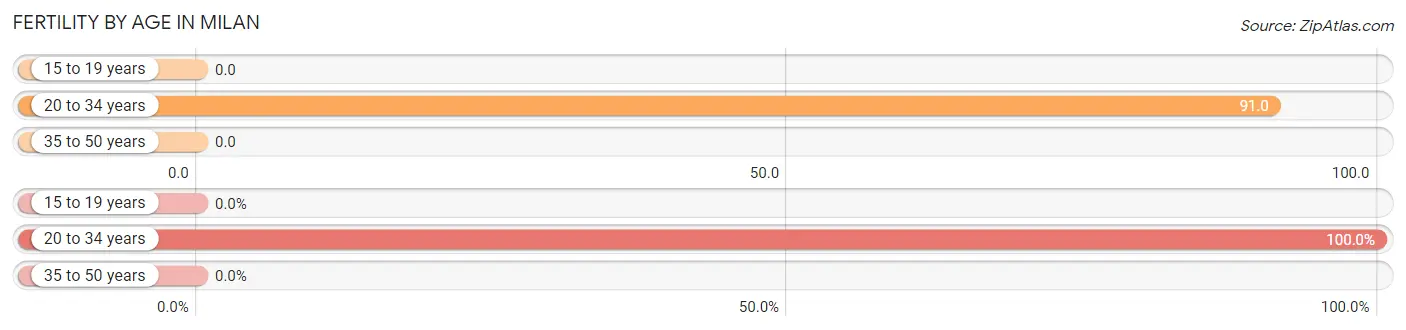
Fertility by Age in Milan
Average fertility rate in Milan is 32.0 births per 1,000 women. Women in the age bracket of 20 to 34 years have the highest fertility rate with 91.0 births per 1,000 women. Women in the age bracket of 20 to 34 years acount for 100.0% of all women with births.
| Age Bracket | Women with Births | Births / 1,000 Women |
| 15 to 19 years | 0 (0.0%) | 0.0 |
| 20 to 34 years | 3 (100.0%) | 91.0 |
| 35 to 50 years | 0 (0.0%) | 0.0 |
| Total | 3 (100.0%) | 32.0 |
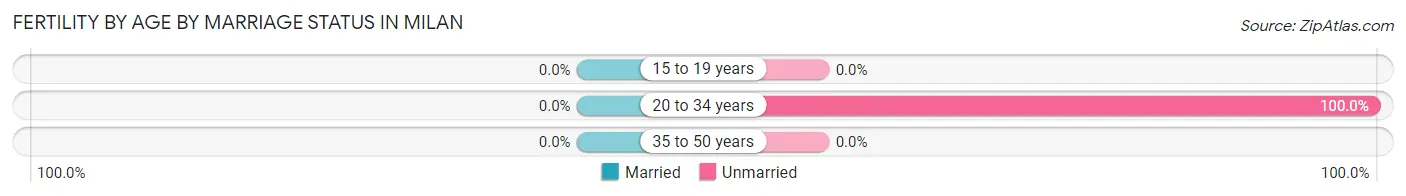
Fertility by Age by Marriage Status in Milan
| Age Bracket | Married | Unmarried |
| 15 to 19 years | 0 (0.0%) | 0 (0.0%) |
| 20 to 34 years | 0 (0.0%) | 3 (100.0%) |
| 35 to 50 years | 0 (0.0%) | 0 (0.0%) |
| Total | 0 (0.0%) | 3 (100.0%) |
Fertility by Education in Milan
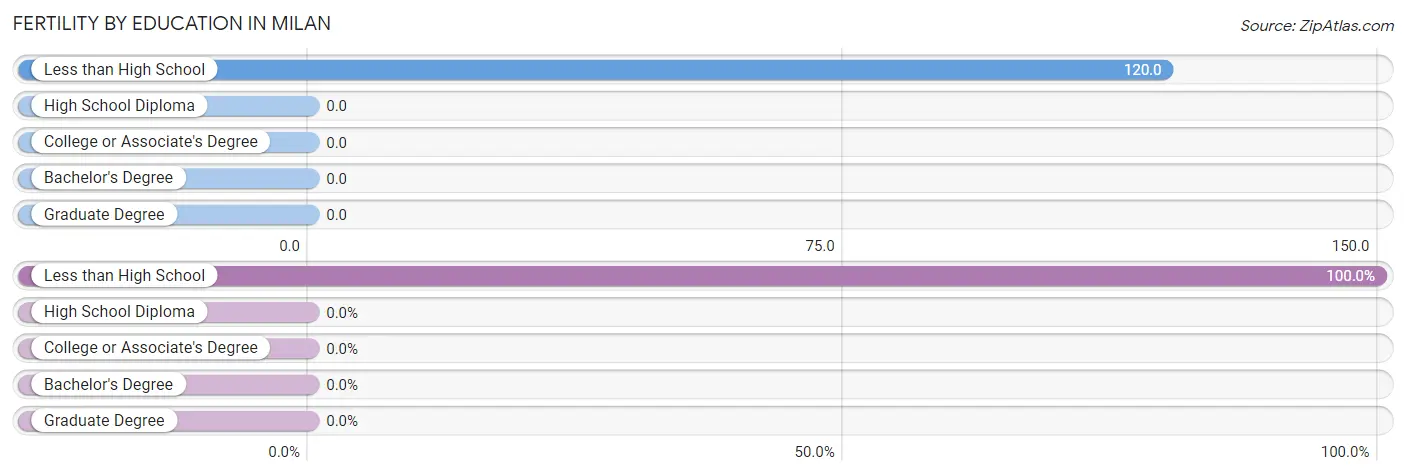
| Educational Attainment | Women with Births | Births / 1,000 Women |
| Less than High School | 3 (100.0%) | 120.0 |
| High School Diploma | 0 (0.0%) | 0.0 |
| College or Associate's Degree | 0 (0.0%) | 0.0 |
| Bachelor's Degree | 0 (0.0%) | 0.0 |
| Graduate Degree | 0 (0.0%) | 0.0 |
| Total | 3 (100.0%) | 32.0 |
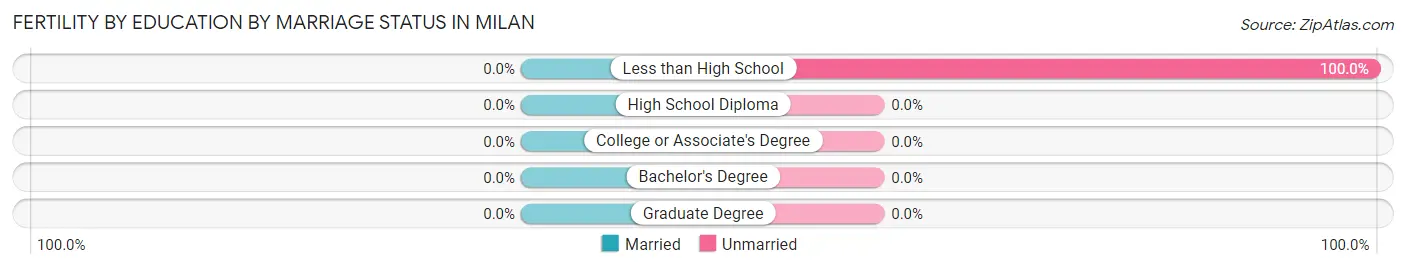
Fertility by Education by Marriage Status in Milan
| Educational Attainment | Married | Unmarried |
| Less than High School | 0 (0.0%) | 3 (100.0%) |
| High School Diploma | 0 (0.0%) | 0 (0.0%) |
| College or Associate's Degree | 0 (0.0%) | 0 (0.0%) |
| Bachelor's Degree | 0 (0.0%) | 0 (0.0%) |
| Graduate Degree | 0 (0.0%) | 0 (0.0%) |
| Total | 0 (0.0%) | 3 (100.0%) |
Employment Characteristics in Milan
Employment by Class of Employer in Milan
Among the 180 employed individuals in Milan, private company employees (127 | 70.6%), federal government employees (19 | 10.6%), and not-for-profit organizations (14 | 7.8%) make up the most common classes of employment.
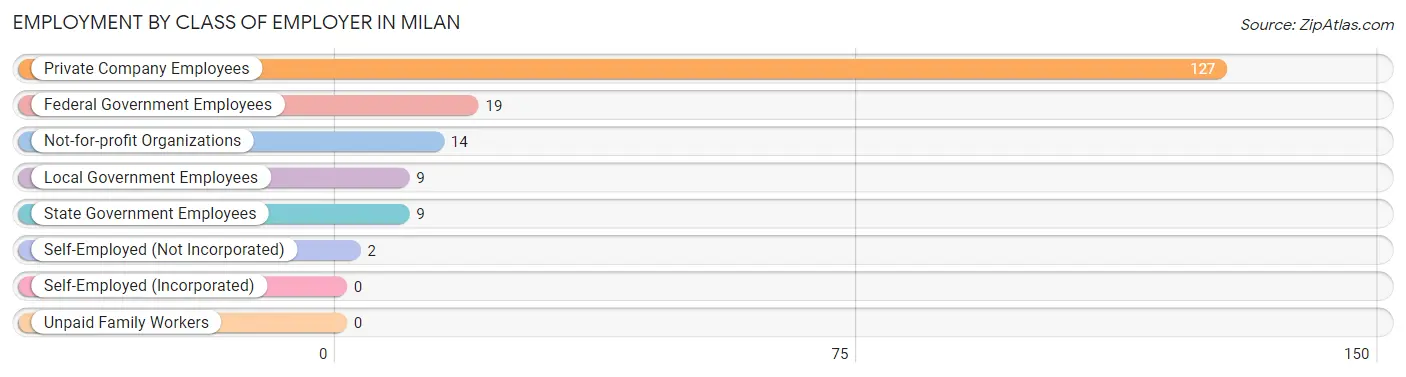
| Employer Class | # Employees | % Employees |
| Private Company Employees | 127 | 70.6% |
| Self-Employed (Incorporated) | 0 | 0.0% |
| Self-Employed (Not Incorporated) | 2 | 1.1% |
| Not-for-profit Organizations | 14 | 7.8% |
| Local Government Employees | 9 | 5.0% |
| State Government Employees | 9 | 5.0% |
| Federal Government Employees | 19 | 10.6% |
| Unpaid Family Workers | 0 | 0.0% |
| Total | 180 | 100.0% |
Employment Status by Age in Milan
According to the labor force statistics for Milan, out of the total population over 16 years of age (564), 37.8% or 213 individuals are in the labor force, with 15.5% or 33 of them unemployed. The age group with the highest labor force participation rate is 20 to 24 years, with 98.0% or 49 individuals in the labor force. Within the labor force, the 20 to 24 years age range has the highest percentage of unemployed individuals, with 51.0% or 25 of them being unemployed.
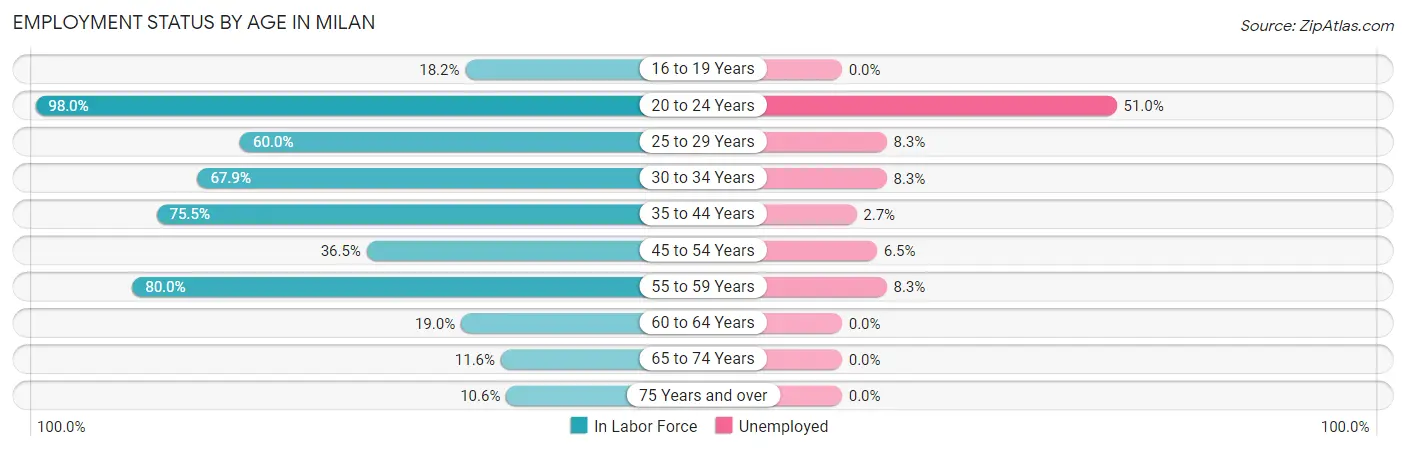
| Age Bracket | In Labor Force | Unemployed |
| 16 to 19 Years | 4 (18.2%) | 0 (0.0%) |
| 20 to 24 Years | 49 (98.0%) | 25 (51.0%) |
| 25 to 29 Years | 12 (60.0%) | 1 (8.3%) |
| 30 to 34 Years | 36 (67.9%) | 3 (8.3%) |
| 35 to 44 Years | 37 (75.5%) | 1 (2.7%) |
| 45 to 54 Years | 31 (36.5%) | 2 (6.5%) |
| 55 to 59 Years | 12 (80.0%) | 1 (8.3%) |
| 60 to 64 Years | 4 (19.0%) | 0 (0.0%) |
| 65 to 74 Years | 18 (11.6%) | 0 (0.0%) |
| 75 Years and over | 10 (10.6%) | 0 (0.0%) |
| Total | 213 (37.8%) | 33 (15.5%) |
Employment Status by Educational Attainment in Milan
According to labor force statistics for Milan, 54.3% of individuals (132) out of the total population between 25 and 64 years of age (243) are in the labor force, with 6.1% or 8 of them being unemployed. The group with the highest labor force participation rate are those with the educational attainment of bachelor's degree or higher, with 100.0% or 13 individuals in the labor force. Within the labor force, individuals with less than high school education have the highest percentage of unemployment, with 9.5% or 2 of them being unemployed.
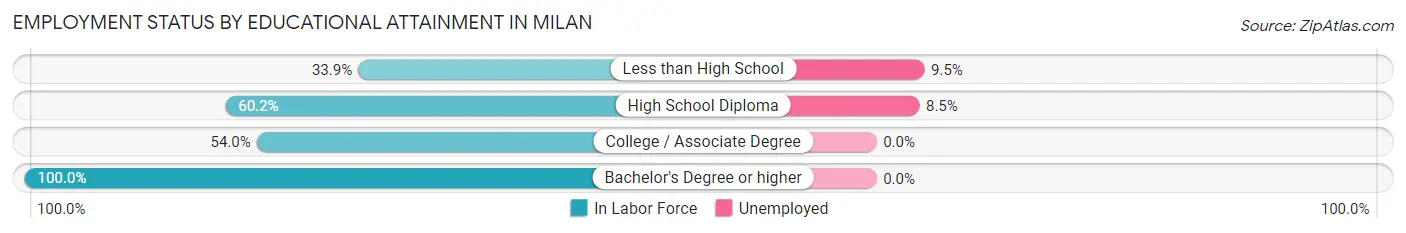
| Educational Attainment | In Labor Force | Unemployed |
| Less than High School | 21 (33.9%) | 6 (9.5%) |
| High School Diploma | 71 (60.2%) | 10 (8.5%) |
| College / Associate Degree | 27 (54.0%) | 0 (0.0%) |
| Bachelor's Degree or higher | 13 (100.0%) | 0 (0.0%) |
| Total | 132 (54.3%) | 15 (6.1%) |
Employment Occupations by Sex in Milan
Management, Business, Science and Arts Occupations
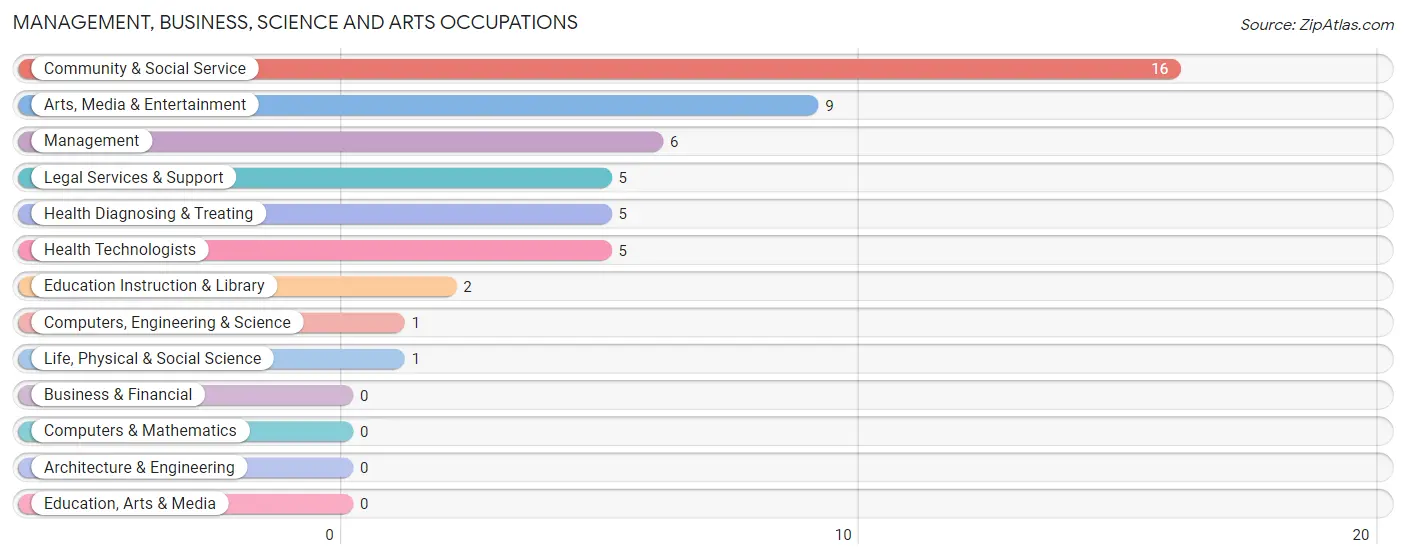
The most common Management, Business, Science and Arts occupations in Milan are Community & Social Service (16 | 8.9%), Arts, Media & Entertainment (9 | 5.0%), Management (6 | 3.3%), Legal Services & Support (5 | 2.8%), and Health Diagnosing & Treating (5 | 2.8%).
Management, Business, Science and Arts Occupations by Sex
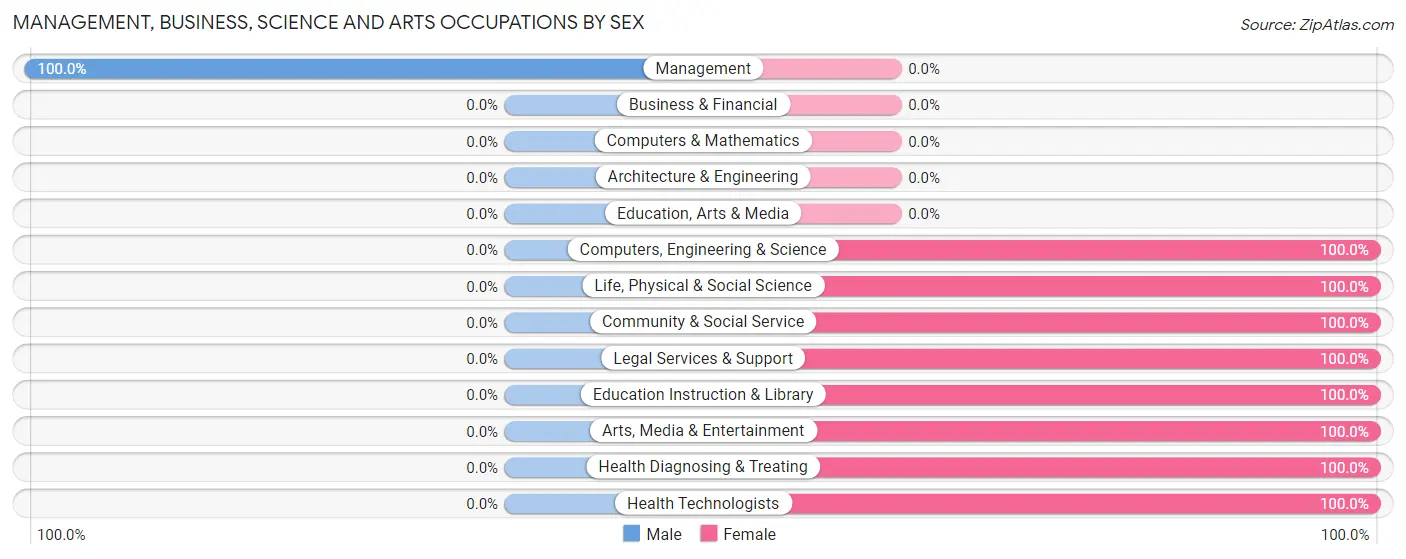
| Occupation | Male | Female |
| Management | 6 (100.0%) | 0 (0.0%) |
| Business & Financial | 0 (0.0%) | 0 (0.0%) |
| Computers, Engineering & Science | 0 (0.0%) | 1 (100.0%) |
| Computers & Mathematics | 0 (0.0%) | 0 (0.0%) |
| Architecture & Engineering | 0 (0.0%) | 0 (0.0%) |
| Life, Physical & Social Science | 0 (0.0%) | 1 (100.0%) |
| Community & Social Service | 0 (0.0%) | 16 (100.0%) |
| Education, Arts & Media | 0 (0.0%) | 0 (0.0%) |
| Legal Services & Support | 0 (0.0%) | 5 (100.0%) |
| Education Instruction & Library | 0 (0.0%) | 2 (100.0%) |
| Arts, Media & Entertainment | 0 (0.0%) | 9 (100.0%) |
| Health Diagnosing & Treating | 0 (0.0%) | 5 (100.0%) |
| Health Technologists | 0 (0.0%) | 5 (100.0%) |
| Total (Category) | 6 (21.4%) | 22 (78.6%) |
| Total (Overall) | 69 (38.3%) | 111 (61.7%) |
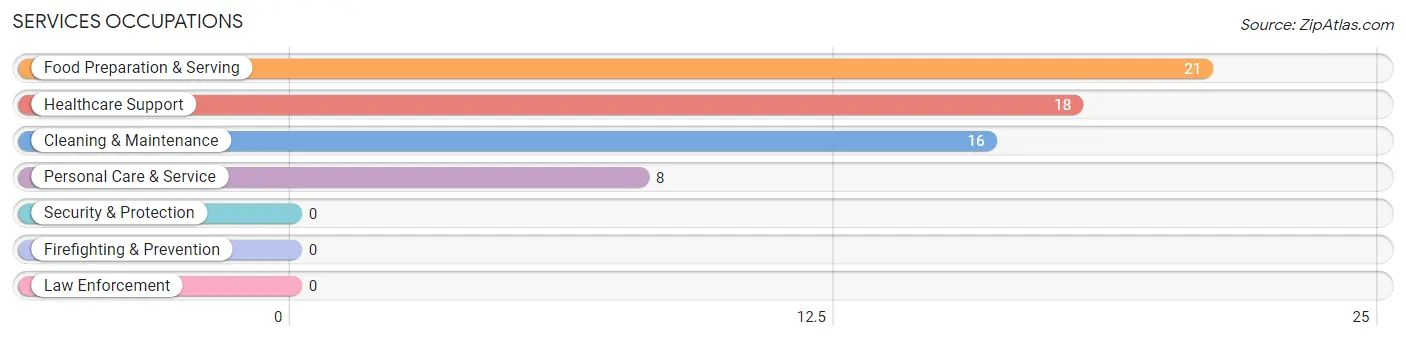
Services Occupations
The most common Services occupations in Milan are Food Preparation & Serving (21 | 11.7%), Healthcare Support (18 | 10.0%), Cleaning & Maintenance (16 | 8.9%), and Personal Care & Service (8 | 4.4%).
Services Occupations by Sex
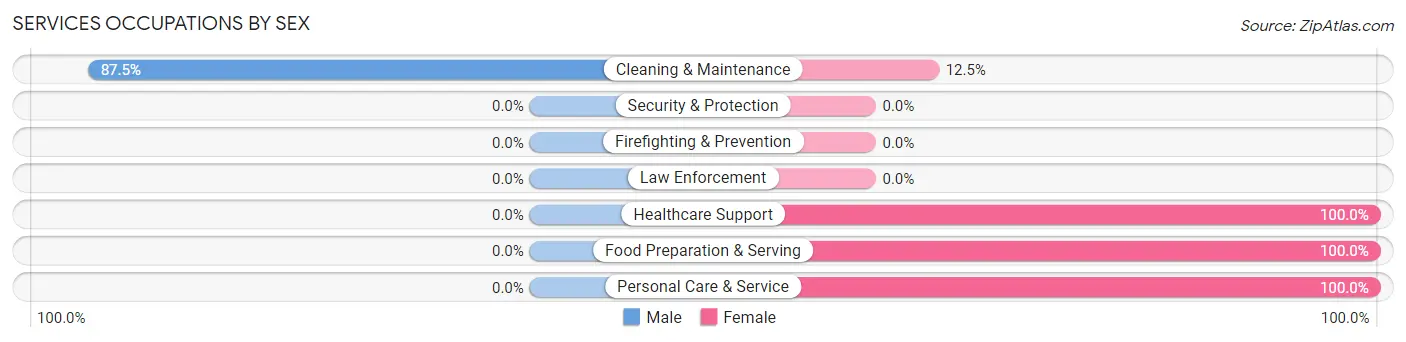
| Occupation | Male | Female |
| Healthcare Support | 0 (0.0%) | 18 (100.0%) |
| Security & Protection | 0 (0.0%) | 0 (0.0%) |
| Firefighting & Prevention | 0 (0.0%) | 0 (0.0%) |
| Law Enforcement | 0 (0.0%) | 0 (0.0%) |
| Food Preparation & Serving | 0 (0.0%) | 21 (100.0%) |
| Cleaning & Maintenance | 14 (87.5%) | 2 (12.5%) |
| Personal Care & Service | 0 (0.0%) | 8 (100.0%) |
| Total (Category) | 14 (22.2%) | 49 (77.8%) |
| Total (Overall) | 69 (38.3%) | 111 (61.7%) |
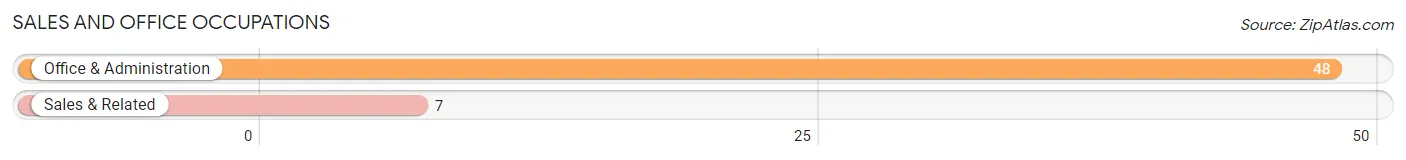
Sales and Office Occupations
The most common Sales and Office occupations in Milan are Office & Administration (48 | 26.7%), and Sales & Related (7 | 3.9%).
Sales and Office Occupations by Sex

| Occupation | Male | Female |
| Sales & Related | 1 (14.3%) | 6 (85.7%) |
| Office & Administration | 16 (33.3%) | 32 (66.7%) |
| Total (Category) | 17 (30.9%) | 38 (69.1%) |
| Total (Overall) | 69 (38.3%) | 111 (61.7%) |
Natural Resources, Construction and Maintenance Occupations
The most common Natural Resources, Construction and Maintenance occupations in Milan are Construction & Extraction (8 | 4.4%), and Installation, Maintenance & Repair (7 | 3.9%).
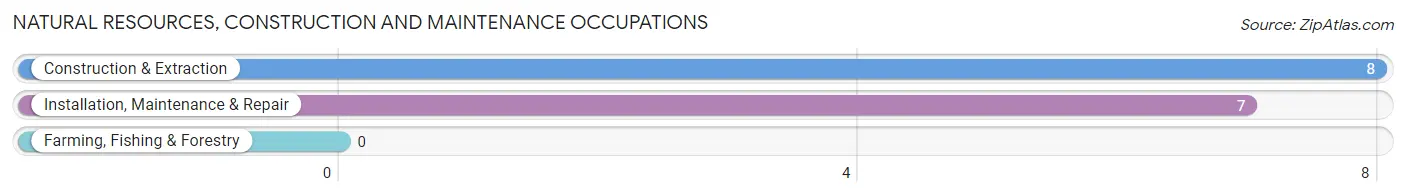
Natural Resources, Construction and Maintenance Occupations by Sex
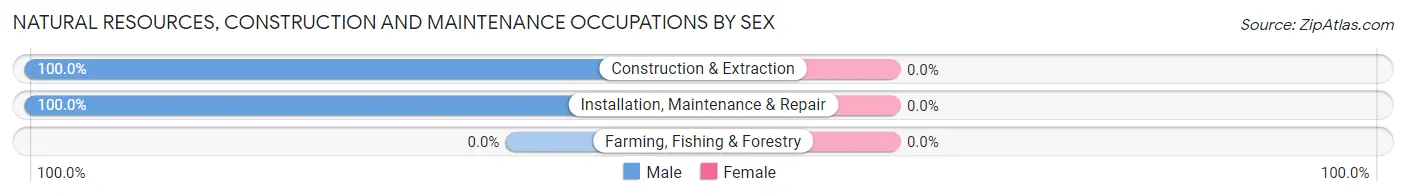
| Occupation | Male | Female |
| Farming, Fishing & Forestry | 0 (0.0%) | 0 (0.0%) |
| Construction & Extraction | 8 (100.0%) | 0 (0.0%) |
| Installation, Maintenance & Repair | 7 (100.0%) | 0 (0.0%) |
| Total (Category) | 15 (100.0%) | 0 (0.0%) |
| Total (Overall) | 69 (38.3%) | 111 (61.7%) |
Production, Transportation and Moving Occupations
The most common Production, Transportation and Moving occupations in Milan are Production (11 | 6.1%), Transportation (4 | 2.2%), and Material Moving (4 | 2.2%).
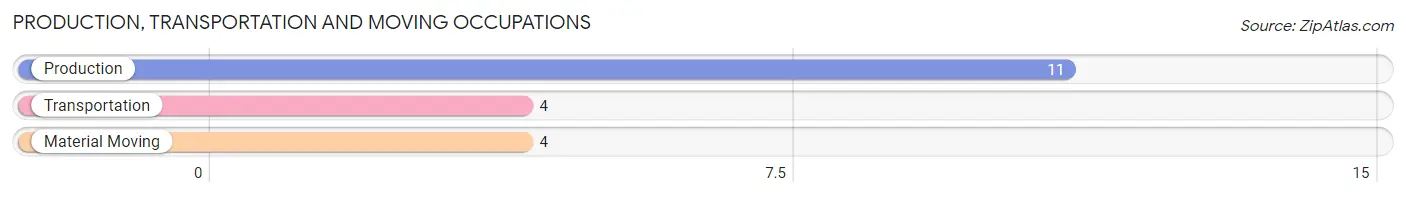
Production, Transportation and Moving Occupations by Sex
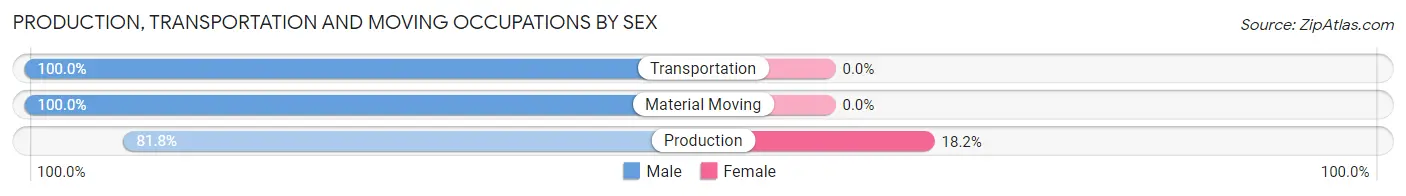
| Occupation | Male | Female |
| Production | 9 (81.8%) | 2 (18.2%) |
| Transportation | 4 (100.0%) | 0 (0.0%) |
| Material Moving | 4 (100.0%) | 0 (0.0%) |
| Total (Category) | 17 (89.5%) | 2 (10.5%) |
| Total (Overall) | 69 (38.3%) | 111 (61.7%) |
Employment Industries by Sex in Milan
Employment Industries in Milan
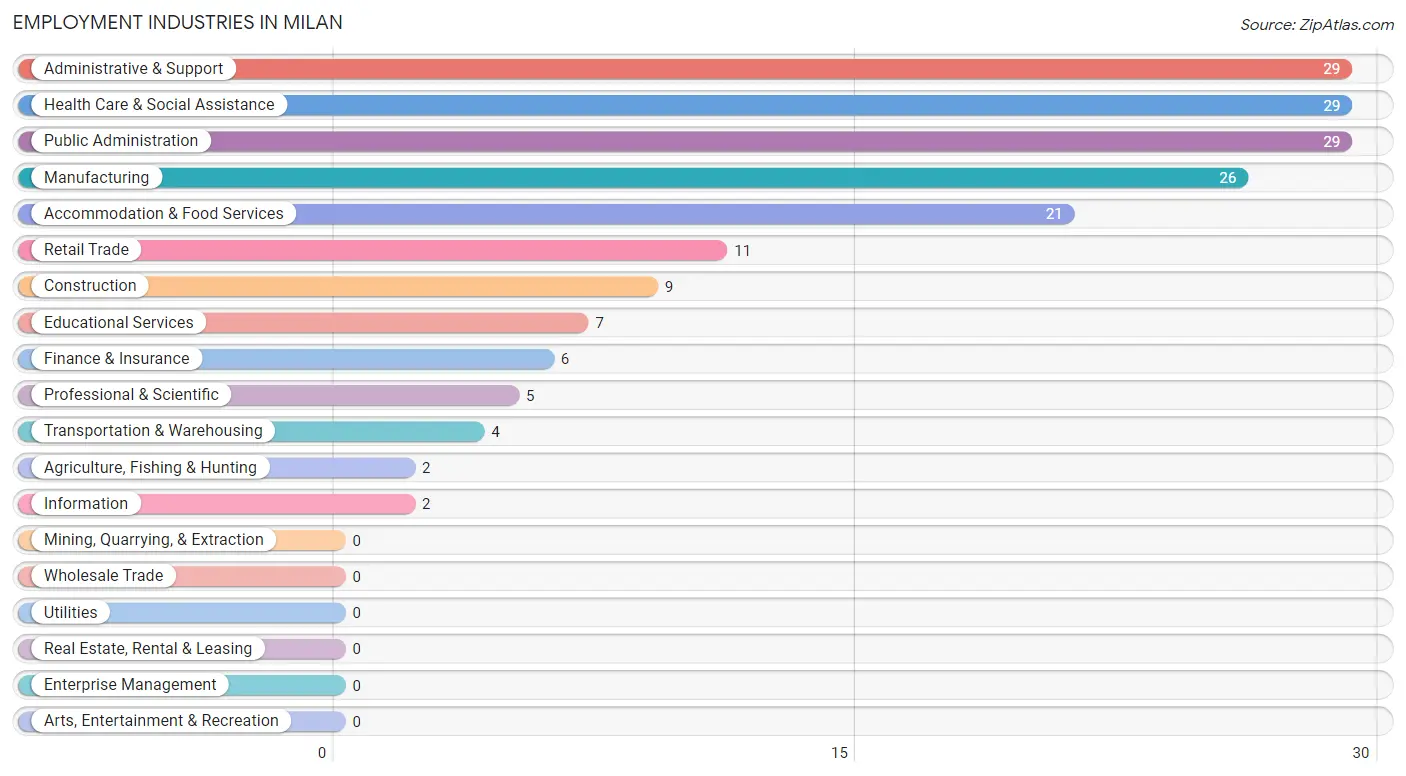
The major employment industries in Milan include Administrative & Support (29 | 16.1%), Health Care & Social Assistance (29 | 16.1%), Public Administration (29 | 16.1%), Manufacturing (26 | 14.4%), and Accommodation & Food Services (21 | 11.7%).
Employment Industries by Sex in Milan
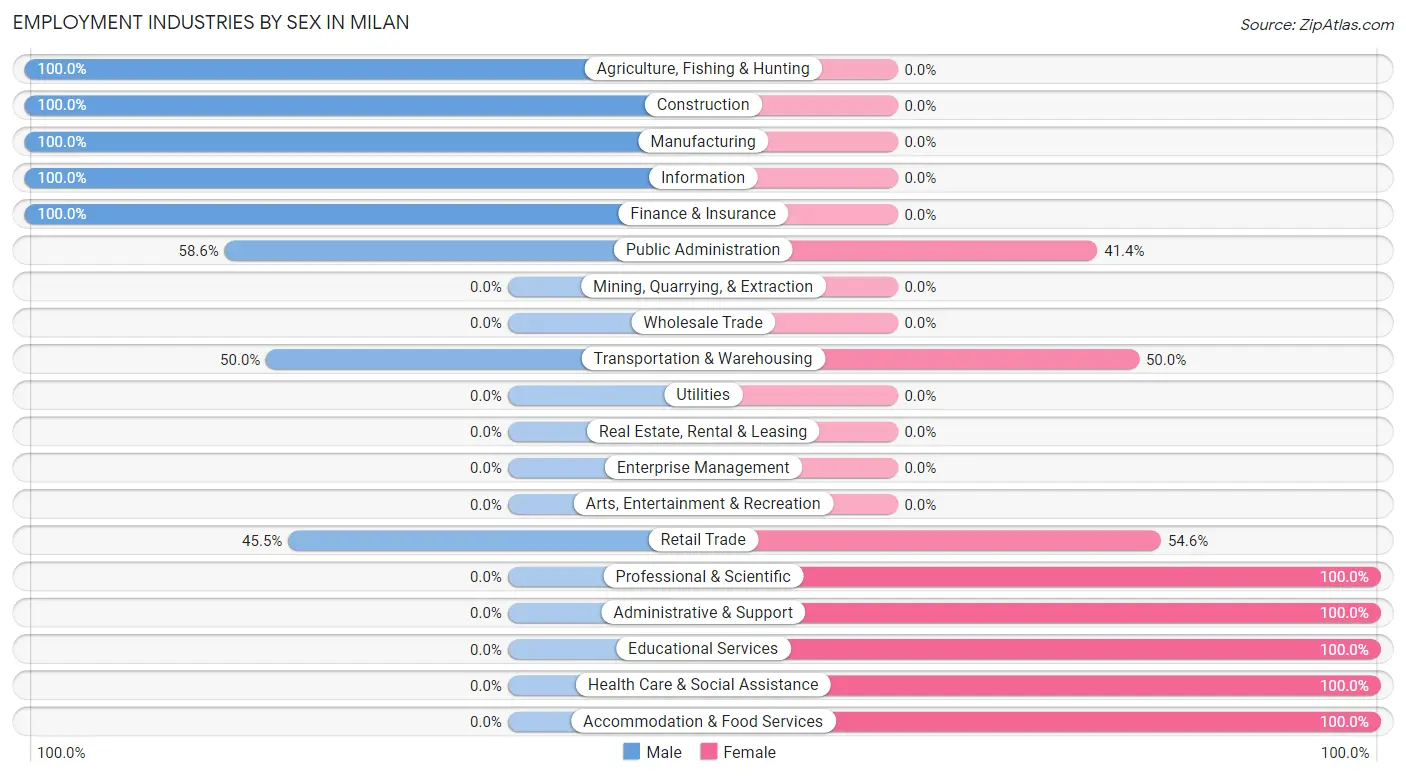
The Milan industries that see more men than women are Agriculture, Fishing & Hunting (100.0%), Construction (100.0%), and Manufacturing (100.0%), whereas the industries that tend to have a higher number of women are Professional & Scientific (100.0%), Administrative & Support (100.0%), and Educational Services (100.0%).
| Industry | Male | Female |
| Agriculture, Fishing & Hunting | 2 (100.0%) | 0 (0.0%) |
| Mining, Quarrying, & Extraction | 0 (0.0%) | 0 (0.0%) |
| Construction | 9 (100.0%) | 0 (0.0%) |
| Manufacturing | 26 (100.0%) | 0 (0.0%) |
| Wholesale Trade | 0 (0.0%) | 0 (0.0%) |
| Retail Trade | 5 (45.5%) | 6 (54.5%) |
| Transportation & Warehousing | 2 (50.0%) | 2 (50.0%) |
| Utilities | 0 (0.0%) | 0 (0.0%) |
| Information | 2 (100.0%) | 0 (0.0%) |
| Finance & Insurance | 6 (100.0%) | 0 (0.0%) |
| Real Estate, Rental & Leasing | 0 (0.0%) | 0 (0.0%) |
| Professional & Scientific | 0 (0.0%) | 5 (100.0%) |
| Enterprise Management | 0 (0.0%) | 0 (0.0%) |
| Administrative & Support | 0 (0.0%) | 29 (100.0%) |
| Educational Services | 0 (0.0%) | 7 (100.0%) |
| Health Care & Social Assistance | 0 (0.0%) | 29 (100.0%) |
| Arts, Entertainment & Recreation | 0 (0.0%) | 0 (0.0%) |
| Accommodation & Food Services | 0 (0.0%) | 21 (100.0%) |
| Public Administration | 17 (58.6%) | 12 (41.4%) |
| Total | 69 (38.3%) | 111 (61.7%) |
Education in Milan
School Enrollment in Milan
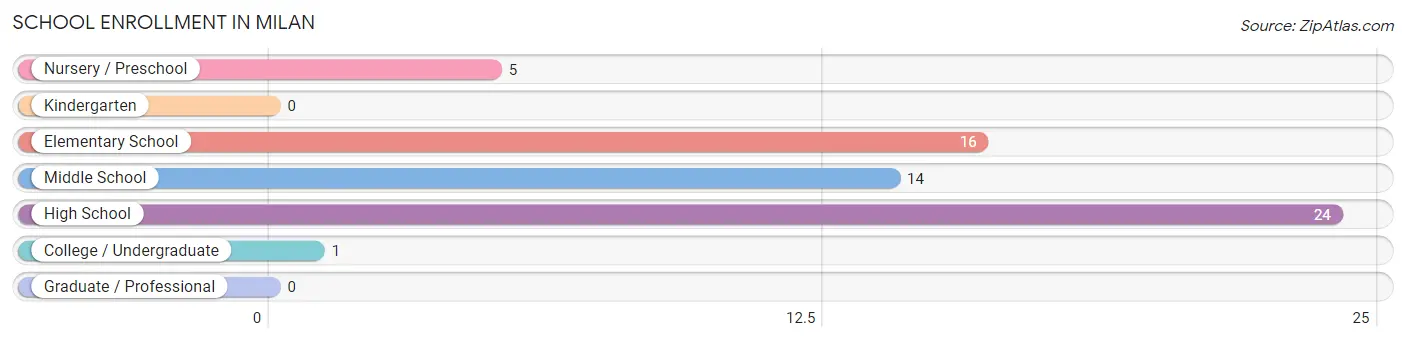
The most common levels of schooling among the 60 students in Milan are high school (24 | 40.0%), elementary school (16 | 26.7%), and middle school (14 | 23.3%).
| School Level | # Students | % Students |
| Nursery / Preschool | 5 | 8.3% |
| Kindergarten | 0 | 0.0% |
| Elementary School | 16 | 26.7% |
| Middle School | 14 | 23.3% |
| High School | 24 | 40.0% |
| College / Undergraduate | 1 | 1.7% |
| Graduate / Professional | 0 | 0.0% |
| Total | 60 | 100.0% |
School Enrollment by Age by Funding Source in Milan
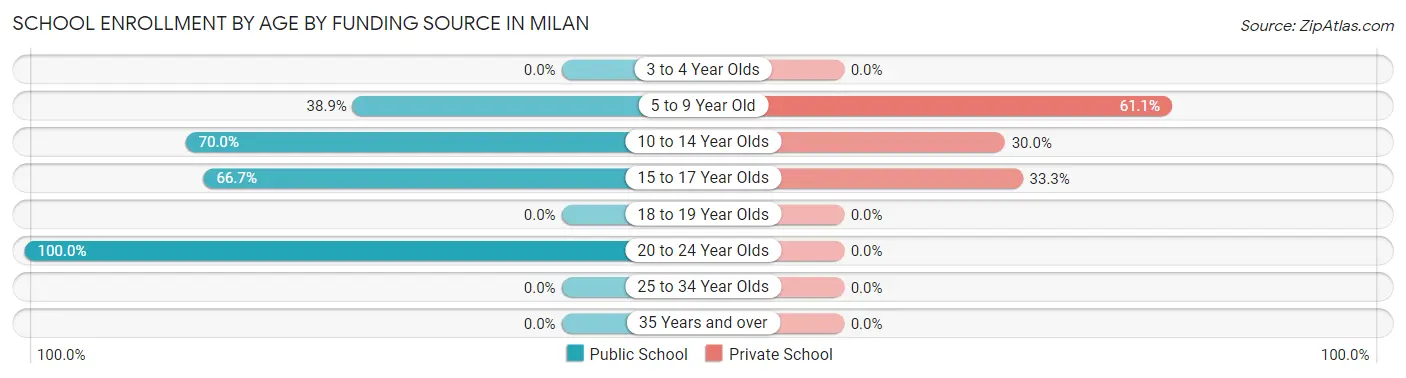
Out of a total of 60 students who are enrolled in schools in Milan, 23 (38.3%) attend a private institution, while the remaining 37 (61.7%) are enrolled in public schools. The age group of 5 to 9 year old has the highest likelihood of being enrolled in private schools, with 11 (61.1% in the age bracket) enrolled. Conversely, the age group of 20 to 24 year olds has the lowest likelihood of being enrolled in a private school, with 4 (100.0% in the age bracket) attending a public institution.
| Age Bracket | Public School | Private School |
| 3 to 4 Year Olds | 0 (0.0%) | 0 (0.0%) |
| 5 to 9 Year Old | 7 (38.9%) | 11 (61.1%) |
| 10 to 14 Year Olds | 14 (70.0%) | 6 (30.0%) |
| 15 to 17 Year Olds | 12 (66.7%) | 6 (33.3%) |
| 18 to 19 Year Olds | 0 (0.0%) | 0 (0.0%) |
| 20 to 24 Year Olds | 4 (100.0%) | 0 (0.0%) |
| 25 to 34 Year Olds | 0 (0.0%) | 0 (0.0%) |
| 35 Years and over | 0 (0.0%) | 0 (0.0%) |
| Total | 37 (61.7%) | 23 (38.3%) |
Educational Attainment by Field of Study in Milan
Education (33 | 66.0%), business (12 | 24.0%), arts & humanities (4 | 8.0%), and bio, nature & agricultural (1 | 2.0%) are the most common fields of study among 50 individuals in Milan who have obtained a bachelor's degree or higher.
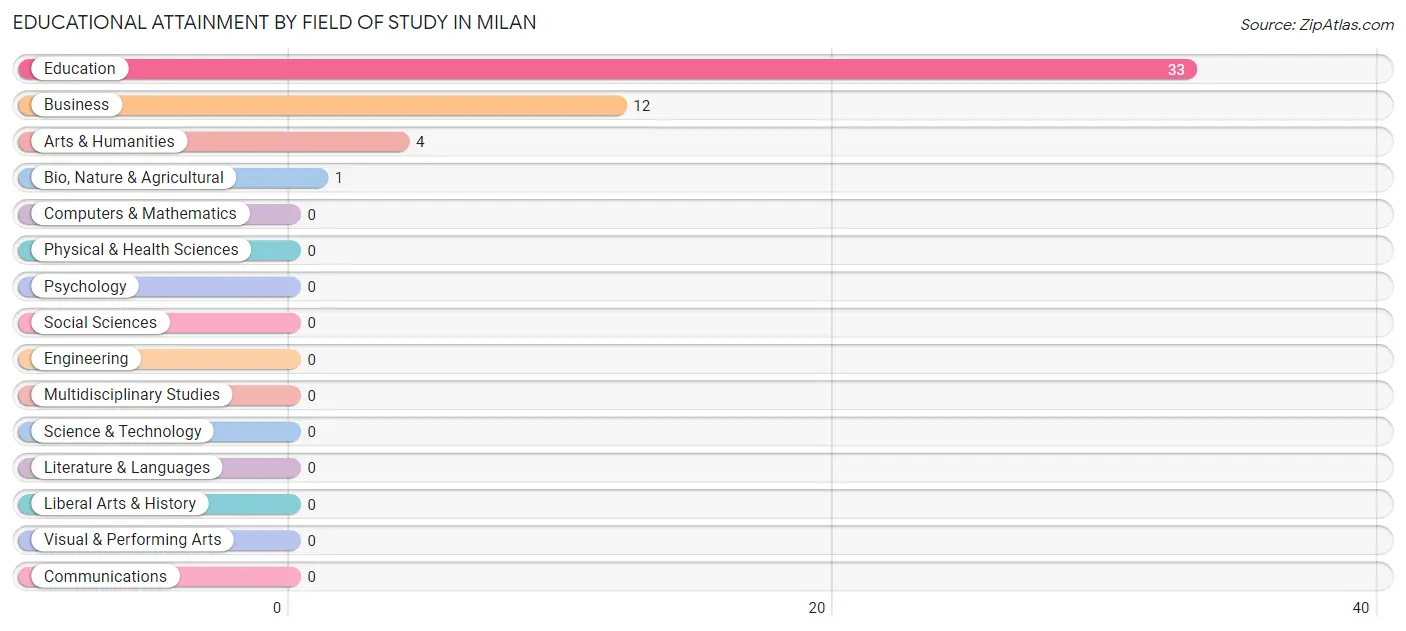
| Field of Study | # Graduates | % Graduates |
| Computers & Mathematics | 0 | 0.0% |
| Bio, Nature & Agricultural | 1 | 2.0% |
| Physical & Health Sciences | 0 | 0.0% |
| Psychology | 0 | 0.0% |
| Social Sciences | 0 | 0.0% |
| Engineering | 0 | 0.0% |
| Multidisciplinary Studies | 0 | 0.0% |
| Science & Technology | 0 | 0.0% |
| Business | 12 | 24.0% |
| Education | 33 | 66.0% |
| Literature & Languages | 0 | 0.0% |
| Liberal Arts & History | 0 | 0.0% |
| Visual & Performing Arts | 0 | 0.0% |
| Communications | 0 | 0.0% |
| Arts & Humanities | 4 | 8.0% |
| Total | 50 | 100.0% |
Transportation & Commute in Milan
Vehicle Availability by Sex in Milan
The most prevalent vehicle ownership categories in Milan are males with 2 vehicles (27, accounting for 39.1%) and females with 2 vehicles (62, making up 24.3%).
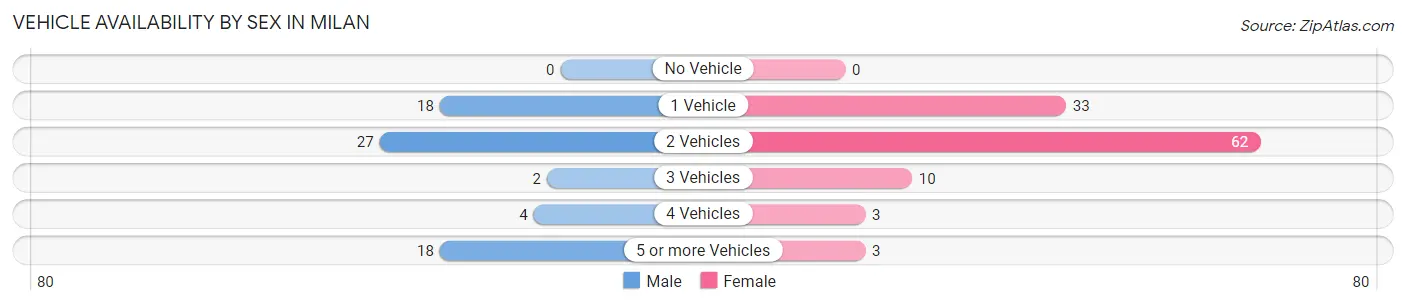
| Vehicles Available | Male | Female |
| No Vehicle | 0 (0.0%) | 0 (0.0%) |
| 1 Vehicle | 18 (26.1%) | 33 (29.7%) |
| 2 Vehicles | 27 (39.1%) | 62 (55.9%) |
| 3 Vehicles | 2 (2.9%) | 10 (9.0%) |
| 4 Vehicles | 4 (5.8%) | 3 (2.7%) |
| 5 or more Vehicles | 18 (26.1%) | 3 (2.7%) |
| Total | 69 (100.0%) | 111 (100.0%) |
Commute Time in Milan
The most frequently occuring commute durations in Milan are 90 or more minutes (54 commuters, 30.0%), 20 to 24 minutes (39 commuters, 21.7%), and 5 to 9 minutes (24 commuters, 13.3%).
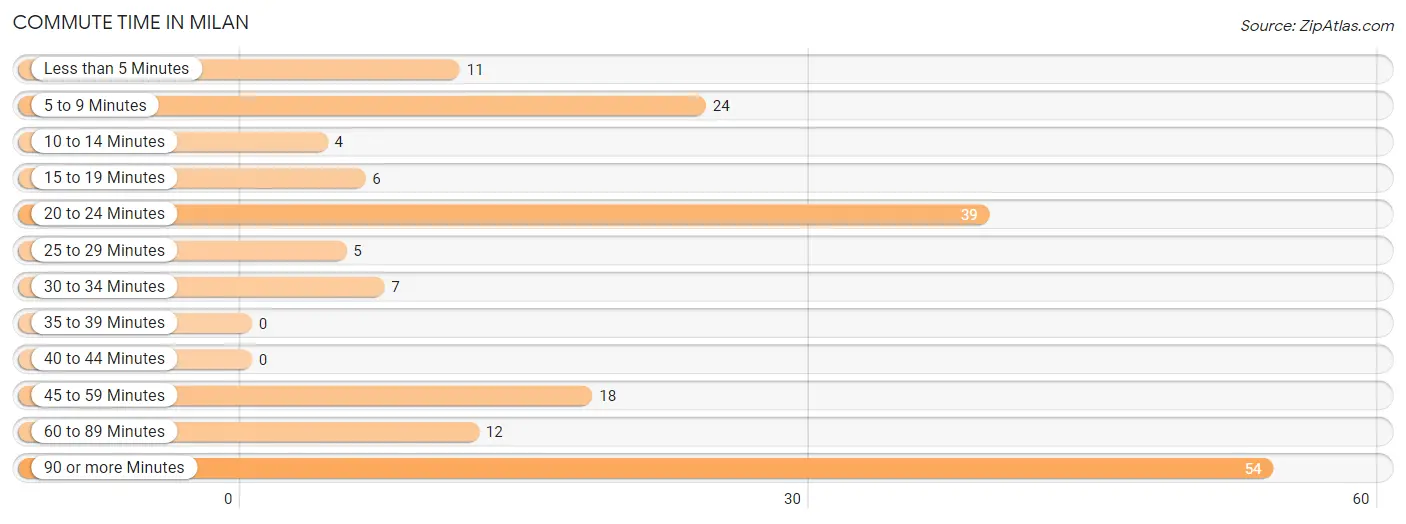
| Commute Time | # Commuters | % Commuters |
| Less than 5 Minutes | 11 | 6.1% |
| 5 to 9 Minutes | 24 | 13.3% |
| 10 to 14 Minutes | 4 | 2.2% |
| 15 to 19 Minutes | 6 | 3.3% |
| 20 to 24 Minutes | 39 | 21.7% |
| 25 to 29 Minutes | 5 | 2.8% |
| 30 to 34 Minutes | 7 | 3.9% |
| 35 to 39 Minutes | 0 | 0.0% |
| 40 to 44 Minutes | 0 | 0.0% |
| 45 to 59 Minutes | 18 | 10.0% |
| 60 to 89 Minutes | 12 | 6.7% |
| 90 or more Minutes | 54 | 30.0% |
Commute Time by Sex in Milan
The most common commute times in Milan are 90 or more minutes (37 commuters, 53.6%) for males and 20 to 24 minutes (27 commuters, 24.3%) for females.
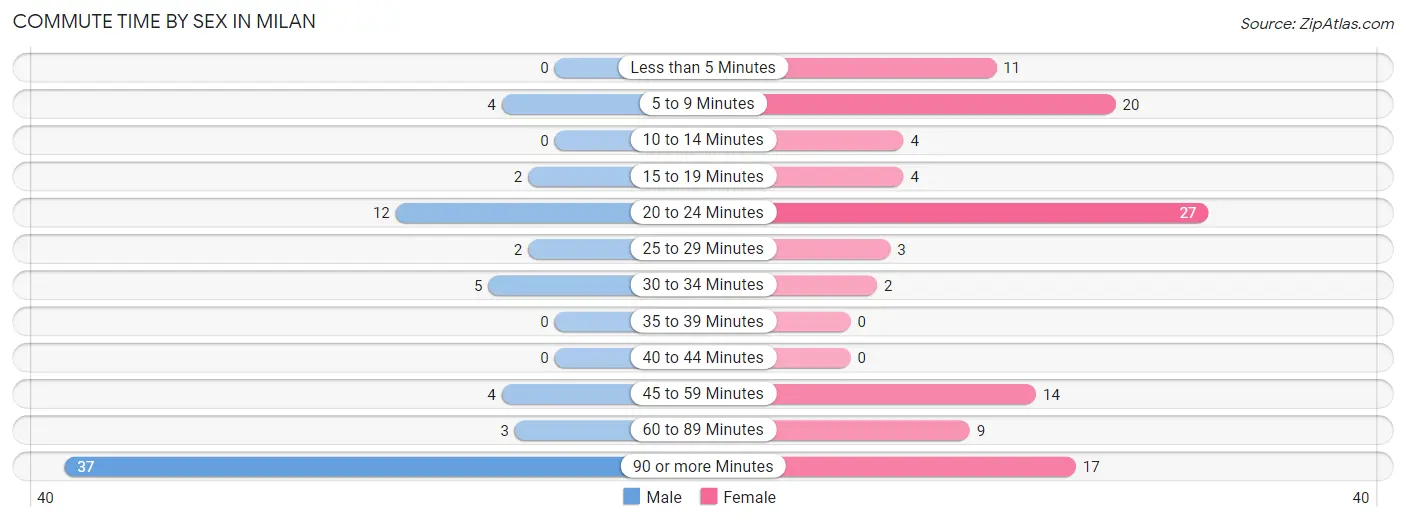
| Commute Time | Male | Female |
| Less than 5 Minutes | 0 (0.0%) | 11 (9.9%) |
| 5 to 9 Minutes | 4 (5.8%) | 20 (18.0%) |
| 10 to 14 Minutes | 0 (0.0%) | 4 (3.6%) |
| 15 to 19 Minutes | 2 (2.9%) | 4 (3.6%) |
| 20 to 24 Minutes | 12 (17.4%) | 27 (24.3%) |
| 25 to 29 Minutes | 2 (2.9%) | 3 (2.7%) |
| 30 to 34 Minutes | 5 (7.2%) | 2 (1.8%) |
| 35 to 39 Minutes | 0 (0.0%) | 0 (0.0%) |
| 40 to 44 Minutes | 0 (0.0%) | 0 (0.0%) |
| 45 to 59 Minutes | 4 (5.8%) | 14 (12.6%) |
| 60 to 89 Minutes | 3 (4.3%) | 9 (8.1%) |
| 90 or more Minutes | 37 (53.6%) | 17 (15.3%) |
Time of Departure to Work by Sex in Milan
The most frequent times of departure to work in Milan are 12:00 AM to 4:59 AM (23, 33.3%) for males and 9:00 AM to 9:59 AM (27, 24.3%) for females.
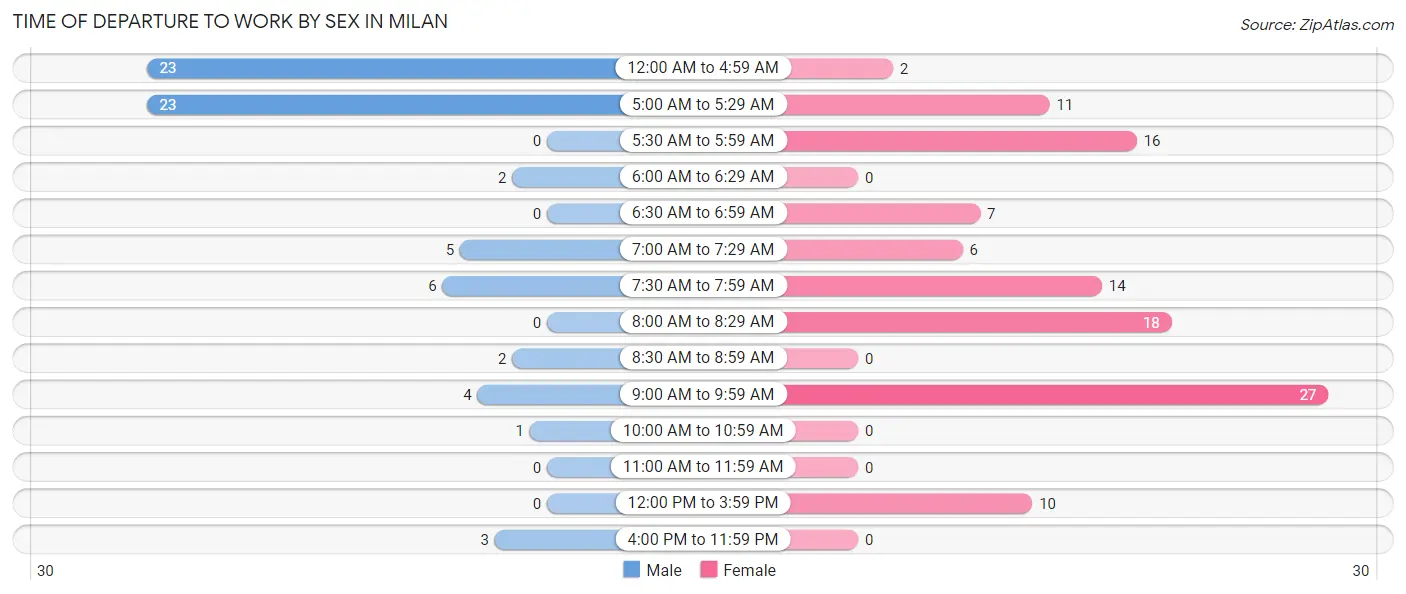
| Time of Departure | Male | Female |
| 12:00 AM to 4:59 AM | 23 (33.3%) | 2 (1.8%) |
| 5:00 AM to 5:29 AM | 23 (33.3%) | 11 (9.9%) |
| 5:30 AM to 5:59 AM | 0 (0.0%) | 16 (14.4%) |
| 6:00 AM to 6:29 AM | 2 (2.9%) | 0 (0.0%) |
| 6:30 AM to 6:59 AM | 0 (0.0%) | 7 (6.3%) |
| 7:00 AM to 7:29 AM | 5 (7.2%) | 6 (5.4%) |
| 7:30 AM to 7:59 AM | 6 (8.7%) | 14 (12.6%) |
| 8:00 AM to 8:29 AM | 0 (0.0%) | 18 (16.2%) |
| 8:30 AM to 8:59 AM | 2 (2.9%) | 0 (0.0%) |
| 9:00 AM to 9:59 AM | 4 (5.8%) | 27 (24.3%) |
| 10:00 AM to 10:59 AM | 1 (1.5%) | 0 (0.0%) |
| 11:00 AM to 11:59 AM | 0 (0.0%) | 0 (0.0%) |
| 12:00 PM to 3:59 PM | 0 (0.0%) | 10 (9.0%) |
| 4:00 PM to 11:59 PM | 3 (4.3%) | 0 (0.0%) |
| Total | 69 (100.0%) | 111 (100.0%) |
Housing Occupancy in Milan
Occupancy by Ownership in Milan
Of the total 281 dwellings in Milan, owner-occupied units account for 185 (65.8%), while renter-occupied units make up 96 (34.2%).
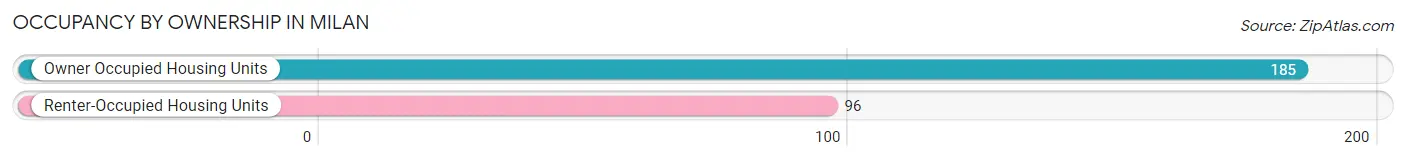
| Occupancy | # Housing Units | % Housing Units |
| Owner Occupied Housing Units | 185 | 65.8% |
| Renter-Occupied Housing Units | 96 | 34.2% |
| Total Occupied Housing Units | 281 | 100.0% |
Occupancy by Household Size in Milan
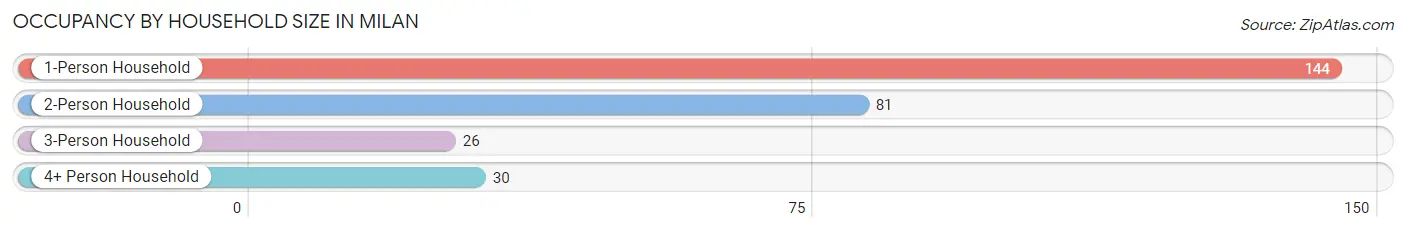
| Household Size | # Housing Units | % Housing Units |
| 1-Person Household | 144 | 51.2% |
| 2-Person Household | 81 | 28.8% |
| 3-Person Household | 26 | 9.2% |
| 4+ Person Household | 30 | 10.7% |
| Total Housing Units | 281 | 100.0% |
Occupancy by Ownership by Household Size in Milan
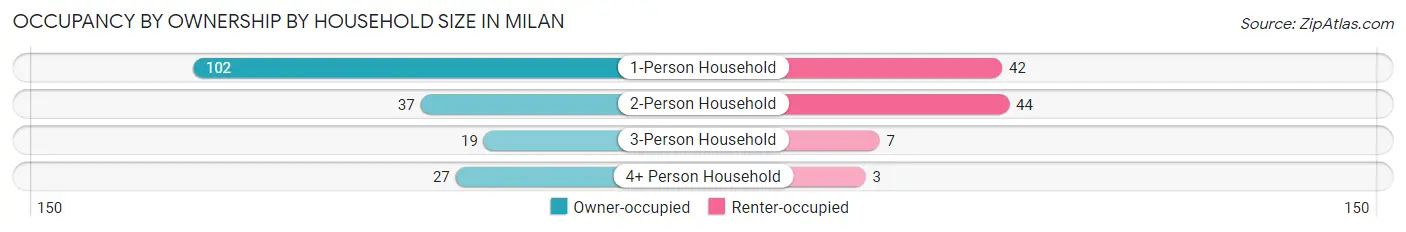
| Household Size | Owner-occupied | Renter-occupied |
| 1-Person Household | 102 (70.8%) | 42 (29.2%) |
| 2-Person Household | 37 (45.7%) | 44 (54.3%) |
| 3-Person Household | 19 (73.1%) | 7 (26.9%) |
| 4+ Person Household | 27 (90.0%) | 3 (10.0%) |
| Total Housing Units | 185 (65.8%) | 96 (34.2%) |
Occupancy by Educational Attainment in Milan
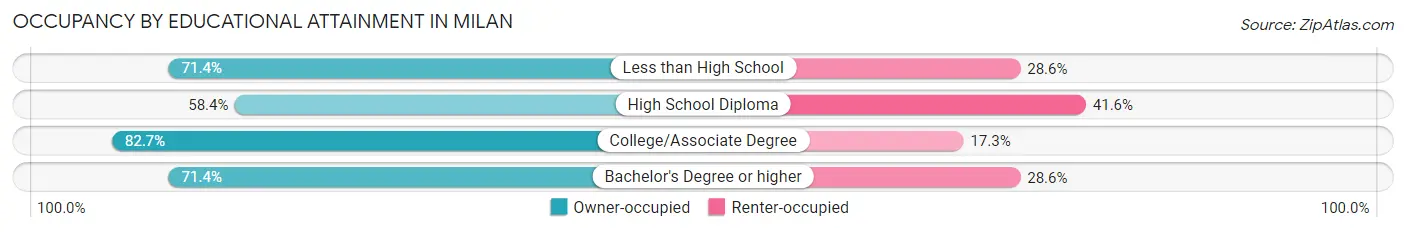
| Household Size | Owner-occupied | Renter-occupied |
| Less than High School | 25 (71.4%) | 10 (28.6%) |
| High School Diploma | 97 (58.4%) | 69 (41.6%) |
| College/Associate Degree | 43 (82.7%) | 9 (17.3%) |
| Bachelor's Degree or higher | 20 (71.4%) | 8 (28.6%) |
Occupancy by Age of Householder in Milan
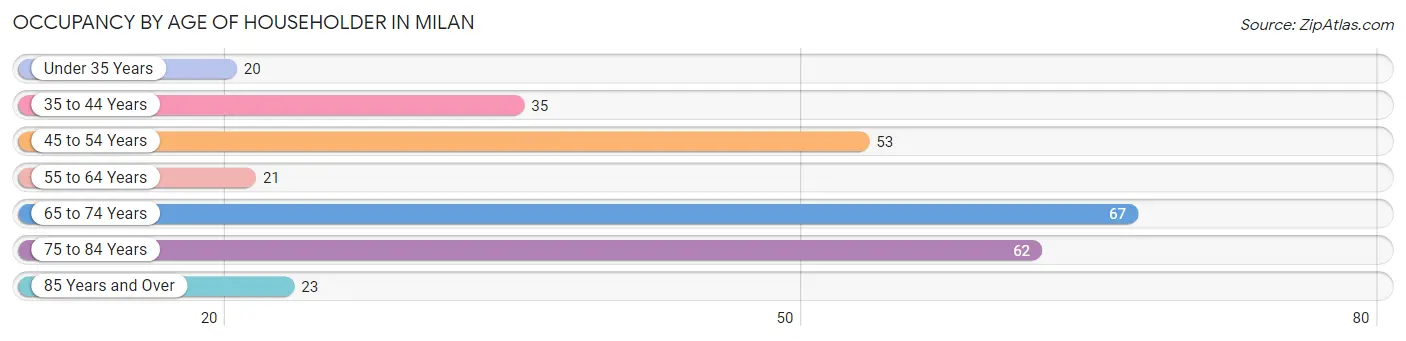
| Age Bracket | # Households | % Households |
| Under 35 Years | 20 | 7.1% |
| 35 to 44 Years | 35 | 12.5% |
| 45 to 54 Years | 53 | 18.9% |
| 55 to 64 Years | 21 | 7.5% |
| 65 to 74 Years | 67 | 23.8% |
| 75 to 84 Years | 62 | 22.1% |
| 85 Years and Over | 23 | 8.2% |
| Total | 281 | 100.0% |
Housing Finances in Milan
Median Income by Occupancy in Milan
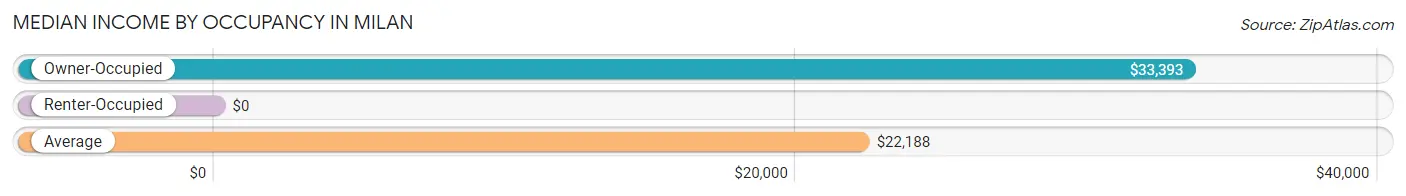
| Occupancy Type | # Households | Median Income |
| Owner-Occupied | 185 (65.8%) | $33,393 |
| Renter-Occupied | 96 (34.2%) | $0 |
| Average | 281 (100.0%) | $22,188 |
Occupancy by Householder Income Bracket in Milan
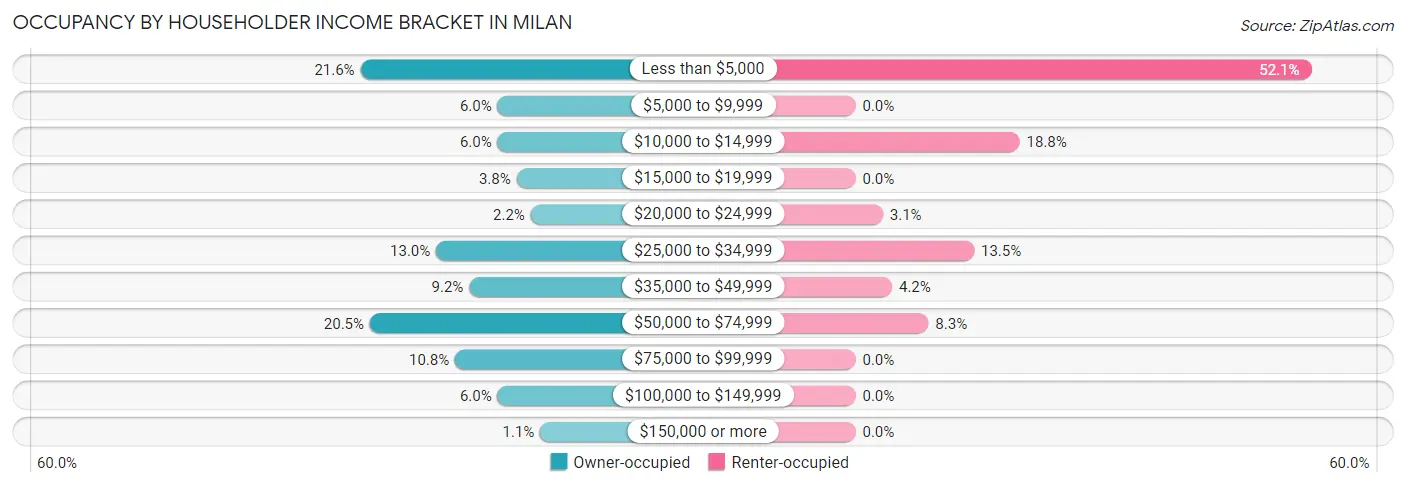
| Income Bracket | Owner-occupied | Renter-occupied |
| Less than $5,000 | 40 (21.6%) | 50 (52.1%) |
| $5,000 to $9,999 | 11 (5.9%) | 0 (0.0%) |
| $10,000 to $14,999 | 11 (5.9%) | 18 (18.8%) |
| $15,000 to $19,999 | 7 (3.8%) | 0 (0.0%) |
| $20,000 to $24,999 | 4 (2.2%) | 3 (3.1%) |
| $25,000 to $34,999 | 24 (13.0%) | 13 (13.5%) |
| $35,000 to $49,999 | 17 (9.2%) | 4 (4.2%) |
| $50,000 to $74,999 | 38 (20.5%) | 8 (8.3%) |
| $75,000 to $99,999 | 20 (10.8%) | 0 (0.0%) |
| $100,000 to $149,999 | 11 (5.9%) | 0 (0.0%) |
| $150,000 or more | 2 (1.1%) | 0 (0.0%) |
| Total | 185 (100.0%) | 96 (100.0%) |
Monthly Housing Cost Tiers in Milan
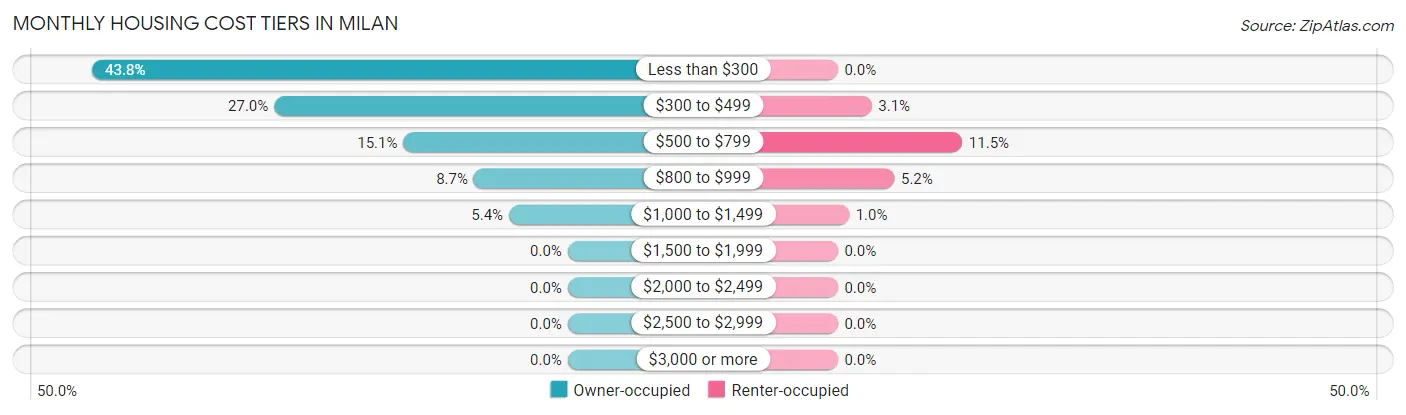
| Monthly Cost | Owner-occupied | Renter-occupied |
| Less than $300 | 81 (43.8%) | 0 (0.0%) |
| $300 to $499 | 50 (27.0%) | 3 (3.1%) |
| $500 to $799 | 28 (15.1%) | 11 (11.5%) |
| $800 to $999 | 16 (8.6%) | 5 (5.2%) |
| $1,000 to $1,499 | 10 (5.4%) | 1 (1.0%) |
| $1,500 to $1,999 | 0 (0.0%) | 0 (0.0%) |
| $2,000 to $2,499 | 0 (0.0%) | 0 (0.0%) |
| $2,500 to $2,999 | 0 (0.0%) | 0 (0.0%) |
| $3,000 or more | 0 (0.0%) | 0 (0.0%) |
| Total | 185 (100.0%) | 96 (100.0%) |
Physical Housing Characteristics in Milan
Housing Structures in Milan
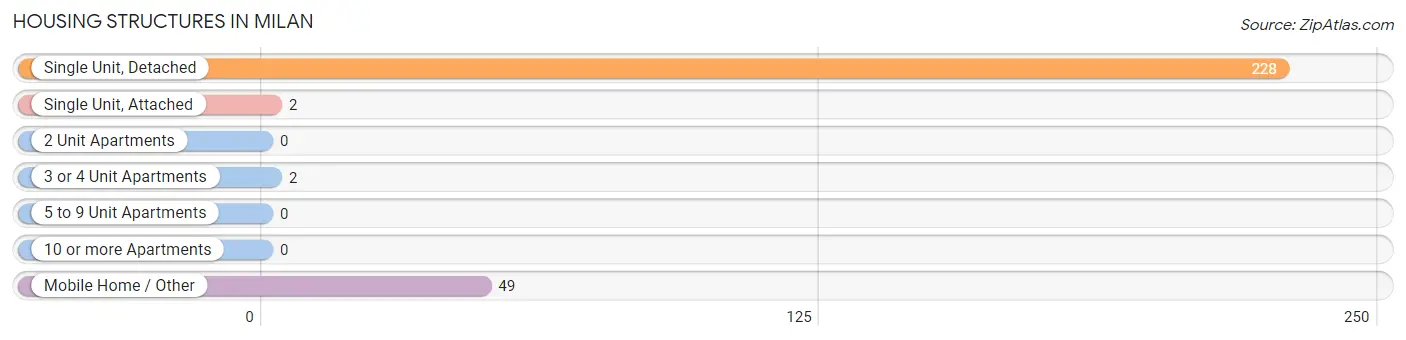
| Structure Type | # Housing Units | % Housing Units |
| Single Unit, Detached | 228 | 81.1% |
| Single Unit, Attached | 2 | 0.7% |
| 2 Unit Apartments | 0 | 0.0% |
| 3 or 4 Unit Apartments | 2 | 0.7% |
| 5 to 9 Unit Apartments | 0 | 0.0% |
| 10 or more Apartments | 0 | 0.0% |
| Mobile Home / Other | 49 | 17.4% |
| Total | 281 | 100.0% |
Housing Structures by Occupancy in Milan
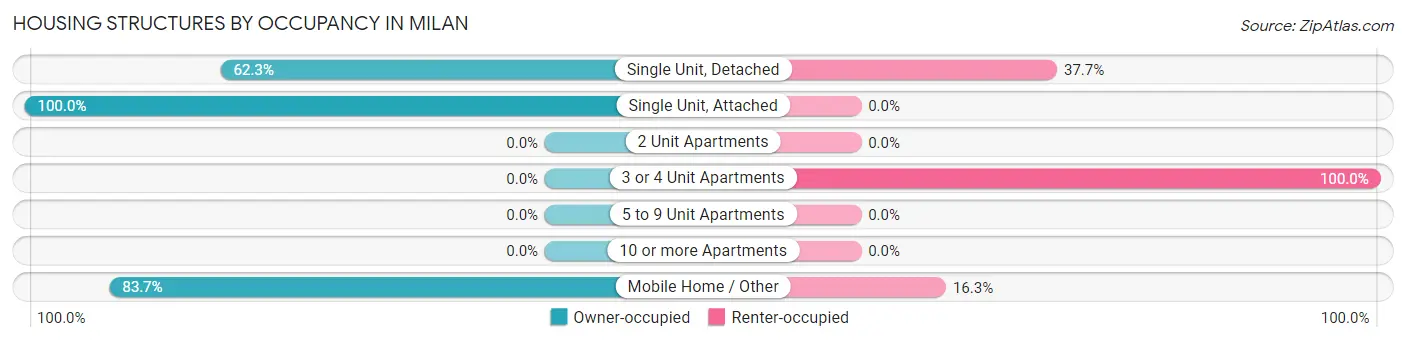
| Structure Type | Owner-occupied | Renter-occupied |
| Single Unit, Detached | 142 (62.3%) | 86 (37.7%) |
| Single Unit, Attached | 2 (100.0%) | 0 (0.0%) |
| 2 Unit Apartments | 0 (0.0%) | 0 (0.0%) |
| 3 or 4 Unit Apartments | 0 (0.0%) | 2 (100.0%) |
| 5 to 9 Unit Apartments | 0 (0.0%) | 0 (0.0%) |
| 10 or more Apartments | 0 (0.0%) | 0 (0.0%) |
| Mobile Home / Other | 41 (83.7%) | 8 (16.3%) |
| Total | 185 (65.8%) | 96 (34.2%) |
Housing Structures by Number of Rooms in Milan
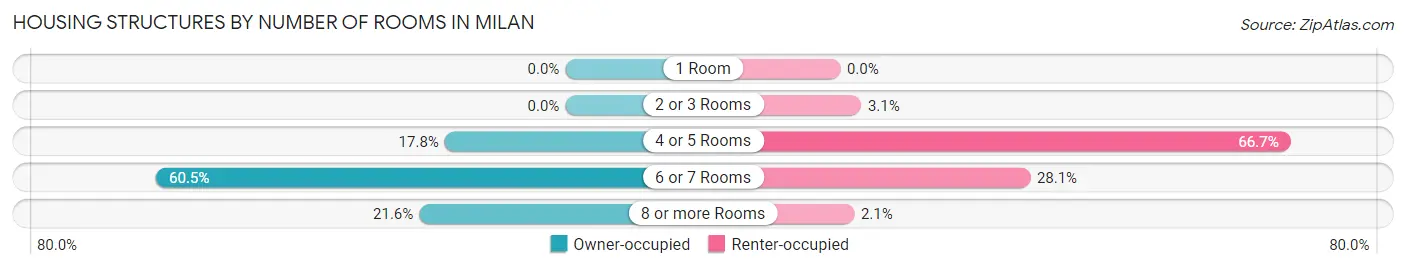
| Number of Rooms | Owner-occupied | Renter-occupied |
| 1 Room | 0 (0.0%) | 0 (0.0%) |
| 2 or 3 Rooms | 0 (0.0%) | 3 (3.1%) |
| 4 or 5 Rooms | 33 (17.8%) | 64 (66.7%) |
| 6 or 7 Rooms | 112 (60.5%) | 27 (28.1%) |
| 8 or more Rooms | 40 (21.6%) | 2 (2.1%) |
| Total | 185 (100.0%) | 96 (100.0%) |
Housing Structure by Heating Type in Milan
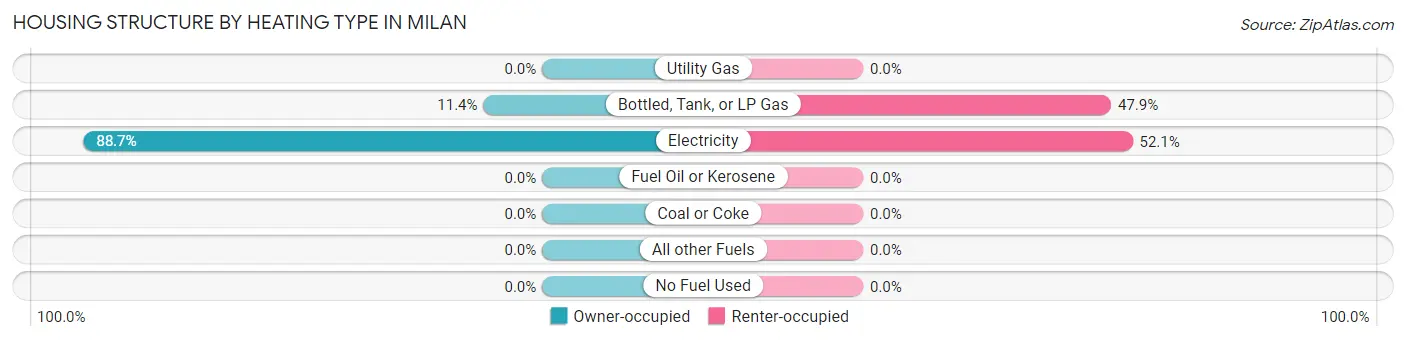
| Heating Type | Owner-occupied | Renter-occupied |
| Utility Gas | 0 (0.0%) | 0 (0.0%) |
| Bottled, Tank, or LP Gas | 21 (11.4%) | 46 (47.9%) |
| Electricity | 164 (88.6%) | 50 (52.1%) |
| Fuel Oil or Kerosene | 0 (0.0%) | 0 (0.0%) |
| Coal or Coke | 0 (0.0%) | 0 (0.0%) |
| All other Fuels | 0 (0.0%) | 0 (0.0%) |
| No Fuel Used | 0 (0.0%) | 0 (0.0%) |
| Total | 185 (100.0%) | 96 (100.0%) |
Household Vehicle Usage in Milan
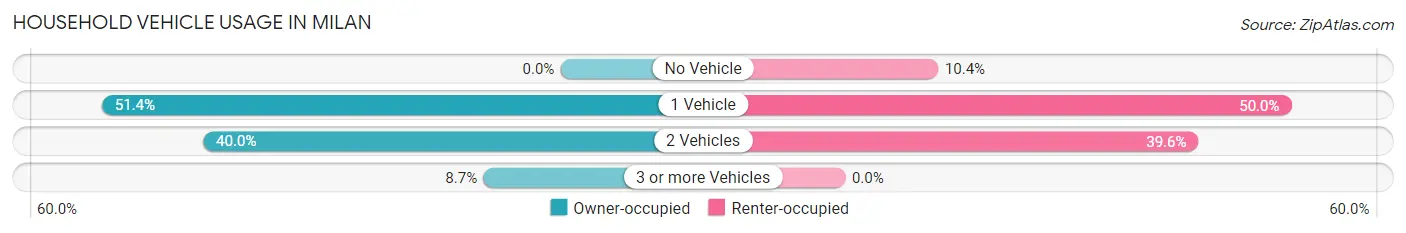
| Vehicles per Household | Owner-occupied | Renter-occupied |
| No Vehicle | 0 (0.0%) | 10 (10.4%) |
| 1 Vehicle | 95 (51.3%) | 48 (50.0%) |
| 2 Vehicles | 74 (40.0%) | 38 (39.6%) |
| 3 or more Vehicles | 16 (8.6%) | 0 (0.0%) |
| Total | 185 (100.0%) | 96 (100.0%) |
Real Estate & Mortgages in Milan
Real Estate and Mortgage Overview in Milan
| Characteristic | Without Mortgage | With Mortgage |
| Housing Units | 135 | 50 |
| Median Property Value | $46,100 | $98,900 |
| Median Household Income | - | - |
| Monthly Housing Costs | $284 | $0 |
| Real Estate Taxes | - | - |
Property Value by Mortgage Status in Milan
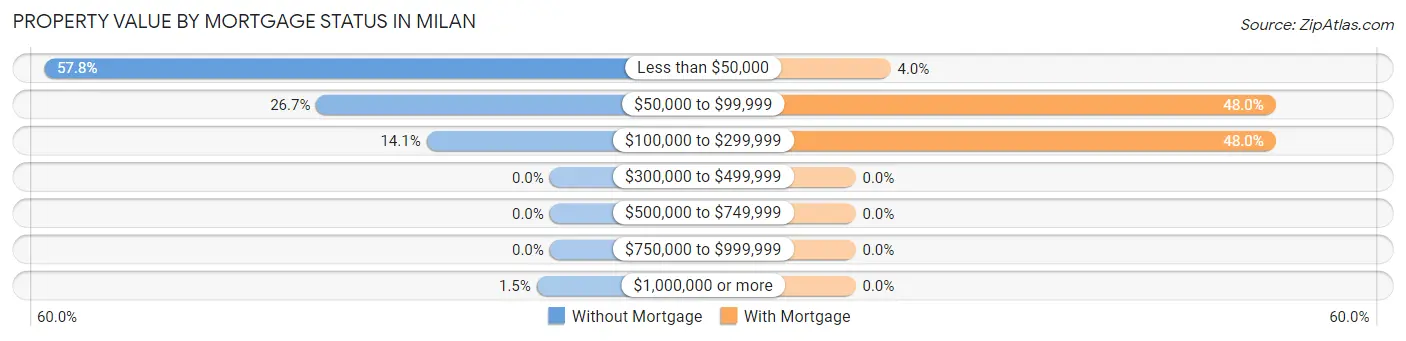
| Property Value | Without Mortgage | With Mortgage |
| Less than $50,000 | 78 (57.8%) | 2 (4.0%) |
| $50,000 to $99,999 | 36 (26.7%) | 24 (48.0%) |
| $100,000 to $299,999 | 19 (14.1%) | 24 (48.0%) |
| $300,000 to $499,999 | 0 (0.0%) | 0 (0.0%) |
| $500,000 to $749,999 | 0 (0.0%) | 0 (0.0%) |
| $750,000 to $999,999 | 0 (0.0%) | 0 (0.0%) |
| $1,000,000 or more | 2 (1.5%) | 0 (0.0%) |
| Total | 135 (100.0%) | 50 (100.0%) |
Household Income by Mortgage Status in Milan
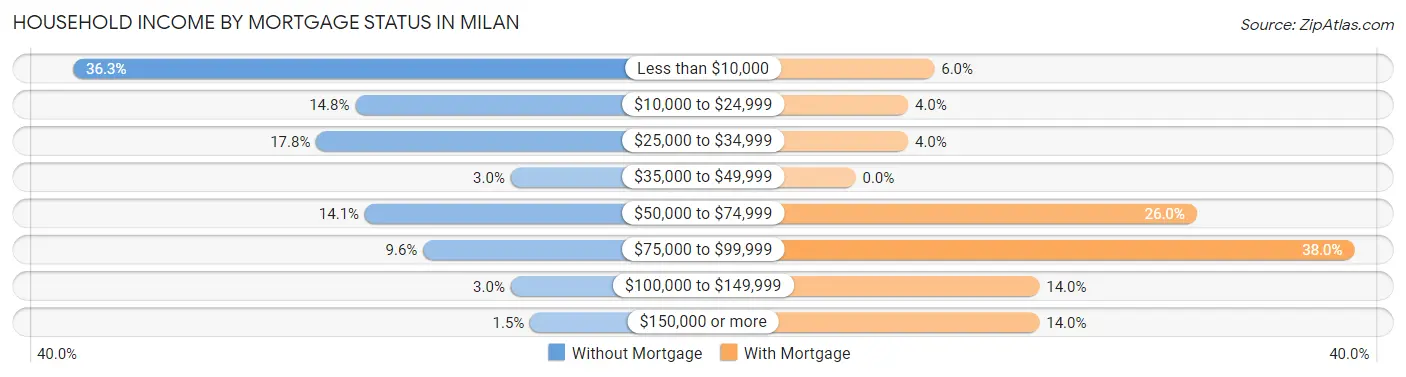
| Household Income | Without Mortgage | With Mortgage |
| Less than $10,000 | 49 (36.3%) | 3 (6.0%) |
| $10,000 to $24,999 | 20 (14.8%) | 2 (4.0%) |
| $25,000 to $34,999 | 24 (17.8%) | 2 (4.0%) |
| $35,000 to $49,999 | 4 (3.0%) | 0 (0.0%) |
| $50,000 to $74,999 | 19 (14.1%) | 13 (26.0%) |
| $75,000 to $99,999 | 13 (9.6%) | 19 (38.0%) |
| $100,000 to $149,999 | 4 (3.0%) | 7 (14.0%) |
| $150,000 or more | 2 (1.5%) | 7 (14.0%) |
| Total | 135 (100.0%) | 50 (100.0%) |
Property Value to Household Income Ratio in Milan
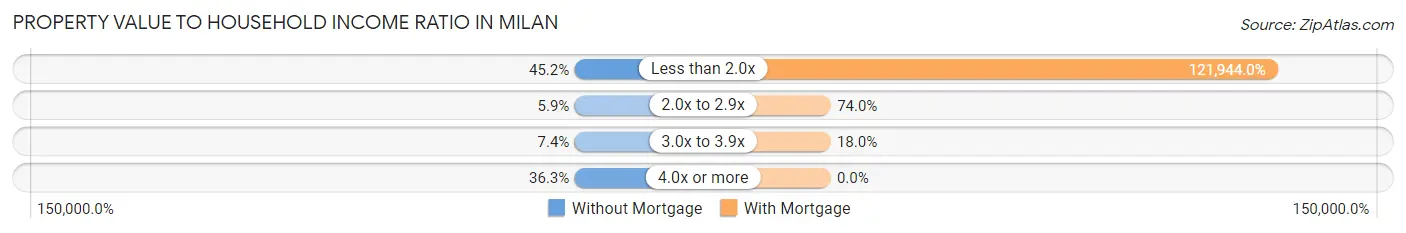
| Value-to-Income Ratio | Without Mortgage | With Mortgage |
| Less than 2.0x | 61 (45.2%) | 60,972 (121,944.0%) |
| 2.0x to 2.9x | 8 (5.9%) | 37 (74.0%) |
| 3.0x to 3.9x | 10 (7.4%) | 9 (18.0%) |
| 4.0x or more | 49 (36.3%) | 0 (0.0%) |
| Total | 135 (100.0%) | 50 (100.0%) |
Real Estate Taxes by Mortgage Status in Milan
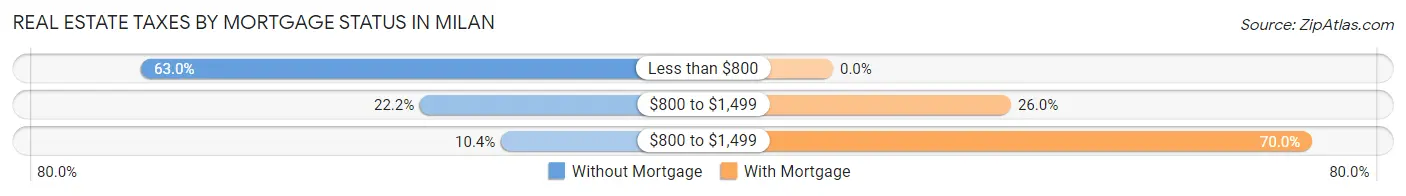
| Property Taxes | Without Mortgage | With Mortgage |
| Less than $800 | 85 (63.0%) | 0 (0.0%) |
| $800 to $1,499 | 30 (22.2%) | 13 (26.0%) |
| $800 to $1,499 | 14 (10.4%) | 35 (70.0%) |
| Total | 135 (100.0%) | 50 (100.0%) |
Health & Disability in Milan
Health Insurance Coverage by Age in Milan
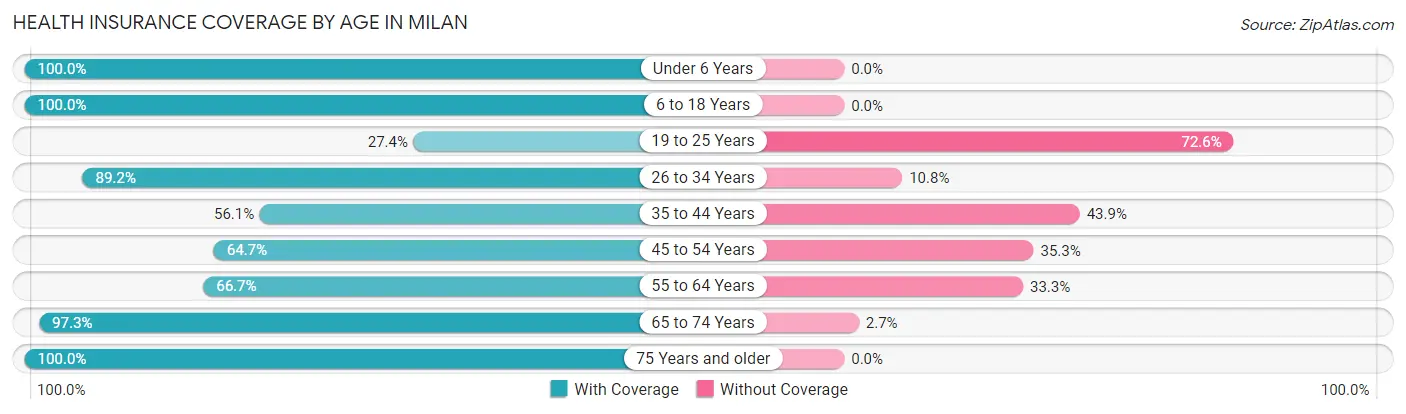
| Age Bracket | With Coverage | Without Coverage |
| Under 6 Years | 48 (100.0%) | 0 (0.0%) |
| 6 to 18 Years | 58 (100.0%) | 0 (0.0%) |
| 19 to 25 Years | 17 (27.4%) | 45 (72.6%) |
| 26 to 34 Years | 33 (89.2%) | 4 (10.8%) |
| 35 to 44 Years | 23 (56.1%) | 18 (43.9%) |
| 45 to 54 Years | 55 (64.7%) | 30 (35.3%) |
| 55 to 64 Years | 24 (66.7%) | 12 (33.3%) |
| 65 to 74 Years | 143 (97.3%) | 4 (2.7%) |
| 75 Years and older | 94 (100.0%) | 0 (0.0%) |
| Total | 495 (81.4%) | 113 (18.6%) |
Health Insurance Coverage by Citizenship Status in Milan
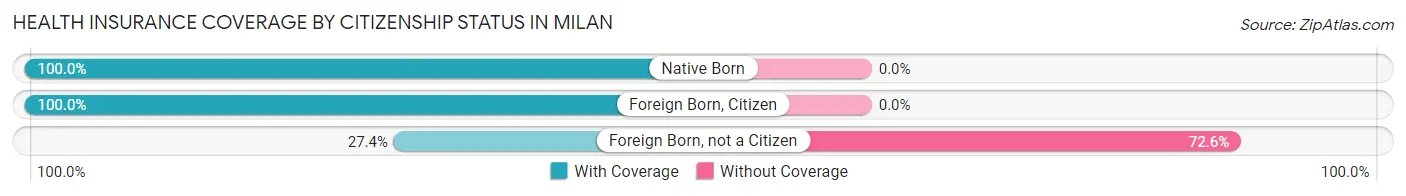
| Citizenship Status | With Coverage | Without Coverage |
| Native Born | 48 (100.0%) | 0 (0.0%) |
| Foreign Born, Citizen | 58 (100.0%) | 0 (0.0%) |
| Foreign Born, not a Citizen | 17 (27.4%) | 45 (72.6%) |
Health Insurance Coverage by Household Income in Milan
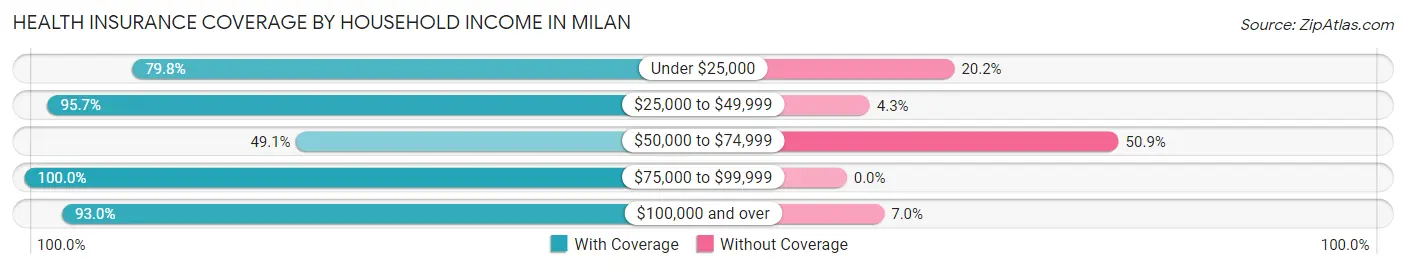
| Household Income | With Coverage | Without Coverage |
| Under $25,000 | 190 (79.8%) | 48 (20.2%) |
| $25,000 to $49,999 | 133 (95.7%) | 6 (4.3%) |
| $50,000 to $74,999 | 53 (49.1%) | 55 (50.9%) |
| $75,000 to $99,999 | 66 (100.0%) | 0 (0.0%) |
| $100,000 and over | 53 (93.0%) | 4 (7.0%) |
Public vs Private Health Insurance Coverage by Age in Milan
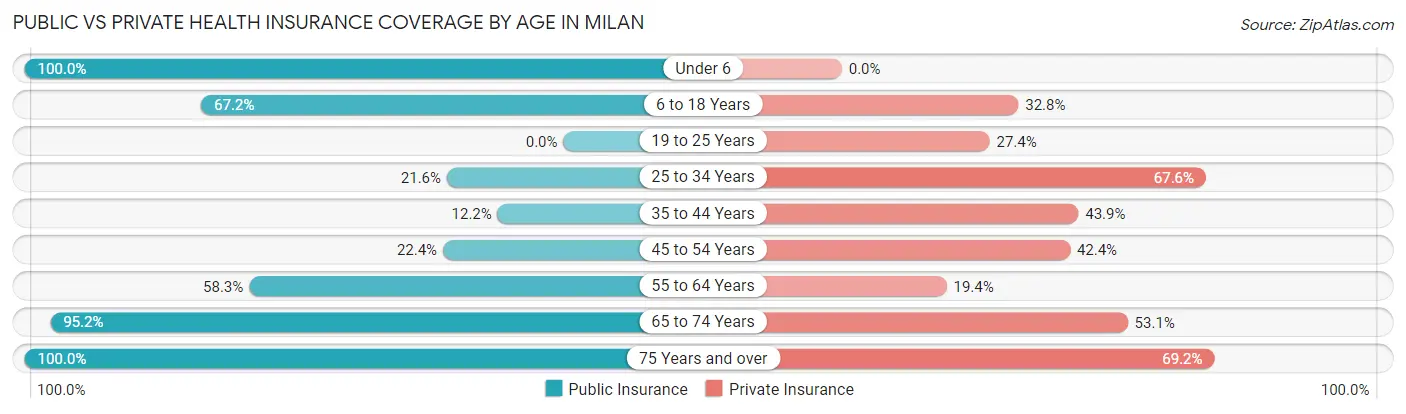
| Age Bracket | Public Insurance | Private Insurance |
| Under 6 | 48 (100.0%) | 0 (0.0%) |
| 6 to 18 Years | 39 (67.2%) | 19 (32.8%) |
| 19 to 25 Years | 0 (0.0%) | 17 (27.4%) |
| 25 to 34 Years | 8 (21.6%) | 25 (67.6%) |
| 35 to 44 Years | 5 (12.2%) | 18 (43.9%) |
| 45 to 54 Years | 19 (22.4%) | 36 (42.3%) |
| 55 to 64 Years | 21 (58.3%) | 7 (19.4%) |
| 65 to 74 Years | 140 (95.2%) | 78 (53.1%) |
| 75 Years and over | 94 (100.0%) | 65 (69.2%) |
| Total | 374 (61.5%) | 265 (43.6%) |
Disability Status by Sex by Age in Milan

| Age Bracket | Male | Female |
| Under 5 Years | 0 (0.0%) | 0 (0.0%) |
| 5 to 17 Years | 3 (10.0%) | 1 (3.5%) |
| 18 to 34 Years | 14 (20.0%) | 14 (42.4%) |
| 35 to 64 Years | 16 (23.9%) | 42 (44.2%) |
| 65 to 74 Years | 5 (29.4%) | 74 (56.9%) |
| 75 Years and over | 41 (74.6%) | 7 (17.9%) |
Disability Class by Sex by Age in Milan
Disability Class: Hearing Difficulty
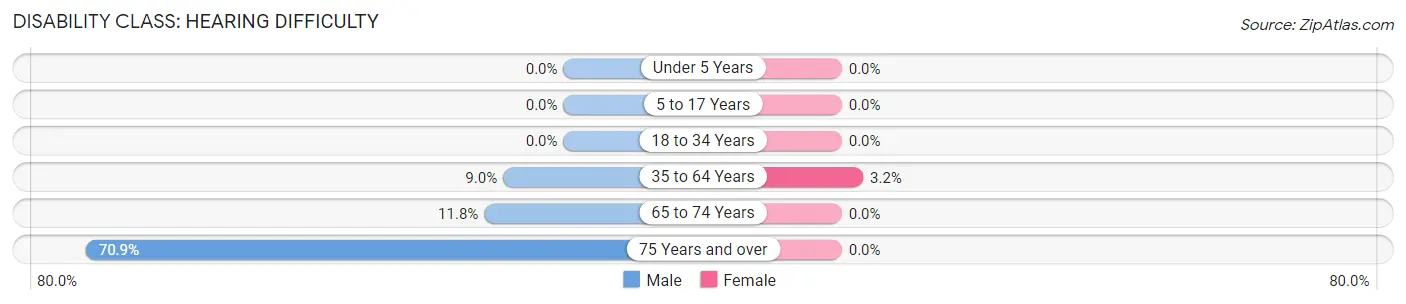
| Age Bracket | Male | Female |
| Under 5 Years | 0 (0.0%) | 0 (0.0%) |
| 5 to 17 Years | 0 (0.0%) | 0 (0.0%) |
| 18 to 34 Years | 0 (0.0%) | 0 (0.0%) |
| 35 to 64 Years | 6 (9.0%) | 3 (3.2%) |
| 65 to 74 Years | 2 (11.8%) | 0 (0.0%) |
| 75 Years and over | 39 (70.9%) | 0 (0.0%) |
Disability Class: Vision Difficulty
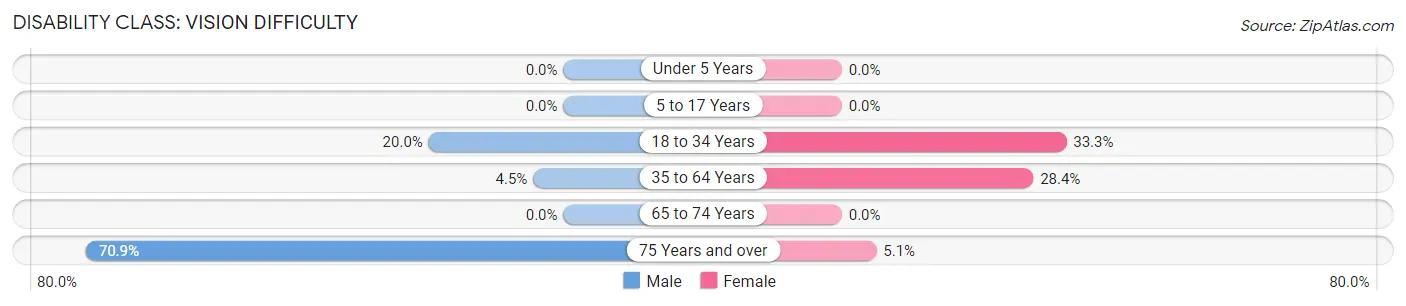
| Age Bracket | Male | Female |
| Under 5 Years | 0 (0.0%) | 0 (0.0%) |
| 5 to 17 Years | 0 (0.0%) | 0 (0.0%) |
| 18 to 34 Years | 14 (20.0%) | 11 (33.3%) |
| 35 to 64 Years | 3 (4.5%) | 27 (28.4%) |
| 65 to 74 Years | 0 (0.0%) | 0 (0.0%) |
| 75 Years and over | 39 (70.9%) | 2 (5.1%) |
Disability Class: Cognitive Difficulty
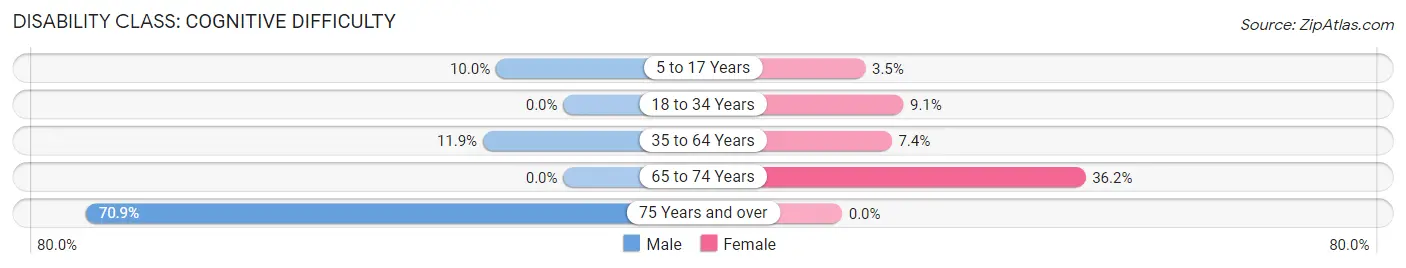
| Age Bracket | Male | Female |
| 5 to 17 Years | 3 (10.0%) | 1 (3.5%) |
| 18 to 34 Years | 0 (0.0%) | 3 (9.1%) |
| 35 to 64 Years | 8 (11.9%) | 7 (7.4%) |
| 65 to 74 Years | 0 (0.0%) | 47 (36.1%) |
| 75 Years and over | 39 (70.9%) | 0 (0.0%) |
Disability Class: Ambulatory Difficulty
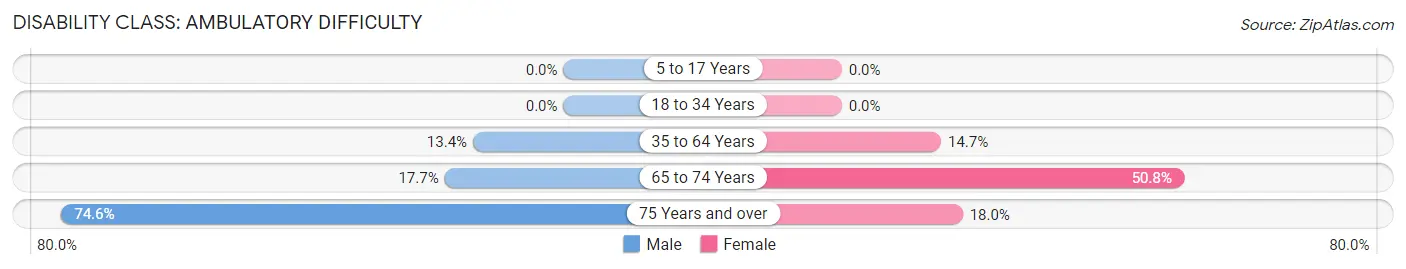
| Age Bracket | Male | Female |
| 5 to 17 Years | 0 (0.0%) | 0 (0.0%) |
| 18 to 34 Years | 0 (0.0%) | 0 (0.0%) |
| 35 to 64 Years | 9 (13.4%) | 14 (14.7%) |
| 65 to 74 Years | 3 (17.6%) | 66 (50.8%) |
| 75 Years and over | 41 (74.6%) | 7 (17.9%) |
Disability Class: Self-Care Difficulty
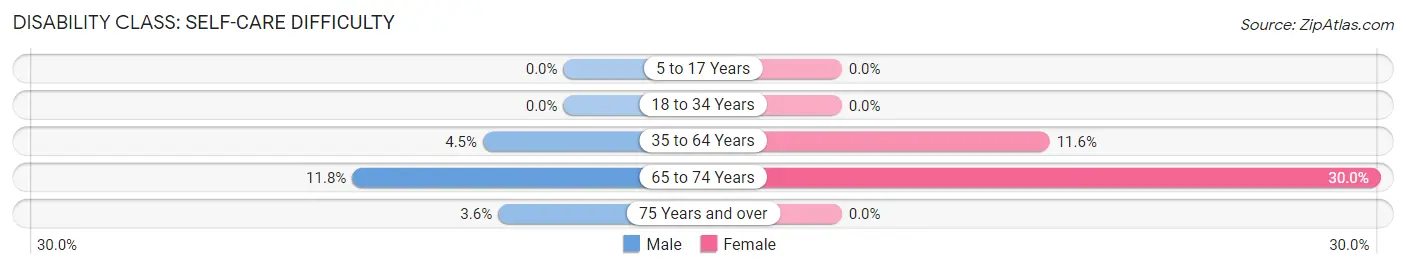
| Age Bracket | Male | Female |
| 5 to 17 Years | 0 (0.0%) | 0 (0.0%) |
| 18 to 34 Years | 0 (0.0%) | 0 (0.0%) |
| 35 to 64 Years | 3 (4.5%) | 11 (11.6%) |
| 65 to 74 Years | 2 (11.8%) | 39 (30.0%) |
| 75 Years and over | 2 (3.6%) | 0 (0.0%) |
Technology Access in Milan
Computing Device Access in Milan
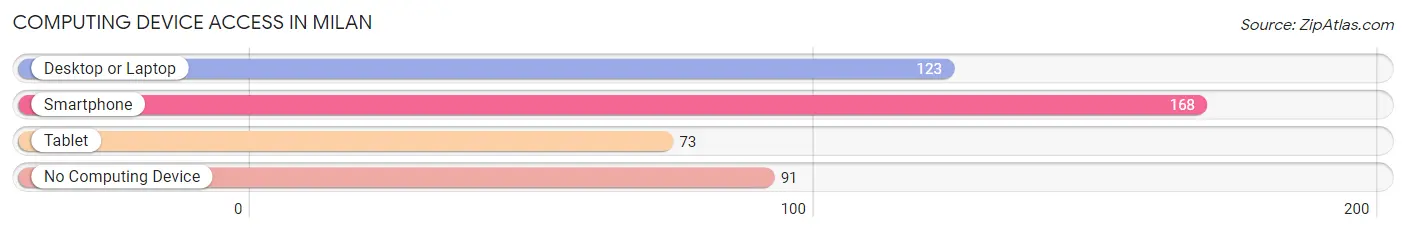
| Device Type | # Households | % Households |
| Desktop or Laptop | 123 | 43.8% |
| Smartphone | 168 | 59.8% |
| Tablet | 73 | 26.0% |
| No Computing Device | 91 | 32.4% |
| Total | 281 | 100.0% |
Internet Access in Milan
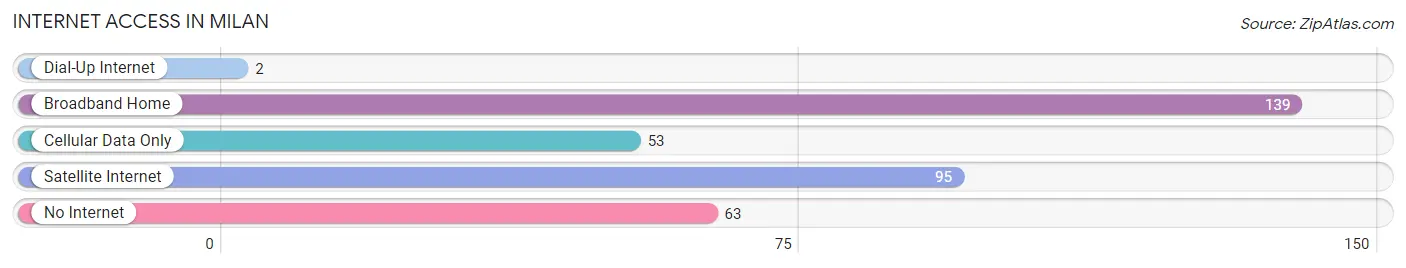
| Internet Type | # Households | % Households |
| Dial-Up Internet | 2 | 0.7% |
| Broadband Home | 139 | 49.5% |
| Cellular Data Only | 53 | 18.9% |
| Satellite Internet | 95 | 33.8% |
| No Internet | 63 | 22.4% |
| Total | 281 | 100.0% |
Milan Summary
Milan, Georgia is a small town located in the northwest corner of the state, in the foothills of the Appalachian Mountains. It is part of the Rome-Summerville Metropolitan Statistical Area, and is the county seat of Dade County. The town was founded in 1837 and named after the Italian city of Milan.
Geography
Milan is located at 34°41'25" North, 85°14'45" West (34.690278, -85.245833). It is situated at the intersection of U.S. Route 11 and Georgia State Route 136. The town is located in the foothills of the Appalachian Mountains, and is surrounded by the Lookout Mountain and Sand Mountain ranges. The town is situated on the banks of the Conasauga River, which flows through the town and is a popular destination for fishing and canoeing.
The town has a total area of 2.2 square miles, all of which is land. The town is located in a humid subtropical climate zone, with hot, humid summers and mild winters. The average annual temperature is 61°F, with an average high of 79°F in July and an average low of 43°F in January. The average annual precipitation is 51.2 inches, with an average of 4.7 inches of snowfall per year.
Economy
The economy of Milan is largely based on agriculture and manufacturing. The town is home to several large farms, which produce a variety of crops, including corn, soybeans, cotton, and tobacco. The town is also home to several manufacturing plants, which produce a variety of products, including furniture, textiles, and automotive parts.
The town is also home to several small businesses, including restaurants, retail stores, and service providers. The town is also home to several tourist attractions, including the Dade County Historical Museum, the Dade County Courthouse, and the Dade County Fairgrounds.
Demographics
As of the 2010 census, the town had a population of 1,845. The racial makeup of the town was 87.2% White, 8.7% African American, 0.3% Native American, 0.3% Asian, 0.1% Pacific Islander, 1.2% from other races, and 2.3% from two or more races. Hispanic or Latino of any race were 3.2% of the population.
The median income for a household in the town was $30,938, and the median income for a family was $37,813. The per capita income for the town was $15,945. About 17.2% of families and 20.2% of the population were below the poverty line, including 28.3% of those under age 18 and 15.2% of those age 65 or over.
Education
The town is served by the Dade County School District, which operates three elementary schools, one middle school, and one high school. The town is also home to the Dade County Technical College, which offers a variety of vocational and technical programs. The town is also home to the Dade County Public Library, which offers a variety of books, magazines, and other materials.
Common Questions
What is Per Capita Income in Milan?
Per Capita income in Milan is $18,044.
What is the Median Household income in Milan?
Median Household Income in Milan is $22,188.
What is Family Income Deficit in Milan?
Family Income Deficit in Milan is $10,665.
Families that are below poverty line in Milan earn $10,665 less on average than the poverty threshold level.
What is Inequality or Gini Index in Milan?
Inequality or Gini Index in Milan is 0.57.
What is the Total Population of Milan?
Total Population of Milan is 649.
What is the Total Male Population of Milan?
Total Male Population of Milan is 287.
What is the Total Female Population of Milan?
Total Female Population of Milan is 362.
What is the Ratio of Males per 100 Females in Milan?
There are 79.28 Males per 100 Females in Milan.
What is the Ratio of Females per 100 Males in Milan?
There are 126.13 Females per 100 Males in Milan.
What is the Median Population Age in Milan?
Median Population Age in Milan is 51.3 Years.
What is the Average Family Size in Milan
Average Family Size in Milan is 3.3 People.
What is the Average Household Size in Milan
Average Household Size in Milan is 2.2 People.
How Large is the Labor Force in Milan?
There are 213 People in the Labor Forcein in Milan.
What is the Percentage of People in the Labor Force in Milan?
37.8% of People are in the Labor Force in Milan.
What is the Unemployment Rate in Milan?
Unemployment Rate in Milan is 15.5%.