Montezuma, GA Map & Demographics
Montezuma Map
Montezuma Overview
$20,216
PER CAPITA INCOME
$57,500
AVG FAMILY INCOME
$46,315
AVG HOUSEHOLD INCOME
14.2%
WAGE / INCOME GAP [ % ]
85.8¢/ $1
WAGE / INCOME GAP [ $ ]
0.42
INEQUALITY / GINI INDEX
3,040
TOTAL POPULATION
1,469
MALE POPULATION
1,571
FEMALE POPULATION
93.51
MALES / 100 FEMALES
106.94
FEMALES / 100 MALES
43.2
MEDIAN AGE
3.3
AVG FAMILY SIZE
2.5
AVG HOUSEHOLD SIZE
1,244
LABOR FORCE [ PEOPLE ]
50.3%
PERCENT IN LABOR FORCE
6.4%
UNEMPLOYMENT RATE
Montezuma Zip Codes
Montezuma Area Codes
Income in Montezuma
Income Overview in Montezuma
Per Capita Income in Montezuma is $20,216, while median incomes of families and households are $57,500 and $46,315 respectively.
| Characteristic | Number | Measure |
| Per Capita Income | 3,040 | $20,216 |
| Median Family Income | 754 | $57,500 |
| Mean Family Income | 754 | $59,129 |
| Median Household Income | 1,185 | $46,315 |
| Mean Household Income | 1,185 | $48,482 |
| Income Deficit | 754 | $0 |
| Wage / Income Gap (%) | 3,040 | 14.24% |
| Wage / Income Gap ($) | 3,040 | 85.76¢ per $1 |
| Gini / Inequality Index | 3,040 | 0.42 |
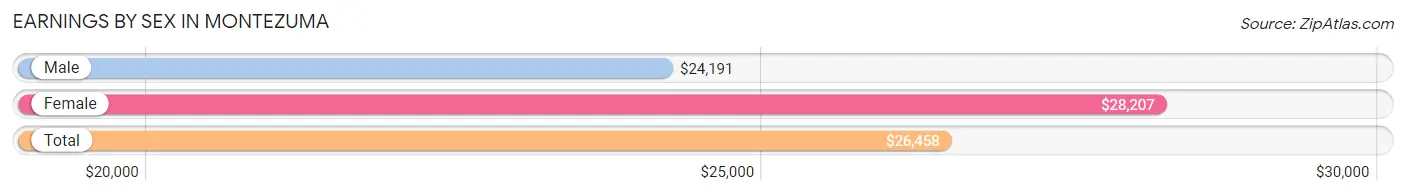
Earnings by Sex in Montezuma
Average Earnings in Montezuma are $26,458, $24,191 for men and $28,207 for women, a difference of 14.2%.
| Sex | Number | Average Earnings |
| Male | 647 (50.2%) | $24,191 |
| Female | 641 (49.8%) | $28,207 |
| Total | 1,288 (100.0%) | $26,458 |
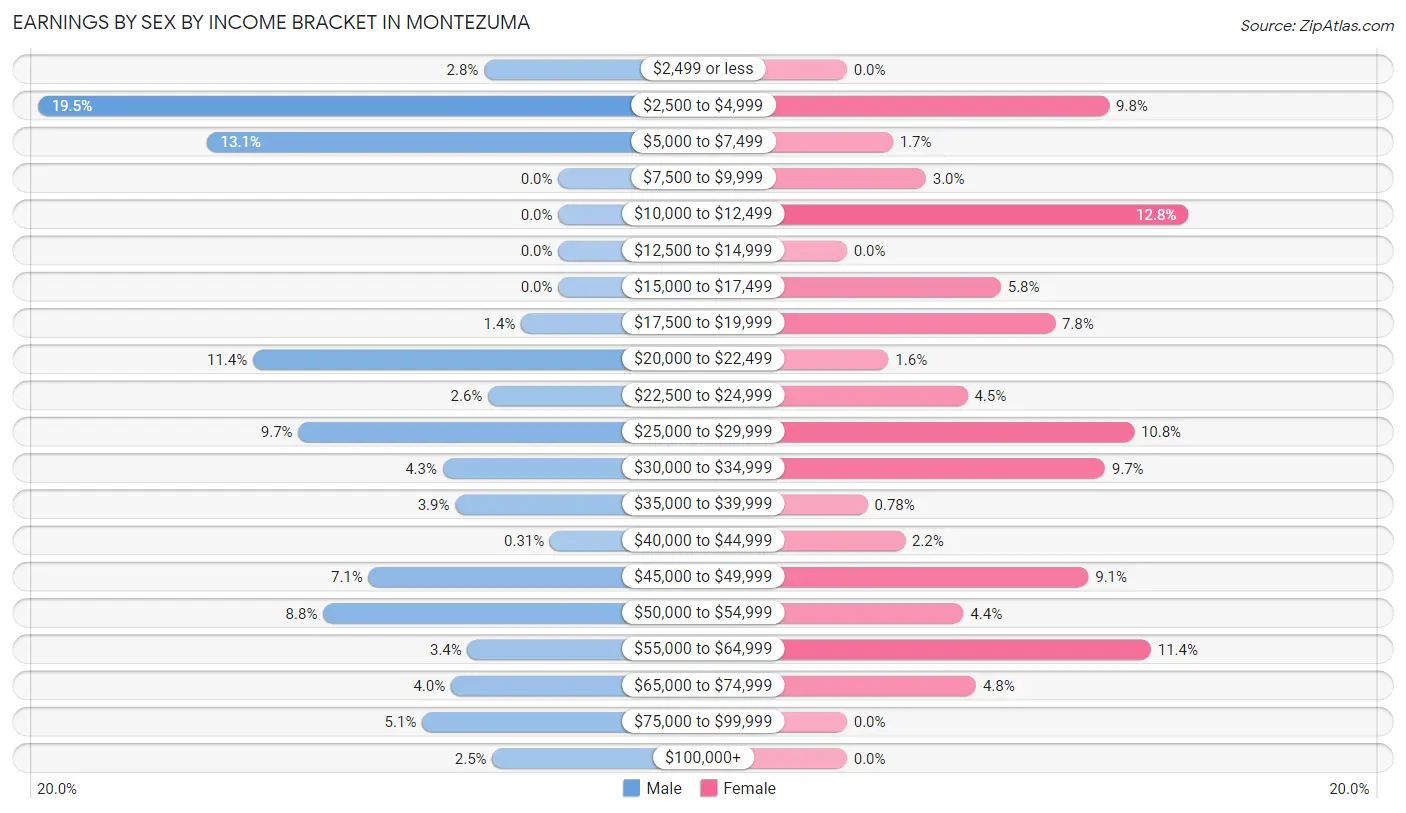
Earnings by Sex by Income Bracket in Montezuma
The most common earnings brackets in Montezuma are $2,500 to $4,999 for men (126 | 19.5%) and $10,000 to $12,499 for women (82 | 12.8%).
| Income | Male | Female |
| $2,499 or less | 18 (2.8%) | 0 (0.0%) |
| $2,500 to $4,999 | 126 (19.5%) | 63 (9.8%) |
| $5,000 to $7,499 | 85 (13.1%) | 11 (1.7%) |
| $7,500 to $9,999 | 0 (0.0%) | 19 (3.0%) |
| $10,000 to $12,499 | 0 (0.0%) | 82 (12.8%) |
| $12,500 to $14,999 | 0 (0.0%) | 0 (0.0%) |
| $15,000 to $17,499 | 0 (0.0%) | 37 (5.8%) |
| $17,500 to $19,999 | 9 (1.4%) | 50 (7.8%) |
| $20,000 to $22,499 | 74 (11.4%) | 10 (1.6%) |
| $22,500 to $24,999 | 17 (2.6%) | 29 (4.5%) |
| $25,000 to $29,999 | 63 (9.7%) | 69 (10.8%) |
| $30,000 to $34,999 | 28 (4.3%) | 62 (9.7%) |
| $35,000 to $39,999 | 25 (3.9%) | 5 (0.8%) |
| $40,000 to $44,999 | 2 (0.3%) | 14 (2.2%) |
| $45,000 to $49,999 | 46 (7.1%) | 58 (9.0%) |
| $50,000 to $54,999 | 57 (8.8%) | 28 (4.4%) |
| $55,000 to $64,999 | 22 (3.4%) | 73 (11.4%) |
| $65,000 to $74,999 | 26 (4.0%) | 31 (4.8%) |
| $75,000 to $99,999 | 33 (5.1%) | 0 (0.0%) |
| $100,000+ | 16 (2.5%) | 0 (0.0%) |
| Total | 647 (100.0%) | 641 (100.0%) |
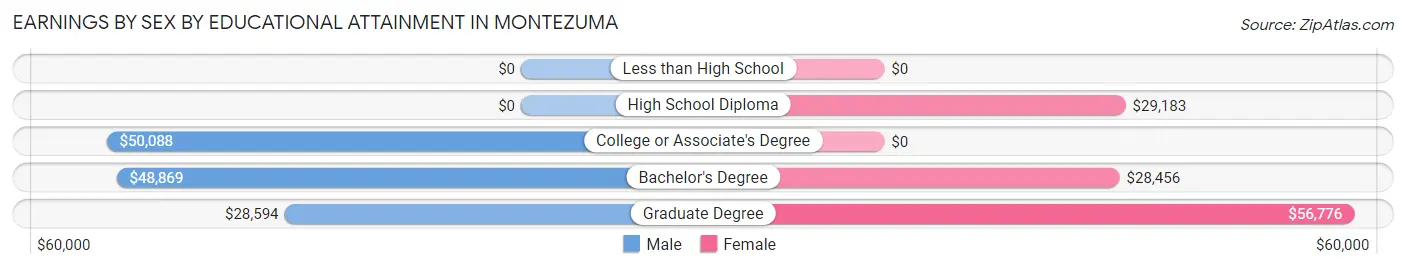
Earnings by Sex by Educational Attainment in Montezuma
Average earnings in Montezuma are $29,712 for men and $30,357 for women, a difference of 2.1%. Men with an educational attainment of college or associate's degree enjoy the highest average annual earnings of $50,088, while those with graduate degree education earn the least with $28,594. Women with an educational attainment of graduate degree earn the most with the average annual earnings of $56,776, while those with bachelor's degree education have the smallest earnings of $28,456.
| Educational Attainment | Male Income | Female Income |
| Less than High School | - | - |
| High School Diploma | - | - |
| College or Associate's Degree | $50,088 | $0 |
| Bachelor's Degree | $48,869 | $28,456 |
| Graduate Degree | $28,594 | $56,776 |
| Total | $29,712 | $30,357 |
Family Income in Montezuma
Family Income Brackets in Montezuma
According to the Montezuma family income data, there are 220 families falling into the $50,000 to $74,999 income range, which is the most common income bracket and makes up 29.2% of all families.
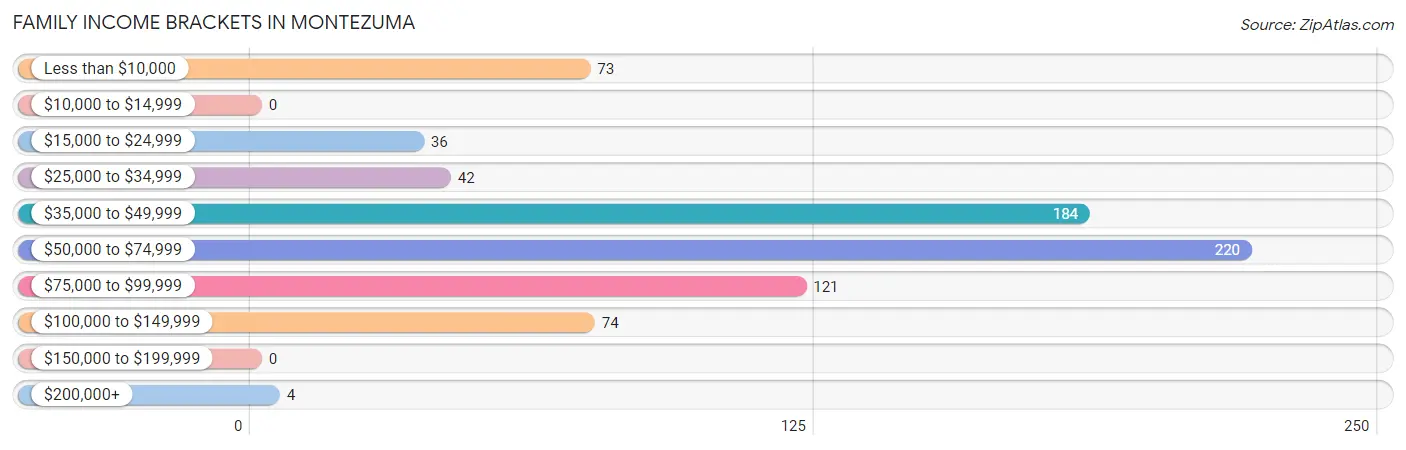
| Income Bracket | # Families | % Families |
| Less than $10,000 | 73 | 9.7% |
| $10,000 to $14,999 | 0 | 0.0% |
| $15,000 to $24,999 | 36 | 4.8% |
| $25,000 to $34,999 | 42 | 5.6% |
| $35,000 to $49,999 | 184 | 24.4% |
| $50,000 to $74,999 | 220 | 29.2% |
| $75,000 to $99,999 | 121 | 16.0% |
| $100,000 to $149,999 | 74 | 9.8% |
| $150,000 to $199,999 | 0 | 0.0% |
| $200,000+ | 4 | 0.5% |
Family Income by Famaliy Size in Montezuma
4-person families (106 | 14.1%) account for the highest median family income in Montezuma with $61,538 per family, while 2-person families (384 | 50.9%) have the highest median income of $24,812 per family member.
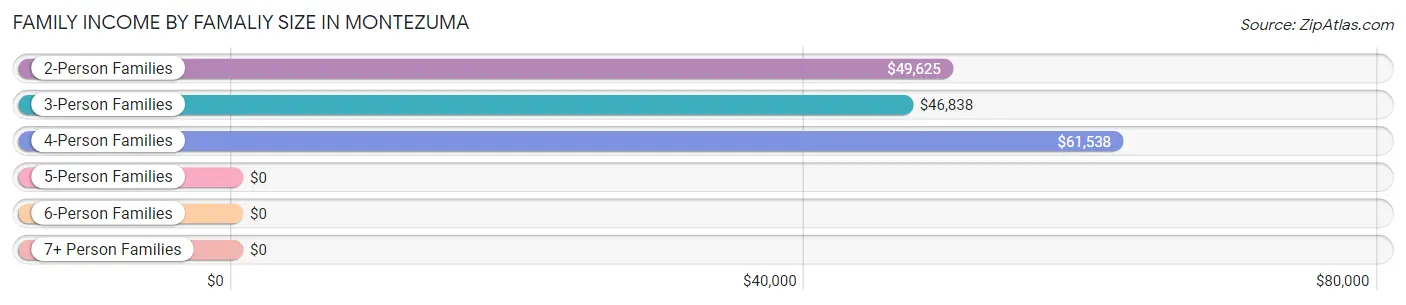
| Income Bracket | # Families | Median Income |
| 2-Person Families | 384 (50.9%) | $49,625 |
| 3-Person Families | 220 (29.2%) | $46,838 |
| 4-Person Families | 106 (14.1%) | $61,538 |
| 5-Person Families | 21 (2.8%) | $0 |
| 6-Person Families | 11 (1.5%) | $0 |
| 7+ Person Families | 12 (1.6%) | $0 |
| Total | 754 (100.0%) | $57,500 |
Family Income by Number of Earners in Montezuma
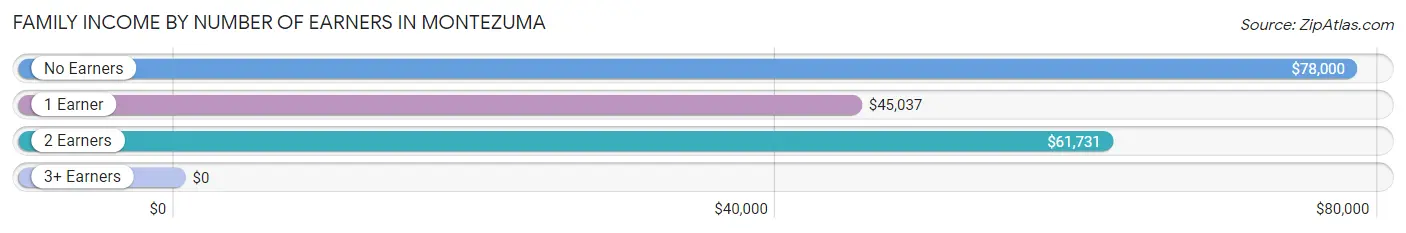
| Number of Earners | # Families | Median Income |
| No Earners | 110 (14.6%) | $78,000 |
| 1 Earner | 377 (50.0%) | $45,037 |
| 2 Earners | 228 (30.2%) | $61,731 |
| 3+ Earners | 39 (5.2%) | $0 |
| Total | 754 (100.0%) | $57,500 |
Household Income in Montezuma
Household Income Brackets in Montezuma
With 299 households falling in the category, the $50,000 to $74,999 income range is the most frequent in Montezuma, accounting for 25.2% of all households. In contrast, only 4 households (0.3%) fall into the $200,000+ income bracket, making it the least populous group.
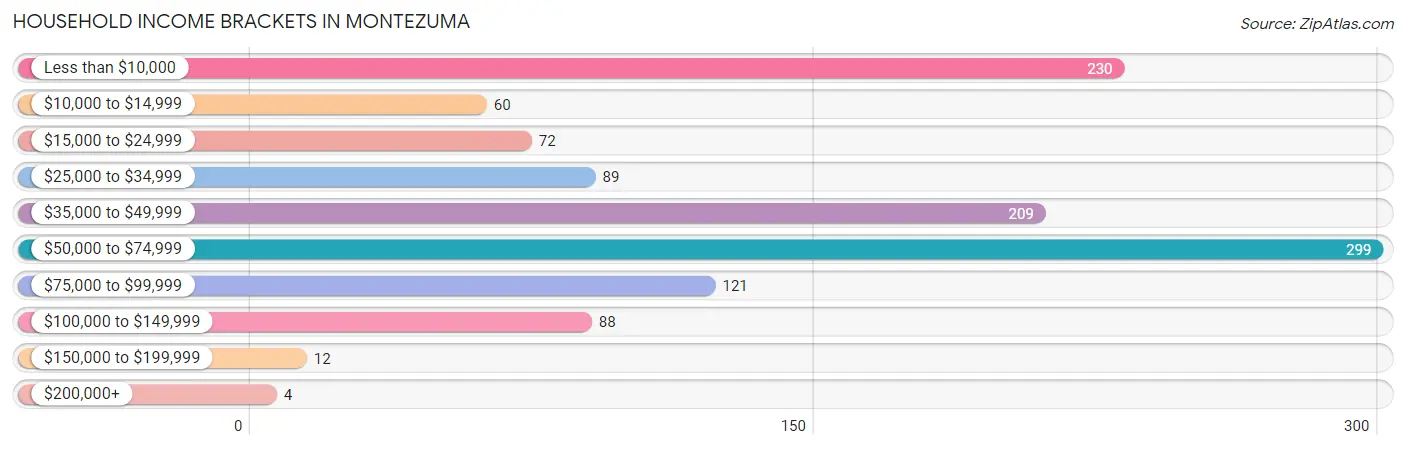
| Income Bracket | # Households | % Households |
| Less than $10,000 | 230 | 19.4% |
| $10,000 to $14,999 | 60 | 5.1% |
| $15,000 to $24,999 | 72 | 6.1% |
| $25,000 to $34,999 | 89 | 7.5% |
| $35,000 to $49,999 | 209 | 17.6% |
| $50,000 to $74,999 | 299 | 25.2% |
| $75,000 to $99,999 | 121 | 10.2% |
| $100,000 to $149,999 | 88 | 7.4% |
| $150,000 to $199,999 | 12 | 1.0% |
| $200,000+ | 4 | 0.3% |
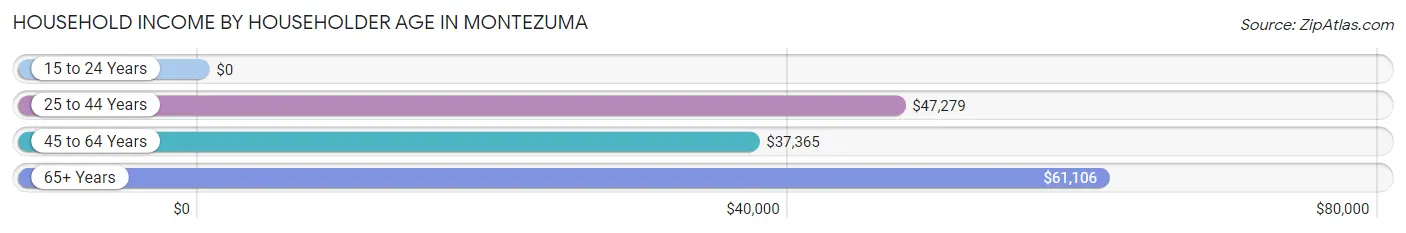
Household Income by Householder Age in Montezuma
The median household income in Montezuma is $46,315, with the highest median household income of $61,106 found in the 65+ years age bracket for the primary householder. A total of 308 households (26.0%) fall into this category. Meanwhile, the 15 to 24 years age bracket for the primary householder has the lowest median household income of $0, with 27 households (2.3%) in this group.
| Income Bracket | # Households | Median Income |
| 15 to 24 Years | 27 (2.3%) | $0 |
| 25 to 44 Years | 272 (23.0%) | $47,279 |
| 45 to 64 Years | 578 (48.8%) | $37,365 |
| 65+ Years | 308 (26.0%) | $61,106 |
| Total | 1,185 (100.0%) | $46,315 |
Poverty in Montezuma
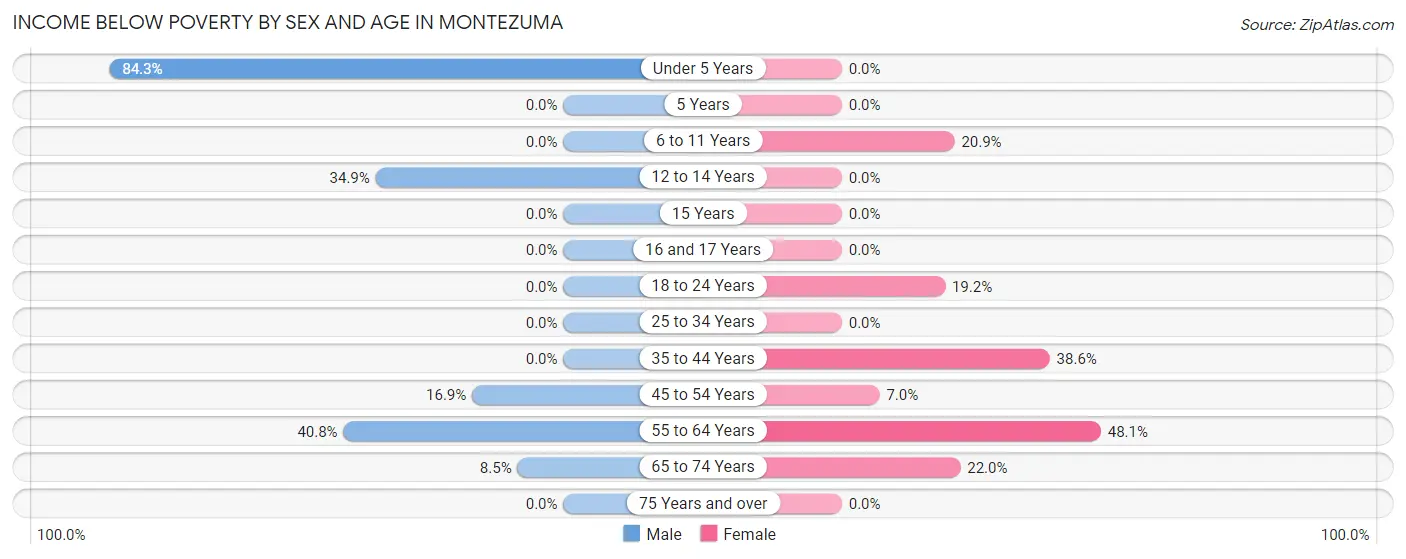
Income Below Poverty by Sex and Age in Montezuma
With 14.9% poverty level for males and 20.4% for females among the residents of Montezuma, under 5 year old males and 55 to 64 year old females are the most vulnerable to poverty, with 75 males (84.3%) and 138 females (48.1%) in their respective age groups living below the poverty level.
| Age Bracket | Male | Female |
| Under 5 Years | 75 (84.3%) | 0 (0.0%) |
| 5 Years | 0 (0.0%) | 0 (0.0%) |
| 6 to 11 Years | 0 (0.0%) | 23 (20.9%) |
| 12 to 14 Years | 23 (34.8%) | 0 (0.0%) |
| 15 Years | 0 (0.0%) | 0 (0.0%) |
| 16 and 17 Years | 0 (0.0%) | 0 (0.0%) |
| 18 to 24 Years | 0 (0.0%) | 27 (19.2%) |
| 25 to 34 Years | 0 (0.0%) | 0 (0.0%) |
| 35 to 44 Years | 0 (0.0%) | 49 (38.6%) |
| 45 to 54 Years | 42 (16.9%) | 18 (7.0%) |
| 55 to 64 Years | 60 (40.8%) | 138 (48.1%) |
| 65 to 74 Years | 16 (8.5%) | 55 (22.0%) |
| 75 Years and over | 0 (0.0%) | 0 (0.0%) |
| Total | 216 (14.9%) | 310 (20.4%) |
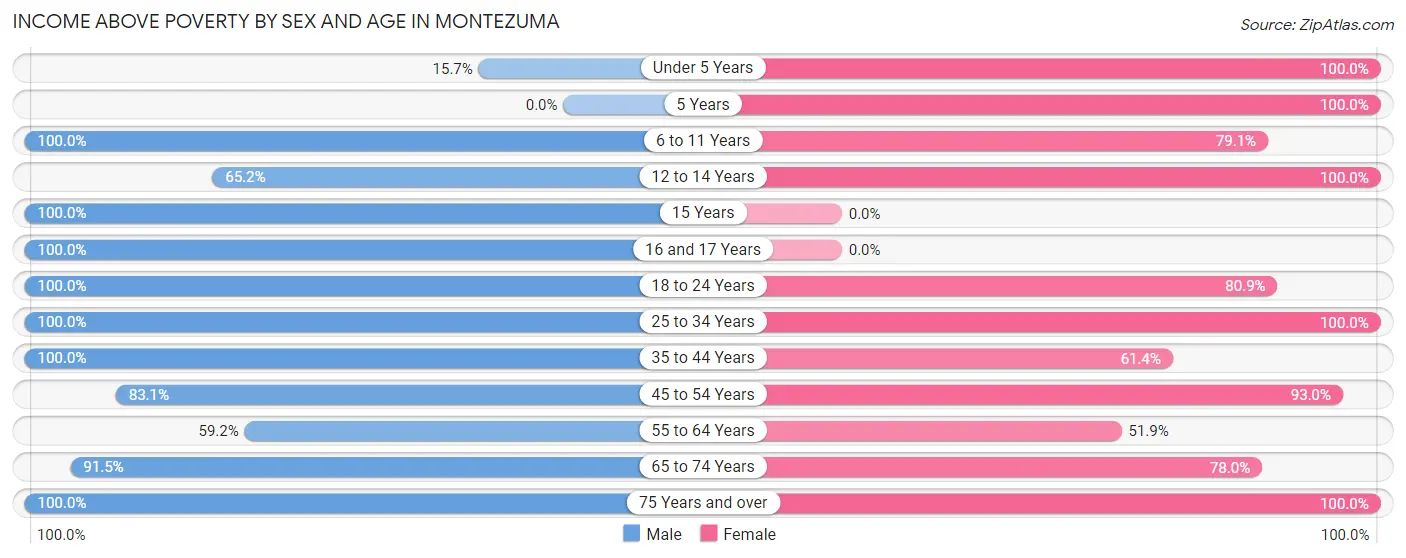
Income Above Poverty by Sex and Age in Montezuma
According to the poverty statistics in Montezuma, males aged 6 to 11 years and females aged under 5 years are the age groups that are most secure financially, with 100.0% of males and 100.0% of females in these age groups living above the poverty line.
| Age Bracket | Male | Female |
| Under 5 Years | 14 (15.7%) | 48 (100.0%) |
| 5 Years | 0 (0.0%) | 41 (100.0%) |
| 6 to 11 Years | 141 (100.0%) | 87 (79.1%) |
| 12 to 14 Years | 43 (65.1%) | 62 (100.0%) |
| 15 Years | 9 (100.0%) | 0 (0.0%) |
| 16 and 17 Years | 11 (100.0%) | 0 (0.0%) |
| 18 to 24 Years | 184 (100.0%) | 114 (80.8%) |
| 25 to 34 Years | 194 (100.0%) | 185 (100.0%) |
| 35 to 44 Years | 157 (100.0%) | 78 (61.4%) |
| 45 to 54 Years | 206 (83.1%) | 239 (93.0%) |
| 55 to 64 Years | 87 (59.2%) | 149 (51.9%) |
| 65 to 74 Years | 172 (91.5%) | 195 (78.0%) |
| 75 Years and over | 12 (100.0%) | 14 (100.0%) |
| Total | 1,230 (85.1%) | 1,212 (79.6%) |
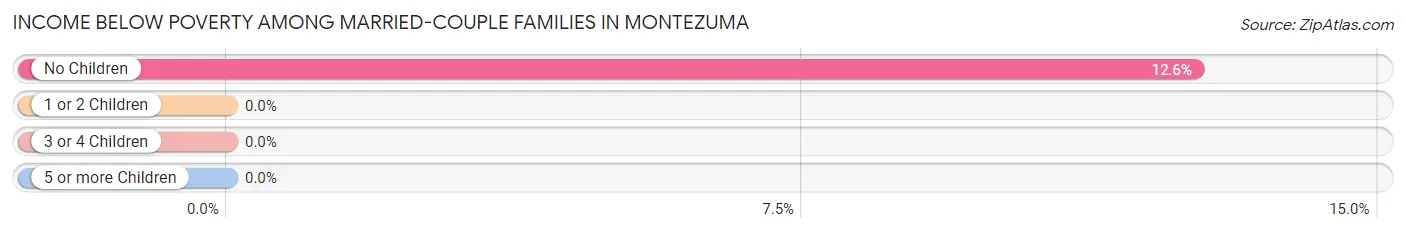
Income Below Poverty Among Married-Couple Families in Montezuma
The poverty statistics for married-couple families in Montezuma show that 8.2% or 29 of the total 352 families live below the poverty line. Families with no children have the highest poverty rate of 12.6%, comprising of 29 families. On the other hand, families with 1 or 2 children have the lowest poverty rate of 0.0%, which includes 0 families.
| Children | Above Poverty | Below Poverty |
| No Children | 201 (87.4%) | 29 (12.6%) |
| 1 or 2 Children | 110 (100.0%) | 0 (0.0%) |
| 3 or 4 Children | 0 (0.0%) | 0 (0.0%) |
| 5 or more Children | 12 (100.0%) | 0 (0.0%) |
| Total | 323 (91.8%) | 29 (8.2%) |
Income Below Poverty Among Single-Parent Households in Montezuma
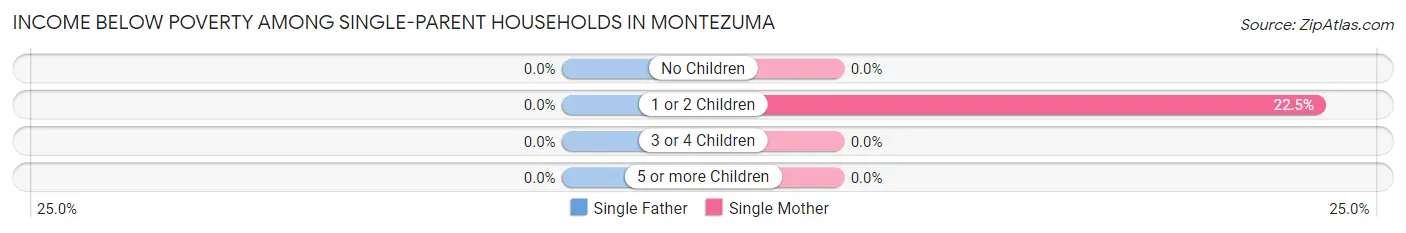
| Children | Single Father | Single Mother |
| No Children | 0 (0.0%) | 0 (0.0%) |
| 1 or 2 Children | 0 (0.0%) | 44 (22.5%) |
| 3 or 4 Children | 0 (0.0%) | 0 (0.0%) |
| 5 or more Children | 0 (0.0%) | 0 (0.0%) |
| Total | 0 (0.0%) | 44 (14.3%) |
Income Below Poverty Among Married-Couple vs Single-Parent Households in Montezuma
The poverty data for Montezuma shows that 29 of the married-couple family households (8.2%) and 44 of the single-parent households (11.0%) are living below the poverty level. Within the married-couple family households, those with no children have the highest poverty rate, with 29 households (12.6%) falling below the poverty line. Among the single-parent households, those with 1 or 2 children have the highest poverty rate, with 44 household (22.5%) living below poverty.
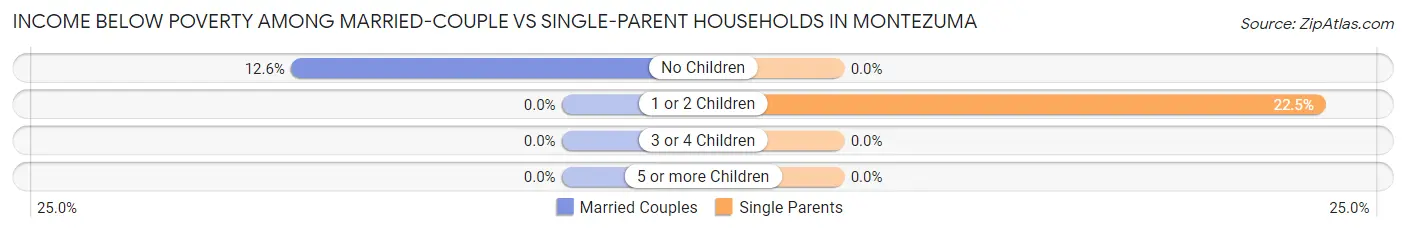
| Children | Married-Couple Families | Single-Parent Households |
| No Children | 29 (12.6%) | 0 (0.0%) |
| 1 or 2 Children | 0 (0.0%) | 44 (22.5%) |
| 3 or 4 Children | 0 (0.0%) | 0 (0.0%) |
| 5 or more Children | 0 (0.0%) | 0 (0.0%) |
| Total | 29 (8.2%) | 44 (11.0%) |
Race in Montezuma
The most populous races in Montezuma are Black / African American (2,341 | 77.0%), White / Caucasian (574 | 18.9%), and Asian (95 | 3.1%).
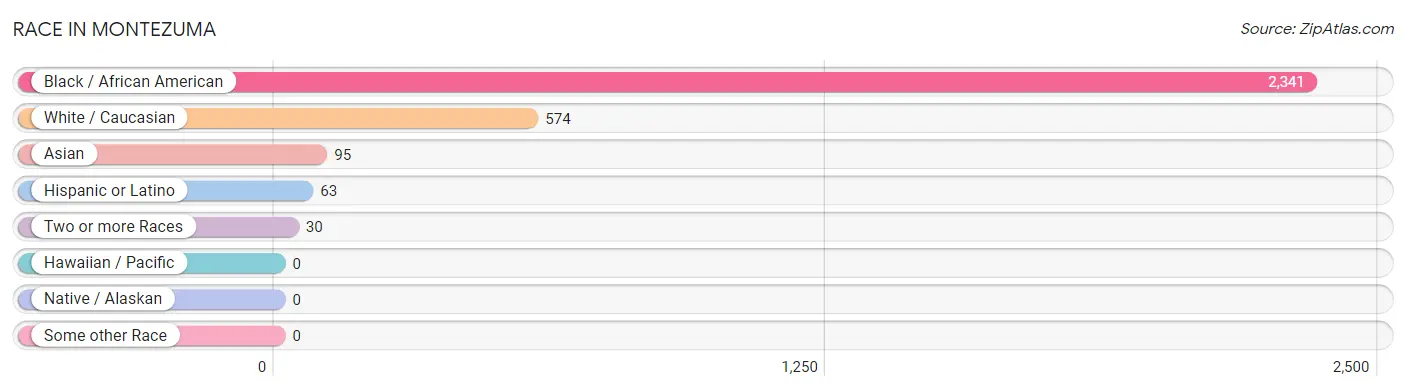
| Race | # Population | % Population |
| Asian | 95 | 3.1% |
| Black / African American | 2,341 | 77.0% |
| Hawaiian / Pacific | 0 | 0.0% |
| Hispanic or Latino | 63 | 2.1% |
| Native / Alaskan | 0 | 0.0% |
| White / Caucasian | 574 | 18.9% |
| Two or more Races | 30 | 1.0% |
| Some other Race | 0 | 0.0% |
| Total | 3,040 | 100.0% |
Ancestry in Montezuma
The most populous ancestries reported in Montezuma are English (162 | 5.3%), Thai (95 | 3.1%), American (68 | 2.2%), Mexican (45 | 1.5%), and German (34 | 1.1%), together accounting for 13.3% of all Montezuma residents.
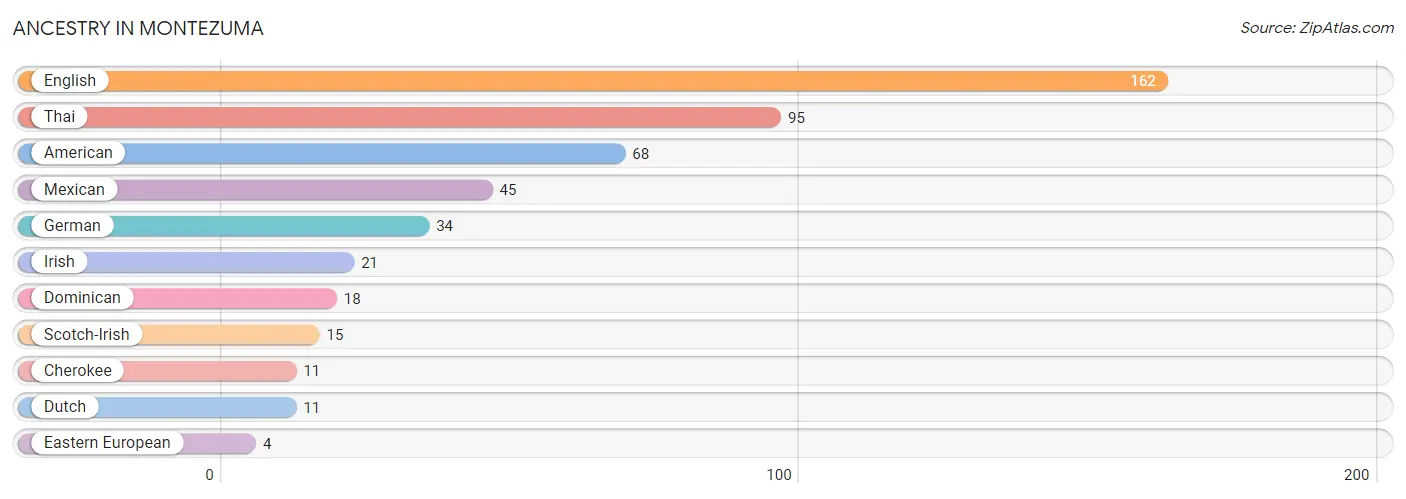
| Ancestry | # Population | % Population |
| American | 68 | 2.2% |
| Cherokee | 11 | 0.4% |
| Dominican | 18 | 0.6% |
| Dutch | 11 | 0.4% |
| Eastern European | 4 | 0.1% |
| English | 162 | 5.3% |
| German | 34 | 1.1% |
| Irish | 21 | 0.7% |
| Mexican | 45 | 1.5% |
| Scotch-Irish | 15 | 0.5% |
| Thai | 95 | 3.1% | View All 11 Rows |
Immigrants in Montezuma
The most numerous immigrant groups reported in Montezuma came from Asia (78 | 2.6%), India (78 | 2.6%), South Central Asia (78 | 2.6%), Caribbean (18 | 0.6%), and Dominican Republic (18 | 0.6%), together accounting for 8.9% of all Montezuma residents.
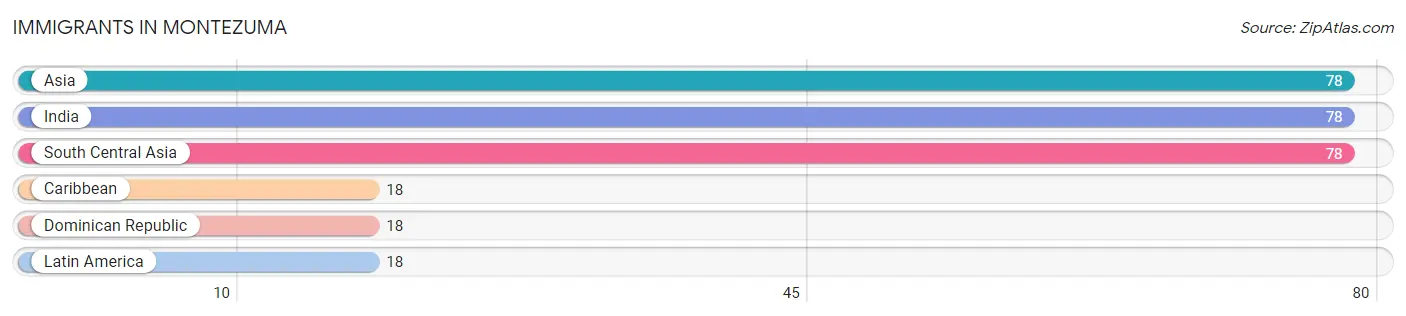
| Immigration Origin | # Population | % Population |
| Asia | 78 | 2.6% |
| Caribbean | 18 | 0.6% |
| Dominican Republic | 18 | 0.6% |
| India | 78 | 2.6% |
| Latin America | 18 | 0.6% |
| South Central Asia | 78 | 2.6% | View All 6 Rows |
Sex and Age in Montezuma
Sex and Age in Montezuma
The most populous age groups in Montezuma are 20 to 24 Years (175 | 11.9%) for men and 65 to 69 Years (170 | 10.8%) for women.
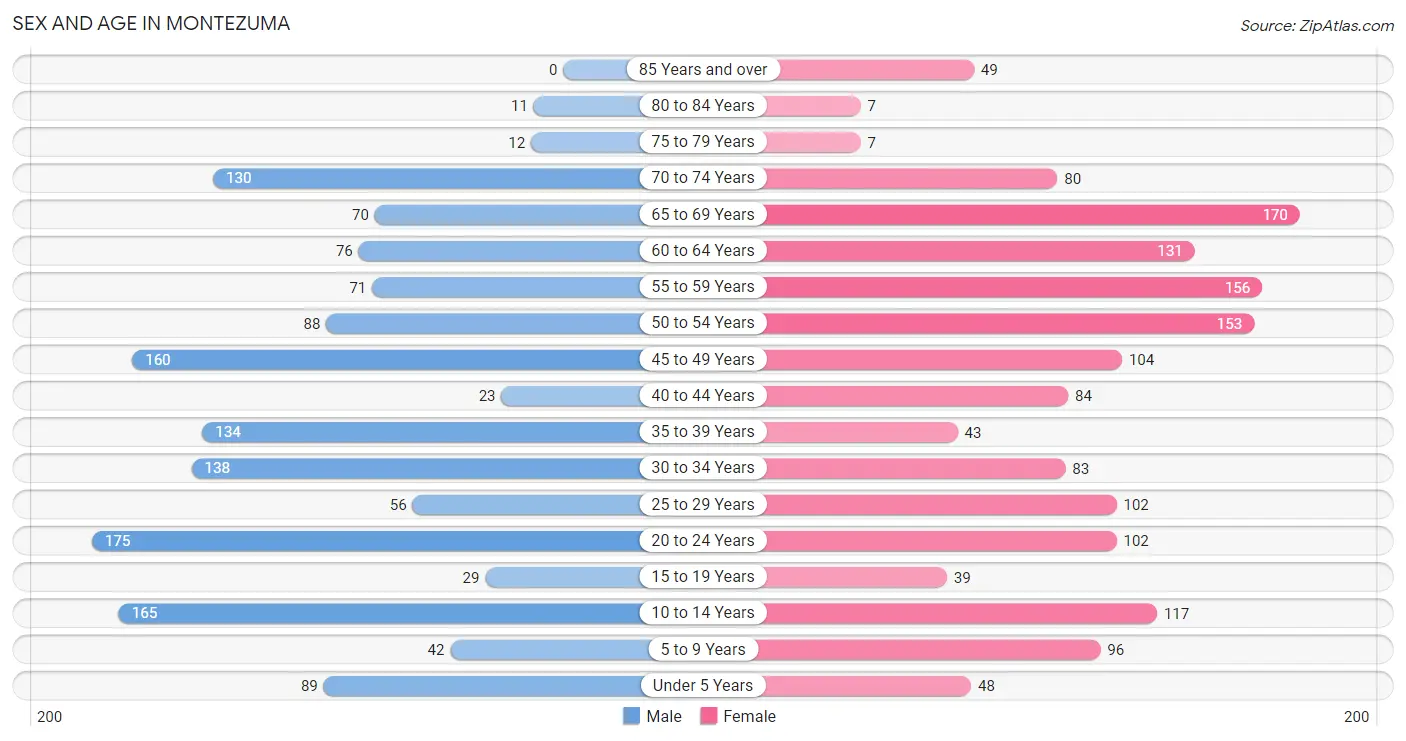
| Age Bracket | Male | Female |
| Under 5 Years | 89 (6.1%) | 48 (3.1%) |
| 5 to 9 Years | 42 (2.9%) | 96 (6.1%) |
| 10 to 14 Years | 165 (11.2%) | 117 (7.4%) |
| 15 to 19 Years | 29 (2.0%) | 39 (2.5%) |
| 20 to 24 Years | 175 (11.9%) | 102 (6.5%) |
| 25 to 29 Years | 56 (3.8%) | 102 (6.5%) |
| 30 to 34 Years | 138 (9.4%) | 83 (5.3%) |
| 35 to 39 Years | 134 (9.1%) | 43 (2.7%) |
| 40 to 44 Years | 23 (1.6%) | 84 (5.3%) |
| 45 to 49 Years | 160 (10.9%) | 104 (6.6%) |
| 50 to 54 Years | 88 (6.0%) | 153 (9.7%) |
| 55 to 59 Years | 71 (4.8%) | 156 (9.9%) |
| 60 to 64 Years | 76 (5.2%) | 131 (8.3%) |
| 65 to 69 Years | 70 (4.8%) | 170 (10.8%) |
| 70 to 74 Years | 130 (8.8%) | 80 (5.1%) |
| 75 to 79 Years | 12 (0.8%) | 7 (0.4%) |
| 80 to 84 Years | 11 (0.7%) | 7 (0.4%) |
| 85 Years and over | 0 (0.0%) | 49 (3.1%) |
| Total | 1,469 (100.0%) | 1,571 (100.0%) |
Families and Households in Montezuma
Median Family Size in Montezuma
The median family size in Montezuma is 3.28 persons per family, with single female/mother families (308 | 40.8%) accounting for the largest median family size of 3.82 persons per family. On the other hand, married-couple families (352 | 46.7%) represent the smallest median family size with 2.86 persons per family.
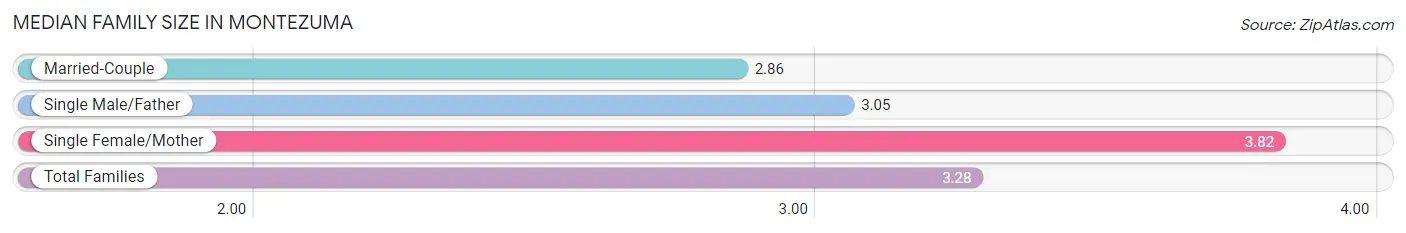
| Family Type | # Families | Family Size |
| Married-Couple | 352 (46.7%) | 2.86 |
| Single Male/Father | 94 (12.5%) | 3.05 |
| Single Female/Mother | 308 (40.8%) | 3.82 |
| Total Families | 754 (100.0%) | 3.28 |
Median Household Size in Montezuma
The median household size in Montezuma is 2.50 persons per household, with single female/mother households (308 | 26.0%) accounting for the largest median household size of 3.82 persons per household. non-family households (431 | 36.4%) represent the smallest median household size with 1.16 persons per household.
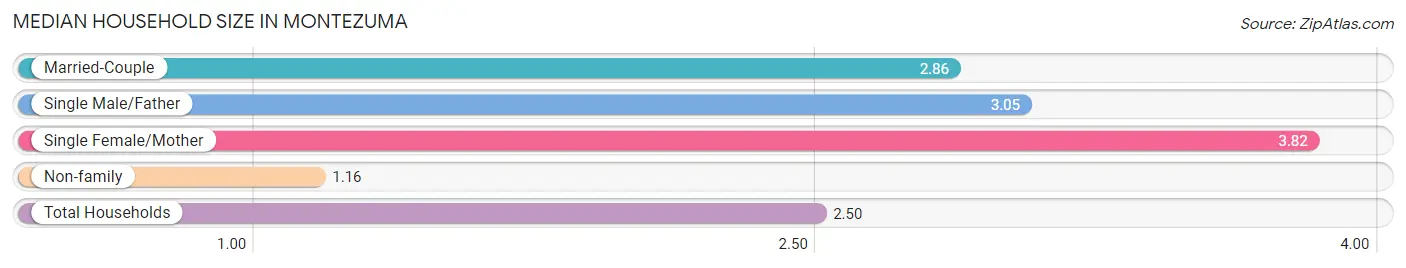
| Household Type | # Households | Household Size |
| Married-Couple | 352 (29.7%) | 2.86 |
| Single Male/Father | 94 (7.9%) | 3.05 |
| Single Female/Mother | 308 (26.0%) | 3.82 |
| Non-family | 431 (36.4%) | 1.16 |
| Total Households | 1,185 (100.0%) | 2.50 |
Household Size by Marriage Status in Montezuma
Out of a total of 1,185 households in Montezuma, 754 (63.6%) are family households, while 431 (36.4%) are nonfamily households. The most numerous type of family households are 2-person households, comprising 384, and the most common type of nonfamily households are 1-person households, comprising 354.
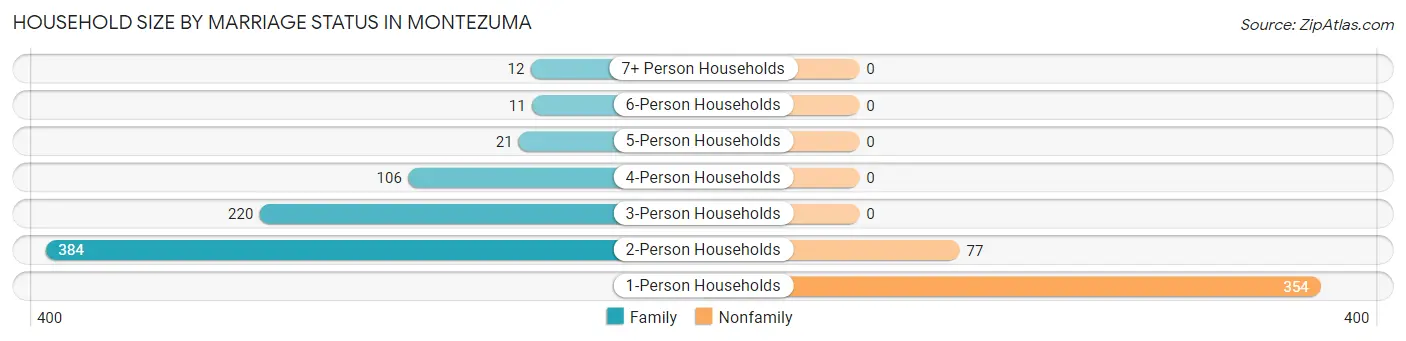
| Household Size | Family Households | Nonfamily Households |
| 1-Person Households | - | 354 (29.9%) |
| 2-Person Households | 384 (32.4%) | 77 (6.5%) |
| 3-Person Households | 220 (18.6%) | 0 (0.0%) |
| 4-Person Households | 106 (8.9%) | 0 (0.0%) |
| 5-Person Households | 21 (1.8%) | 0 (0.0%) |
| 6-Person Households | 11 (0.9%) | 0 (0.0%) |
| 7+ Person Households | 12 (1.0%) | 0 (0.0%) |
| Total | 754 (63.6%) | 431 (36.4%) |
Female Fertility in Montezuma
Fertility by Age in Montezuma
| Age Bracket | Women with Births | Births / 1,000 Women |
| 15 to 19 years | 0 (0.0%) | 0.0 |
| 20 to 34 years | 0 (0.0%) | 0.0 |
| 35 to 50 years | 0 (0.0%) | 0.0 |
| Total | 0 (0.0%) | 0.0 |
Fertility by Age by Marriage Status in Montezuma
| Age Bracket | Married | Unmarried |
| 15 to 19 years | 0 (0.0%) | 0 (0.0%) |
| 20 to 34 years | 0 (0.0%) | 0 (0.0%) |
| 35 to 50 years | 0 (0.0%) | 0 (0.0%) |
| Total | 0 (0.0%) | 0 (0.0%) |
Fertility by Education in Montezuma
| Educational Attainment | Women with Births | Births / 1,000 Women |
| Less than High School | 0 (0.0%) | 0.0 |
| High School Diploma | 0 (0.0%) | 0.0 |
| College or Associate's Degree | 0 (0.0%) | 0.0 |
| Bachelor's Degree | 0 (0.0%) | 0.0 |
| Graduate Degree | 0 (0.0%) | 0.0 |
| Total | 0 (0.0%) | 0.0 |
Fertility by Education by Marriage Status in Montezuma
| Educational Attainment | Married | Unmarried |
| Less than High School | 0 (0.0%) | 0 (0.0%) |
| High School Diploma | 0 (0.0%) | 0 (0.0%) |
| College or Associate's Degree | 0 (0.0%) | 0 (0.0%) |
| Bachelor's Degree | 0 (0.0%) | 0 (0.0%) |
| Graduate Degree | 0 (0.0%) | 0 (0.0%) |
| Total | 0 (0.0%) | 0 (0.0%) |
Employment Characteristics in Montezuma
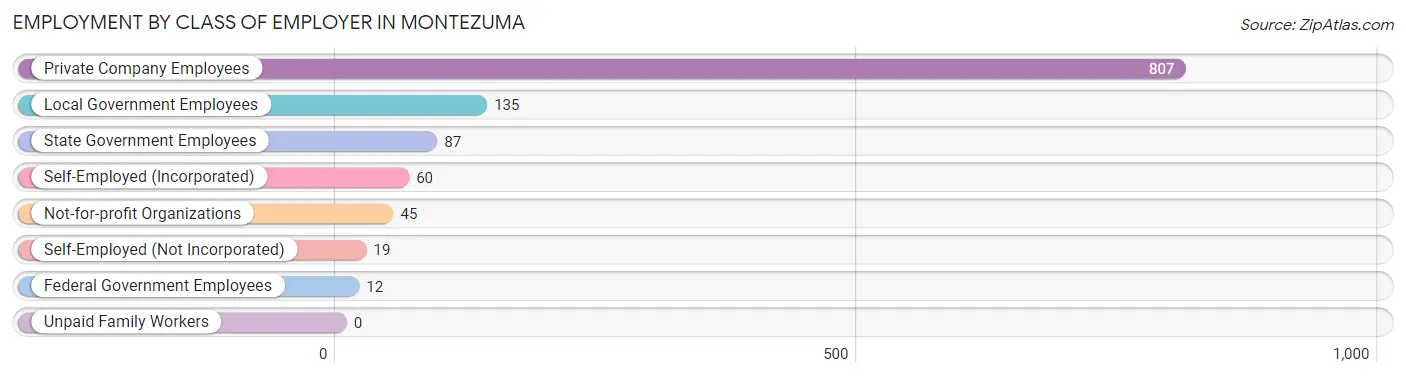
Employment by Class of Employer in Montezuma
Among the 1,165 employed individuals in Montezuma, private company employees (807 | 69.3%), local government employees (135 | 11.6%), and state government employees (87 | 7.5%) make up the most common classes of employment.
| Employer Class | # Employees | % Employees |
| Private Company Employees | 807 | 69.3% |
| Self-Employed (Incorporated) | 60 | 5.1% |
| Self-Employed (Not Incorporated) | 19 | 1.6% |
| Not-for-profit Organizations | 45 | 3.9% |
| Local Government Employees | 135 | 11.6% |
| State Government Employees | 87 | 7.5% |
| Federal Government Employees | 12 | 1.0% |
| Unpaid Family Workers | 0 | 0.0% |
| Total | 1,165 | 100.0% |
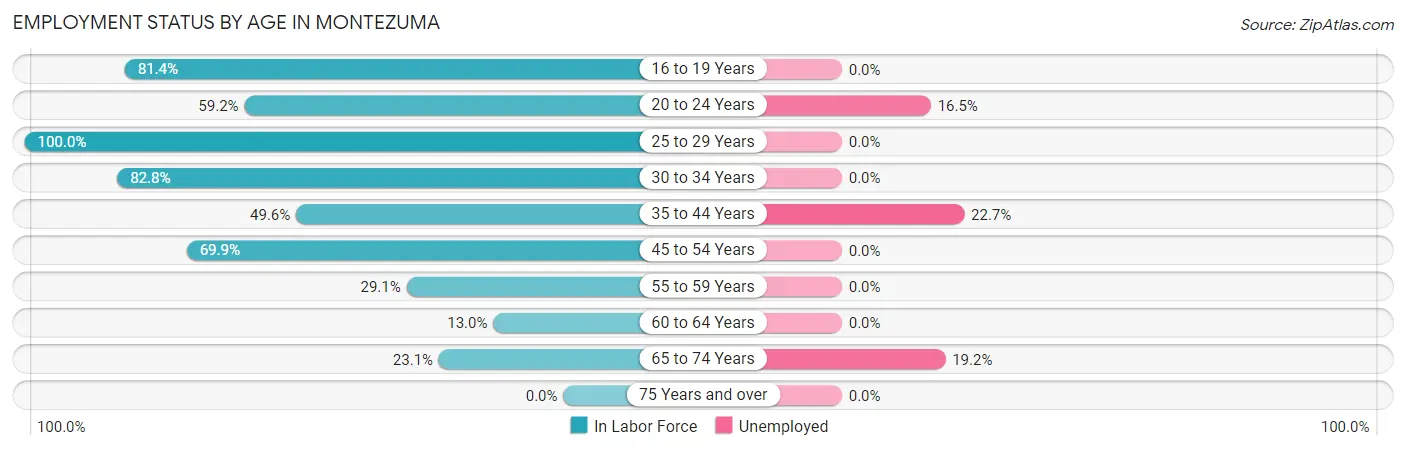
Employment Status by Age in Montezuma
According to the labor force statistics for Montezuma, out of the total population over 16 years of age (2,474), 50.3% or 1,244 individuals are in the labor force, with 6.4% or 80 of them unemployed. The age group with the highest labor force participation rate is 25 to 29 years, with 100.0% or 158 individuals in the labor force. Within the labor force, the 35 to 44 years age range has the highest percentage of unemployed individuals, with 22.7% or 32 of them being unemployed.
| Age Bracket | In Labor Force | Unemployed |
| 16 to 19 Years | 48 (81.4%) | 0 (0.0%) |
| 20 to 24 Years | 164 (59.2%) | 27 (16.5%) |
| 25 to 29 Years | 158 (100.0%) | 0 (0.0%) |
| 30 to 34 Years | 183 (82.8%) | 0 (0.0%) |
| 35 to 44 Years | 141 (49.6%) | 32 (22.7%) |
| 45 to 54 Years | 353 (69.9%) | 0 (0.0%) |
| 55 to 59 Years | 66 (29.1%) | 0 (0.0%) |
| 60 to 64 Years | 27 (13.0%) | 0 (0.0%) |
| 65 to 74 Years | 104 (23.1%) | 20 (19.2%) |
| 75 Years and over | 0 (0.0%) | 0 (0.0%) |
| Total | 1,244 (50.3%) | 80 (6.4%) |
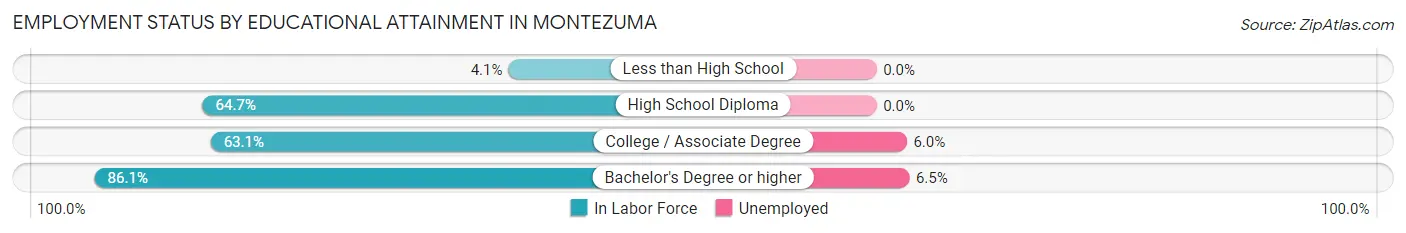
Employment Status by Educational Attainment in Montezuma
According to labor force statistics for Montezuma, 57.9% of individuals (928) out of the total population between 25 and 64 years of age (1,602) are in the labor force, with 3.4% or 32 of them being unemployed. The group with the highest labor force participation rate are those with the educational attainment of bachelor's degree or higher, with 86.1% or 186 individuals in the labor force. Within the labor force, individuals with bachelor's degree or higher education have the highest percentage of unemployment, with 6.5% or 12 of them being unemployed.
| Educational Attainment | In Labor Force | Unemployed |
| Less than High School | 10 (4.1%) | 0 (0.0%) |
| High School Diploma | 400 (64.7%) | 0 (0.0%) |
| College / Associate Degree | 332 (63.1%) | 32 (6.0%) |
| Bachelor's Degree or higher | 186 (86.1%) | 14 (6.5%) |
| Total | 928 (57.9%) | 54 (3.4%) |
Employment Occupations by Sex in Montezuma
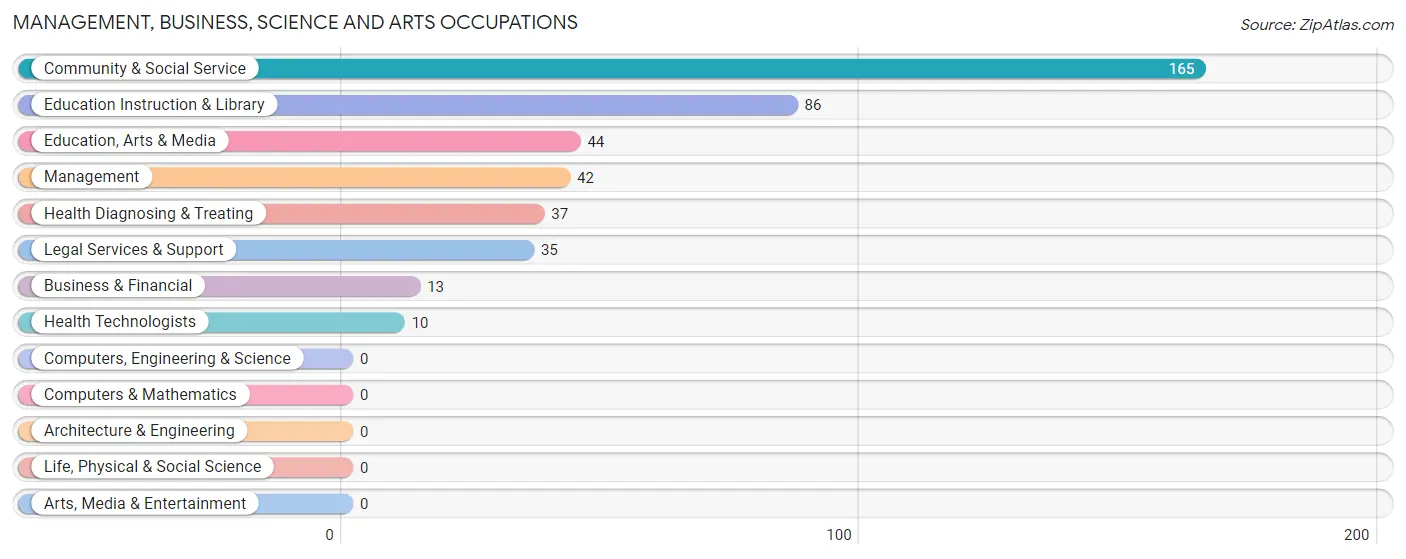
Management, Business, Science and Arts Occupations
The most common Management, Business, Science and Arts occupations in Montezuma are Community & Social Service (165 | 14.2%), Education Instruction & Library (86 | 7.4%), Education, Arts & Media (44 | 3.8%), Management (42 | 3.6%), and Health Diagnosing & Treating (37 | 3.2%).
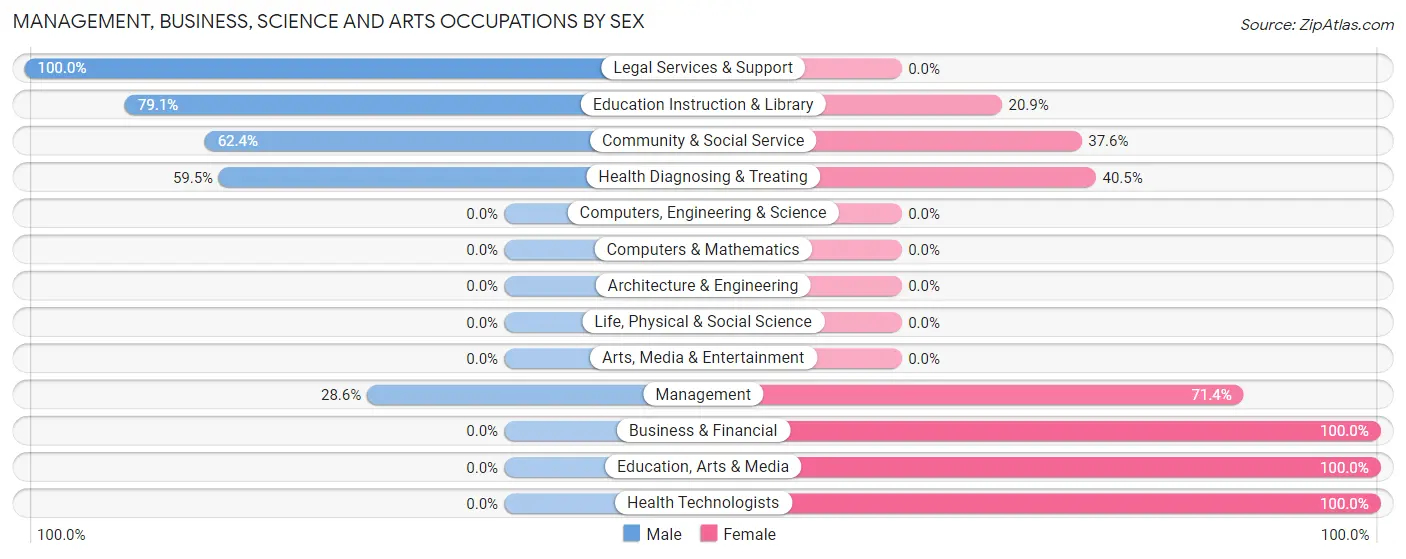
Management, Business, Science and Arts Occupations by Sex
Within the Management, Business, Science and Arts occupations in Montezuma, the most male-oriented occupations are Legal Services & Support (100.0%), Education Instruction & Library (79.1%), and Community & Social Service (62.4%), while the most female-oriented occupations are Business & Financial (100.0%), Education, Arts & Media (100.0%), and Health Technologists (100.0%).
| Occupation | Male | Female |
| Management | 12 (28.6%) | 30 (71.4%) |
| Business & Financial | 0 (0.0%) | 13 (100.0%) |
| Computers, Engineering & Science | 0 (0.0%) | 0 (0.0%) |
| Computers & Mathematics | 0 (0.0%) | 0 (0.0%) |
| Architecture & Engineering | 0 (0.0%) | 0 (0.0%) |
| Life, Physical & Social Science | 0 (0.0%) | 0 (0.0%) |
| Community & Social Service | 103 (62.4%) | 62 (37.6%) |
| Education, Arts & Media | 0 (0.0%) | 44 (100.0%) |
| Legal Services & Support | 35 (100.0%) | 0 (0.0%) |
| Education Instruction & Library | 68 (79.1%) | 18 (20.9%) |
| Arts, Media & Entertainment | 0 (0.0%) | 0 (0.0%) |
| Health Diagnosing & Treating | 22 (59.5%) | 15 (40.5%) |
| Health Technologists | 0 (0.0%) | 10 (100.0%) |
| Total (Category) | 137 (53.3%) | 120 (46.7%) |
| Total (Overall) | 577 (49.5%) | 588 (50.5%) |
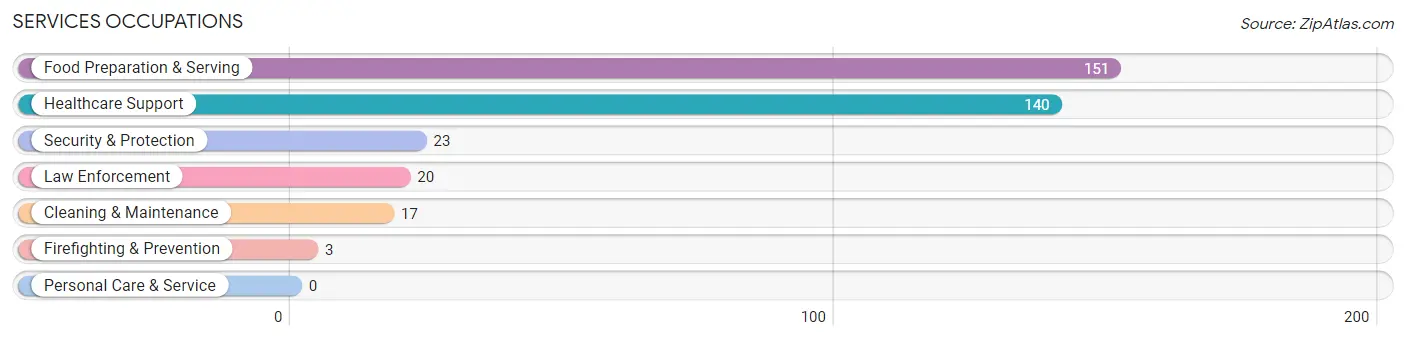
Services Occupations
The most common Services occupations in Montezuma are Food Preparation & Serving (151 | 13.0%), Healthcare Support (140 | 12.0%), Security & Protection (23 | 2.0%), Law Enforcement (20 | 1.7%), and Cleaning & Maintenance (17 | 1.5%).
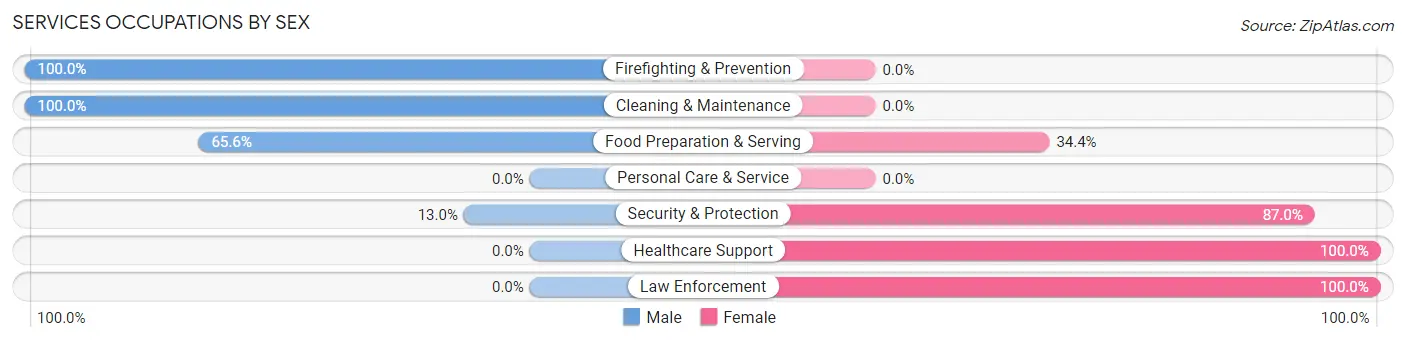
Services Occupations by Sex
Within the Services occupations in Montezuma, the most male-oriented occupations are Firefighting & Prevention (100.0%), Cleaning & Maintenance (100.0%), and Food Preparation & Serving (65.6%), while the most female-oriented occupations are Healthcare Support (100.0%), Law Enforcement (100.0%), and Security & Protection (87.0%).
| Occupation | Male | Female |
| Healthcare Support | 0 (0.0%) | 140 (100.0%) |
| Security & Protection | 3 (13.0%) | 20 (87.0%) |
| Firefighting & Prevention | 3 (100.0%) | 0 (0.0%) |
| Law Enforcement | 0 (0.0%) | 20 (100.0%) |
| Food Preparation & Serving | 99 (65.6%) | 52 (34.4%) |
| Cleaning & Maintenance | 17 (100.0%) | 0 (0.0%) |
| Personal Care & Service | 0 (0.0%) | 0 (0.0%) |
| Total (Category) | 119 (35.9%) | 212 (64.0%) |
| Total (Overall) | 577 (49.5%) | 588 (50.5%) |
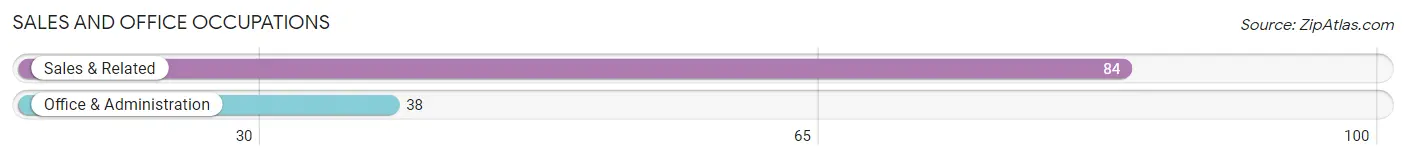
Sales and Office Occupations
The most common Sales and Office occupations in Montezuma are Sales & Related (84 | 7.2%), and Office & Administration (38 | 3.3%).
Sales and Office Occupations by Sex
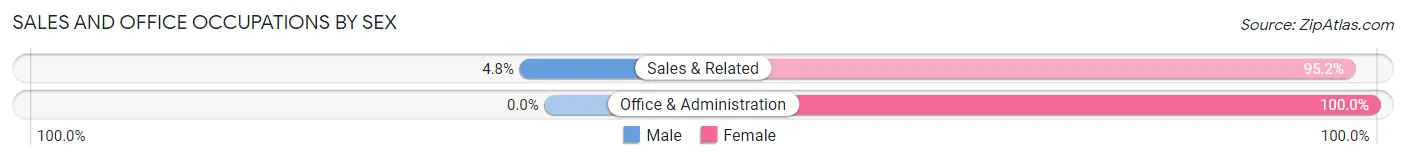
| Occupation | Male | Female |
| Sales & Related | 4 (4.8%) | 80 (95.2%) |
| Office & Administration | 0 (0.0%) | 38 (100.0%) |
| Total (Category) | 4 (3.3%) | 118 (96.7%) |
| Total (Overall) | 577 (49.5%) | 588 (50.5%) |
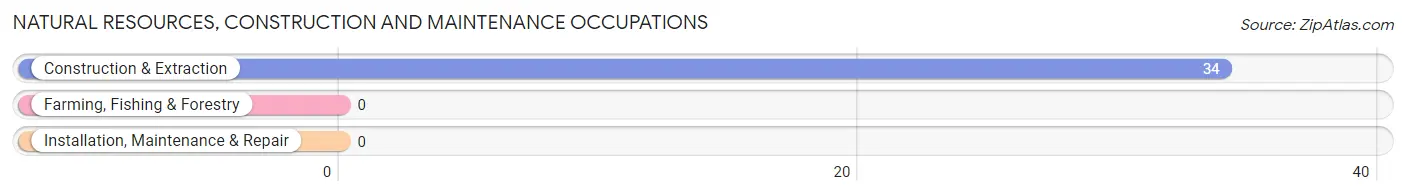
Natural Resources, Construction and Maintenance Occupations
The most common Natural Resources, Construction and Maintenance occupations in Montezuma are , and Construction & Extraction (34 | 2.9%).
Natural Resources, Construction and Maintenance Occupations by Sex
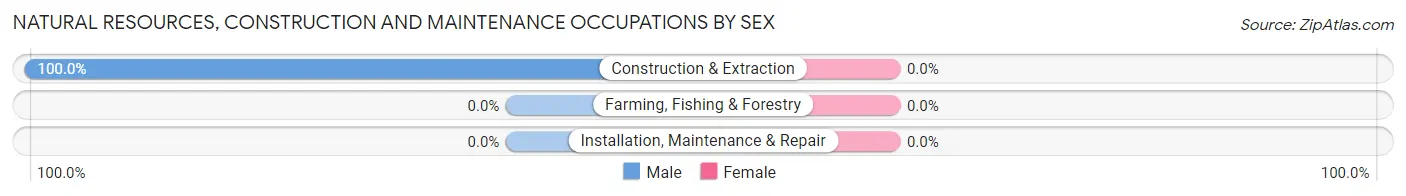
| Occupation | Male | Female |
| Farming, Fishing & Forestry | 0 (0.0%) | 0 (0.0%) |
| Construction & Extraction | 34 (100.0%) | 0 (0.0%) |
| Installation, Maintenance & Repair | 0 (0.0%) | 0 (0.0%) |
| Total (Category) | 34 (100.0%) | 0 (0.0%) |
| Total (Overall) | 577 (49.5%) | 588 (50.5%) |
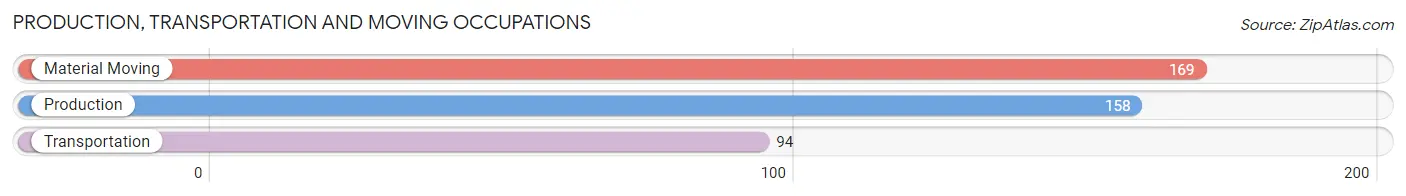
Production, Transportation and Moving Occupations
The most common Production, Transportation and Moving occupations in Montezuma are Material Moving (169 | 14.5%), Production (158 | 13.6%), and Transportation (94 | 8.1%).
Production, Transportation and Moving Occupations by Sex
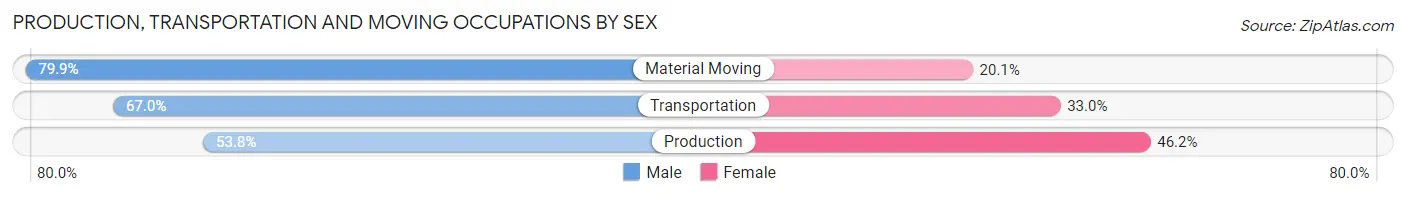
| Occupation | Male | Female |
| Production | 85 (53.8%) | 73 (46.2%) |
| Transportation | 63 (67.0%) | 31 (33.0%) |
| Material Moving | 135 (79.9%) | 34 (20.1%) |
| Total (Category) | 283 (67.2%) | 138 (32.8%) |
| Total (Overall) | 577 (49.5%) | 588 (50.5%) |
Employment Industries by Sex in Montezuma
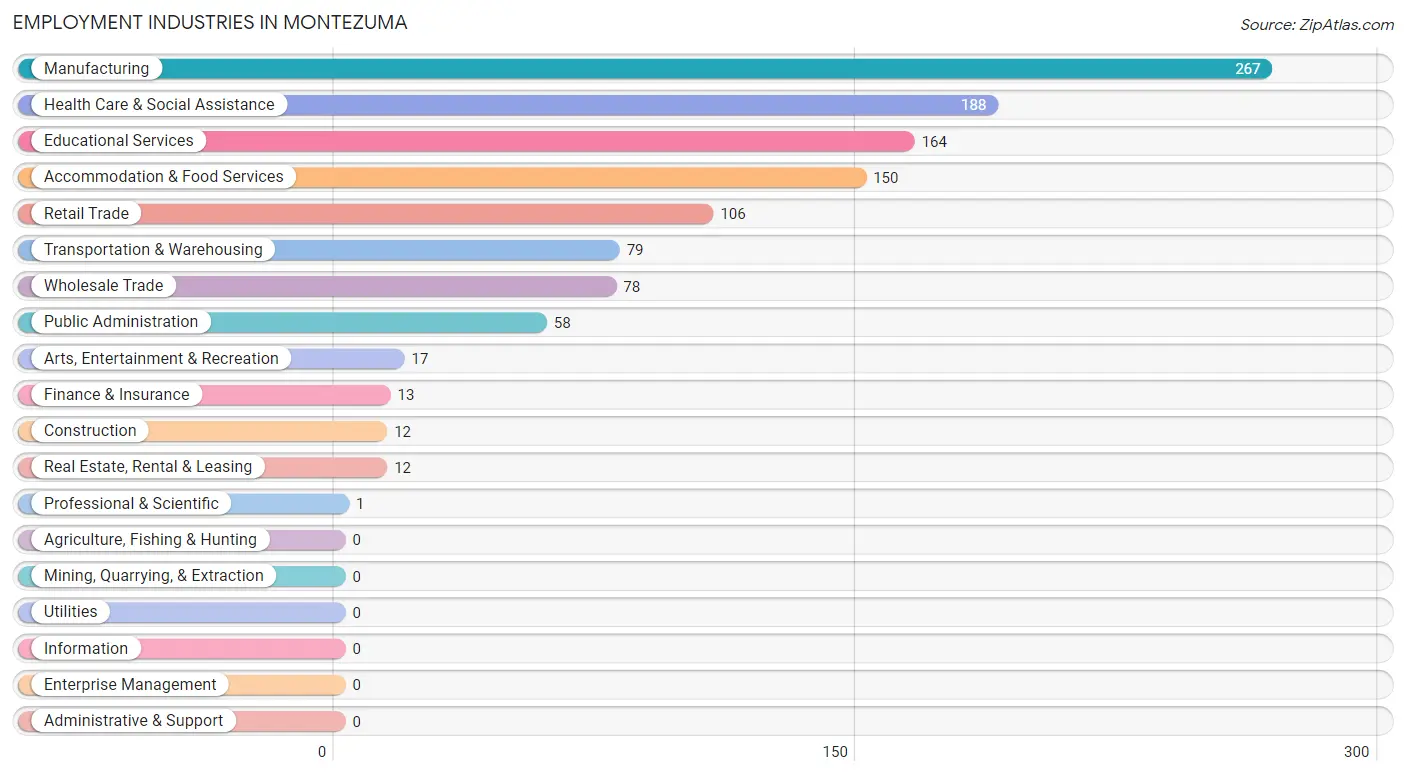
Employment Industries in Montezuma
The major employment industries in Montezuma include Manufacturing (267 | 22.9%), Health Care & Social Assistance (188 | 16.1%), Educational Services (164 | 14.1%), Accommodation & Food Services (150 | 12.9%), and Retail Trade (106 | 9.1%).
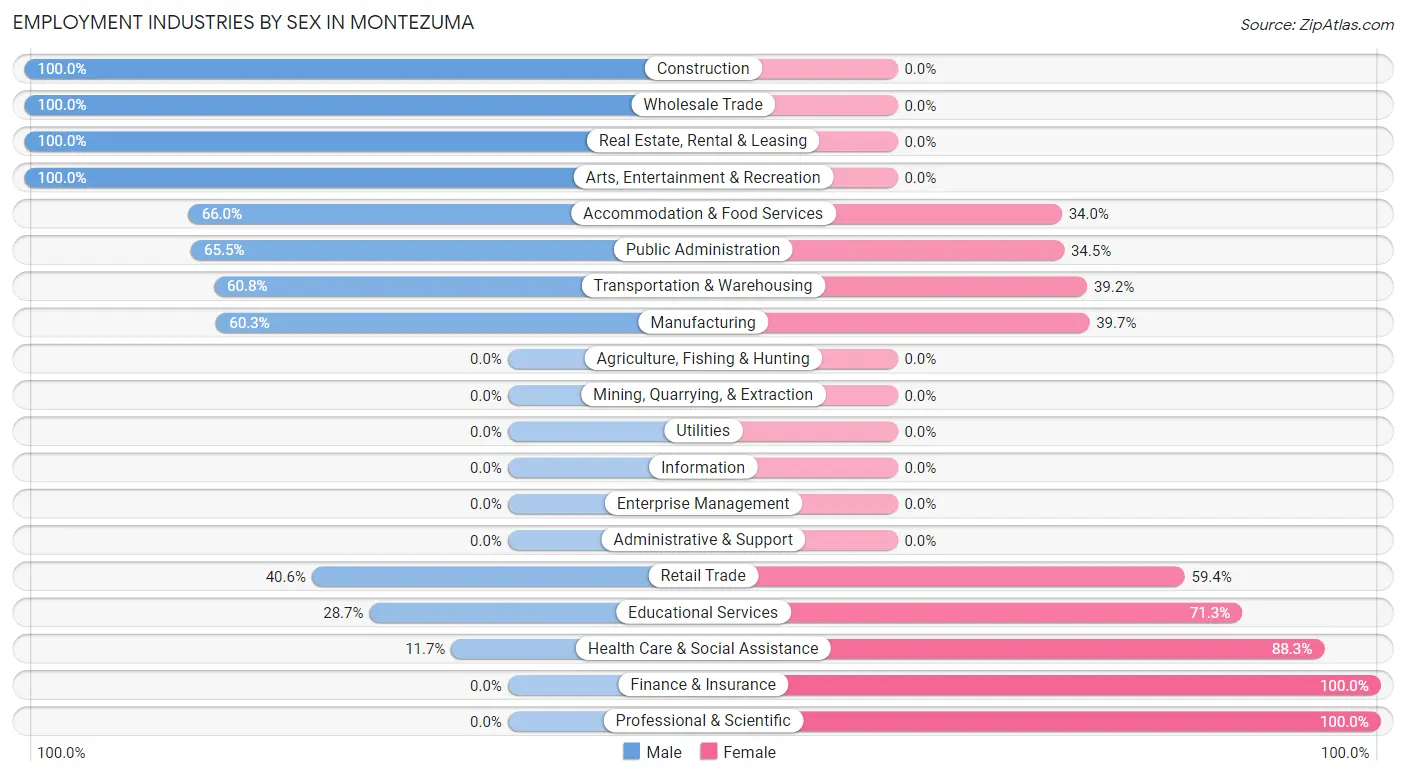
Employment Industries by Sex in Montezuma
The Montezuma industries that see more men than women are Construction (100.0%), Wholesale Trade (100.0%), and Real Estate, Rental & Leasing (100.0%), whereas the industries that tend to have a higher number of women are Finance & Insurance (100.0%), Professional & Scientific (100.0%), and Health Care & Social Assistance (88.3%).
| Industry | Male | Female |
| Agriculture, Fishing & Hunting | 0 (0.0%) | 0 (0.0%) |
| Mining, Quarrying, & Extraction | 0 (0.0%) | 0 (0.0%) |
| Construction | 12 (100.0%) | 0 (0.0%) |
| Manufacturing | 161 (60.3%) | 106 (39.7%) |
| Wholesale Trade | 78 (100.0%) | 0 (0.0%) |
| Retail Trade | 43 (40.6%) | 63 (59.4%) |
| Transportation & Warehousing | 48 (60.8%) | 31 (39.2%) |
| Utilities | 0 (0.0%) | 0 (0.0%) |
| Information | 0 (0.0%) | 0 (0.0%) |
| Finance & Insurance | 0 (0.0%) | 13 (100.0%) |
| Real Estate, Rental & Leasing | 12 (100.0%) | 0 (0.0%) |
| Professional & Scientific | 0 (0.0%) | 1 (100.0%) |
| Enterprise Management | 0 (0.0%) | 0 (0.0%) |
| Administrative & Support | 0 (0.0%) | 0 (0.0%) |
| Educational Services | 47 (28.7%) | 117 (71.3%) |
| Health Care & Social Assistance | 22 (11.7%) | 166 (88.3%) |
| Arts, Entertainment & Recreation | 17 (100.0%) | 0 (0.0%) |
| Accommodation & Food Services | 99 (66.0%) | 51 (34.0%) |
| Public Administration | 38 (65.5%) | 20 (34.5%) |
| Total | 577 (49.5%) | 588 (50.5%) |
Education in Montezuma
School Enrollment in Montezuma
The most common levels of schooling among the 763 students in Montezuma are college / undergraduate (280 | 36.7%), middle school (274 | 35.9%), and elementary school (105 | 13.8%).
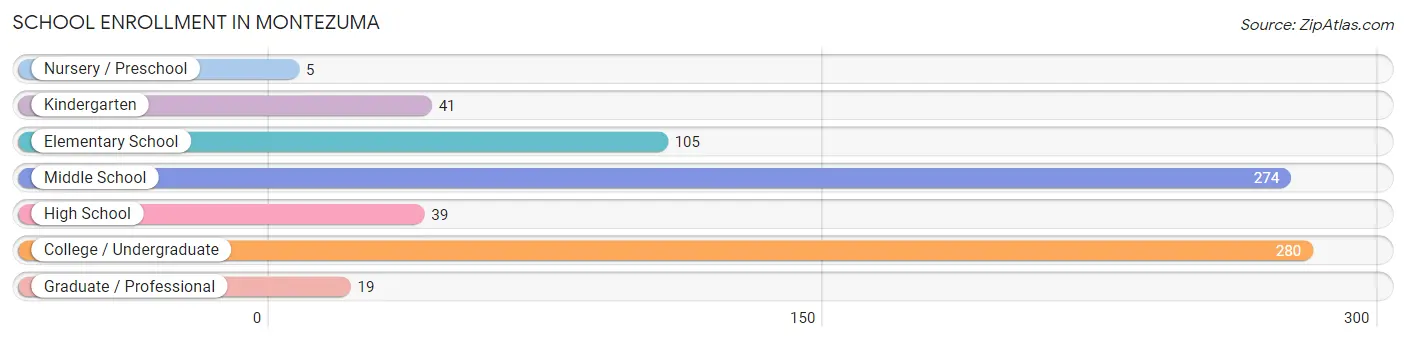
| School Level | # Students | % Students |
| Nursery / Preschool | 5 | 0.7% |
| Kindergarten | 41 | 5.4% |
| Elementary School | 105 | 13.8% |
| Middle School | 274 | 35.9% |
| High School | 39 | 5.1% |
| College / Undergraduate | 280 | 36.7% |
| Graduate / Professional | 19 | 2.5% |
| Total | 763 | 100.0% |
School Enrollment by Age by Funding Source in Montezuma
Out of a total of 763 students who are enrolled in schools in Montezuma, 94 (12.3%) attend a private institution, while the remaining 669 (87.7%) are enrolled in public schools. The age group of 25 to 34 year olds has the highest likelihood of being enrolled in private schools, with 19 (23.7% in the age bracket) enrolled. Conversely, the age group of 3 to 4 year olds has the lowest likelihood of being enrolled in a private school, with 5 (100.0% in the age bracket) attending a public institution.
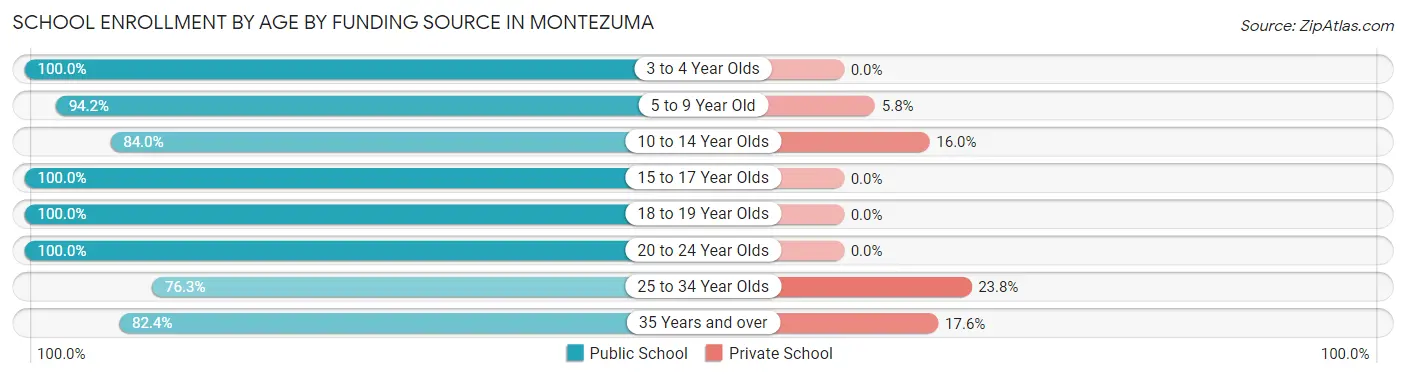
| Age Bracket | Public School | Private School |
| 3 to 4 Year Olds | 5 (100.0%) | 0 (0.0%) |
| 5 to 9 Year Old | 130 (94.2%) | 8 (5.8%) |
| 10 to 14 Year Olds | 237 (84.0%) | 45 (16.0%) |
| 15 to 17 Year Olds | 20 (100.0%) | 0 (0.0%) |
| 18 to 19 Year Olds | 39 (100.0%) | 0 (0.0%) |
| 20 to 24 Year Olds | 74 (100.0%) | 0 (0.0%) |
| 25 to 34 Year Olds | 61 (76.2%) | 19 (23.7%) |
| 35 Years and over | 103 (82.4%) | 22 (17.6%) |
| Total | 669 (87.7%) | 94 (12.3%) |
Educational Attainment by Field of Study in Montezuma
Business (91 | 25.7%), education (69 | 19.5%), liberal arts & history (51 | 14.4%), arts & humanities (35 | 9.9%), and science & technology (25 | 7.1%) are the most common fields of study among 354 individuals in Montezuma who have obtained a bachelor's degree or higher.
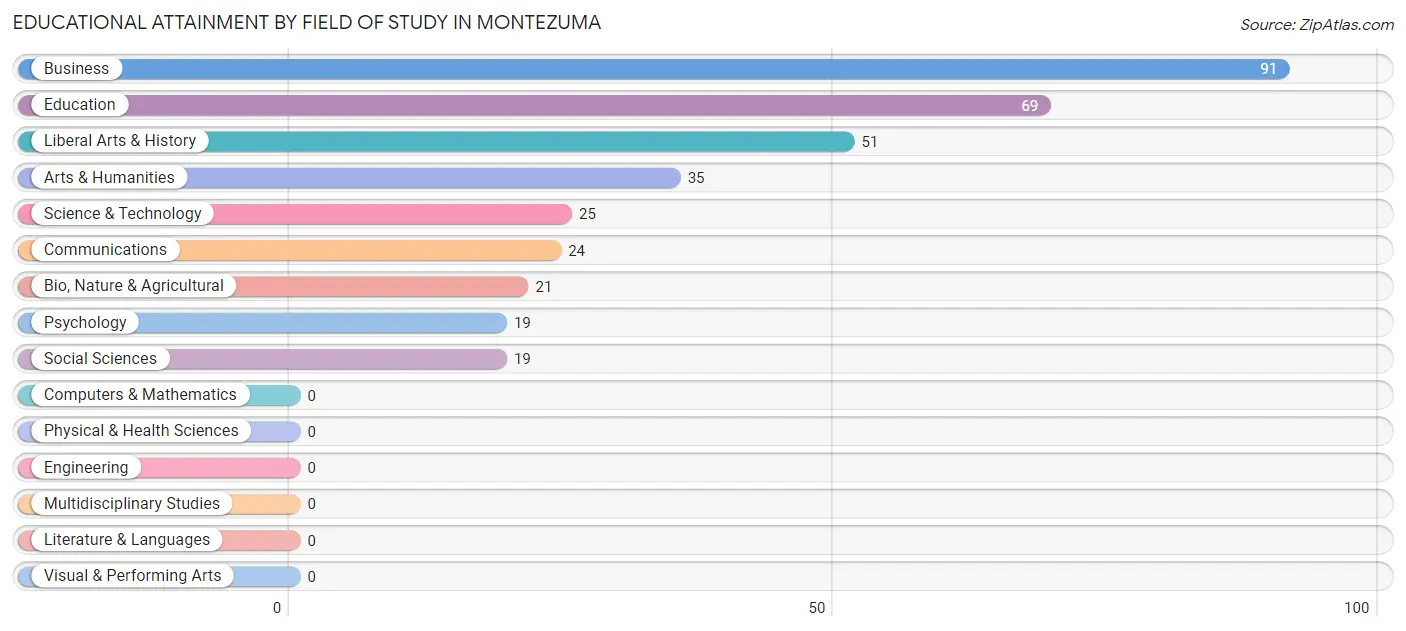
| Field of Study | # Graduates | % Graduates |
| Computers & Mathematics | 0 | 0.0% |
| Bio, Nature & Agricultural | 21 | 5.9% |
| Physical & Health Sciences | 0 | 0.0% |
| Psychology | 19 | 5.4% |
| Social Sciences | 19 | 5.4% |
| Engineering | 0 | 0.0% |
| Multidisciplinary Studies | 0 | 0.0% |
| Science & Technology | 25 | 7.1% |
| Business | 91 | 25.7% |
| Education | 69 | 19.5% |
| Literature & Languages | 0 | 0.0% |
| Liberal Arts & History | 51 | 14.4% |
| Visual & Performing Arts | 0 | 0.0% |
| Communications | 24 | 6.8% |
| Arts & Humanities | 35 | 9.9% |
| Total | 354 | 100.0% |
Transportation & Commute in Montezuma
Vehicle Availability by Sex in Montezuma
The most prevalent vehicle ownership categories in Montezuma are males with 2 vehicles (192, accounting for 33.3%) and females with 2 vehicles (230, making up 32.7%).
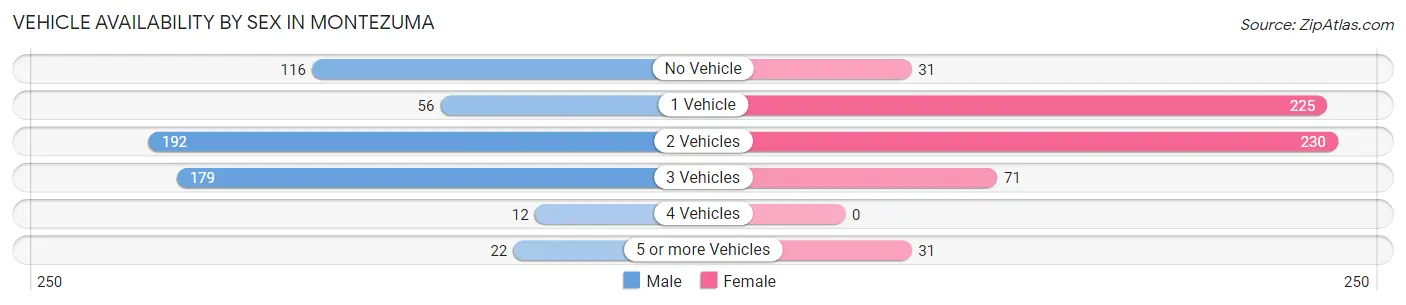
| Vehicles Available | Male | Female |
| No Vehicle | 116 (20.1%) | 31 (5.3%) |
| 1 Vehicle | 56 (9.7%) | 225 (38.3%) |
| 2 Vehicles | 192 (33.3%) | 230 (39.1%) |
| 3 Vehicles | 179 (31.0%) | 71 (12.1%) |
| 4 Vehicles | 12 (2.1%) | 0 (0.0%) |
| 5 or more Vehicles | 22 (3.8%) | 31 (5.3%) |
| Total | 577 (100.0%) | 588 (100.0%) |
Commute Time in Montezuma
The most frequently occuring commute durations in Montezuma are 10 to 14 minutes (361 commuters, 32.0%), 5 to 9 minutes (201 commuters, 17.8%), and 30 to 34 minutes (145 commuters, 12.8%).
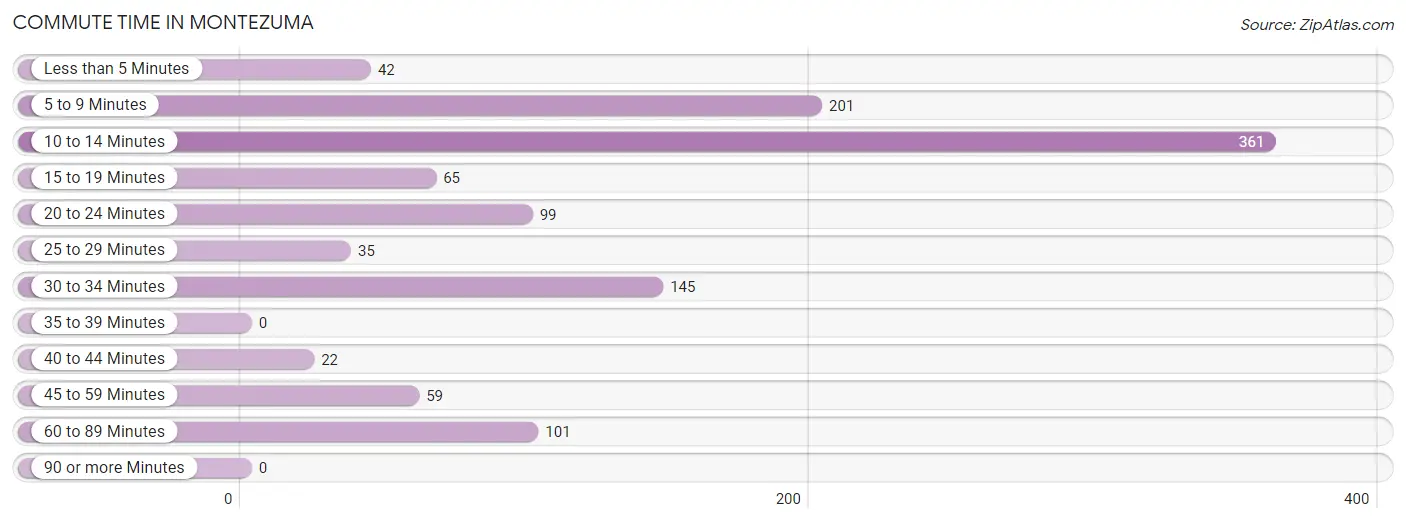
| Commute Time | # Commuters | % Commuters |
| Less than 5 Minutes | 42 | 3.7% |
| 5 to 9 Minutes | 201 | 17.8% |
| 10 to 14 Minutes | 361 | 32.0% |
| 15 to 19 Minutes | 65 | 5.8% |
| 20 to 24 Minutes | 99 | 8.8% |
| 25 to 29 Minutes | 35 | 3.1% |
| 30 to 34 Minutes | 145 | 12.8% |
| 35 to 39 Minutes | 0 | 0.0% |
| 40 to 44 Minutes | 22 | 1.9% |
| 45 to 59 Minutes | 59 | 5.2% |
| 60 to 89 Minutes | 101 | 8.9% |
| 90 or more Minutes | 0 | 0.0% |
Commute Time by Sex in Montezuma
The most common commute times in Montezuma are 10 to 14 minutes (222 commuters, 39.6%) for males and 10 to 14 minutes (139 commuters, 24.4%) for females.
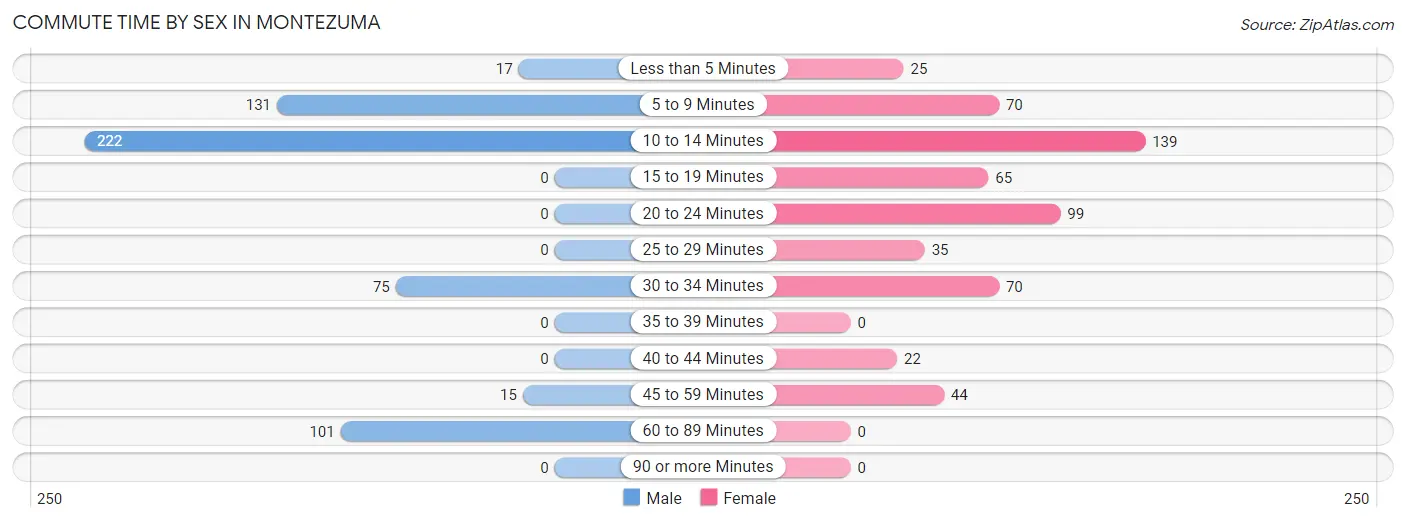
| Commute Time | Male | Female |
| Less than 5 Minutes | 17 (3.0%) | 25 (4.4%) |
| 5 to 9 Minutes | 131 (23.4%) | 70 (12.3%) |
| 10 to 14 Minutes | 222 (39.6%) | 139 (24.4%) |
| 15 to 19 Minutes | 0 (0.0%) | 65 (11.4%) |
| 20 to 24 Minutes | 0 (0.0%) | 99 (17.4%) |
| 25 to 29 Minutes | 0 (0.0%) | 35 (6.1%) |
| 30 to 34 Minutes | 75 (13.4%) | 70 (12.3%) |
| 35 to 39 Minutes | 0 (0.0%) | 0 (0.0%) |
| 40 to 44 Minutes | 0 (0.0%) | 22 (3.9%) |
| 45 to 59 Minutes | 15 (2.7%) | 44 (7.7%) |
| 60 to 89 Minutes | 101 (18.0%) | 0 (0.0%) |
| 90 or more Minutes | 0 (0.0%) | 0 (0.0%) |
Time of Departure to Work by Sex in Montezuma
The most frequent times of departure to work in Montezuma are 7:30 AM to 7:59 AM (131, 23.4%) for males and 6:00 AM to 6:29 AM (97, 17.1%) for females.
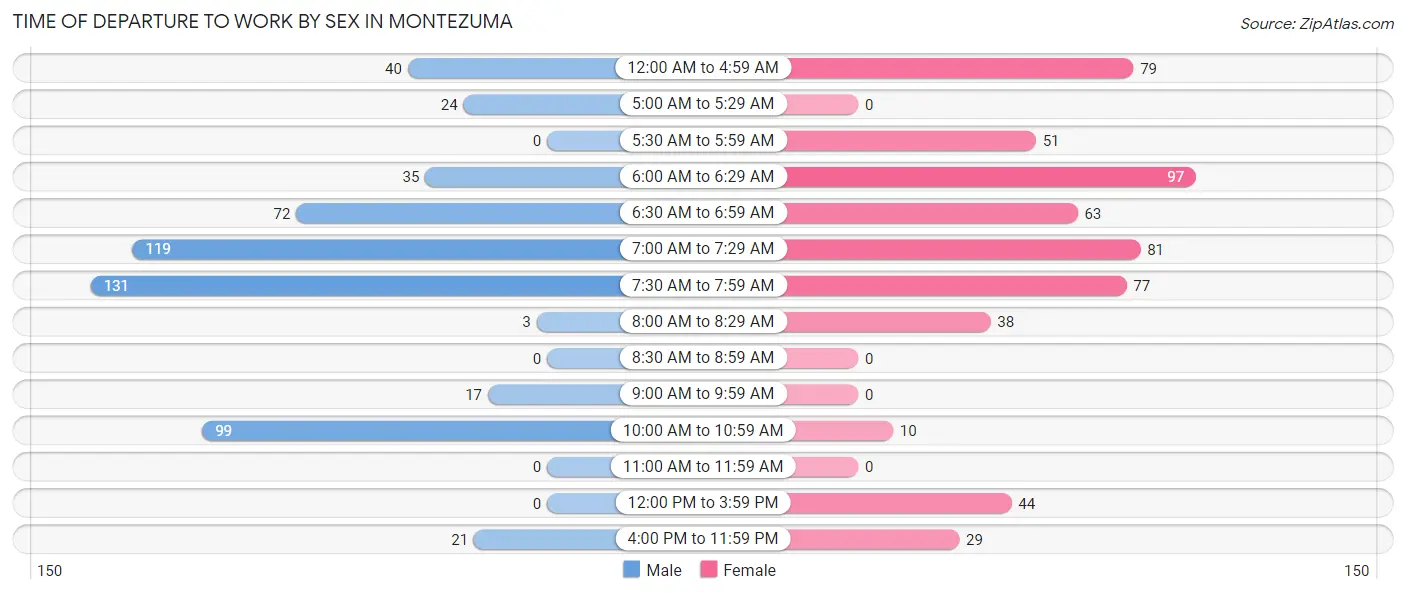
| Time of Departure | Male | Female |
| 12:00 AM to 4:59 AM | 40 (7.1%) | 79 (13.9%) |
| 5:00 AM to 5:29 AM | 24 (4.3%) | 0 (0.0%) |
| 5:30 AM to 5:59 AM | 0 (0.0%) | 51 (9.0%) |
| 6:00 AM to 6:29 AM | 35 (6.2%) | 97 (17.1%) |
| 6:30 AM to 6:59 AM | 72 (12.8%) | 63 (11.1%) |
| 7:00 AM to 7:29 AM | 119 (21.2%) | 81 (14.2%) |
| 7:30 AM to 7:59 AM | 131 (23.4%) | 77 (13.5%) |
| 8:00 AM to 8:29 AM | 3 (0.5%) | 38 (6.7%) |
| 8:30 AM to 8:59 AM | 0 (0.0%) | 0 (0.0%) |
| 9:00 AM to 9:59 AM | 17 (3.0%) | 0 (0.0%) |
| 10:00 AM to 10:59 AM | 99 (17.6%) | 10 (1.8%) |
| 11:00 AM to 11:59 AM | 0 (0.0%) | 0 (0.0%) |
| 12:00 PM to 3:59 PM | 0 (0.0%) | 44 (7.7%) |
| 4:00 PM to 11:59 PM | 21 (3.7%) | 29 (5.1%) |
| Total | 561 (100.0%) | 569 (100.0%) |
Housing Occupancy in Montezuma
Occupancy by Ownership in Montezuma
Of the total 1,185 dwellings in Montezuma, owner-occupied units account for 741 (62.5%), while renter-occupied units make up 444 (37.5%).
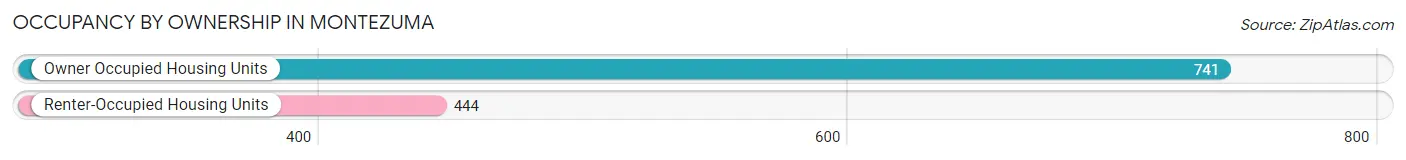
| Occupancy | # Housing Units | % Housing Units |
| Owner Occupied Housing Units | 741 | 62.5% |
| Renter-Occupied Housing Units | 444 | 37.5% |
| Total Occupied Housing Units | 1,185 | 100.0% |
Occupancy by Household Size in Montezuma
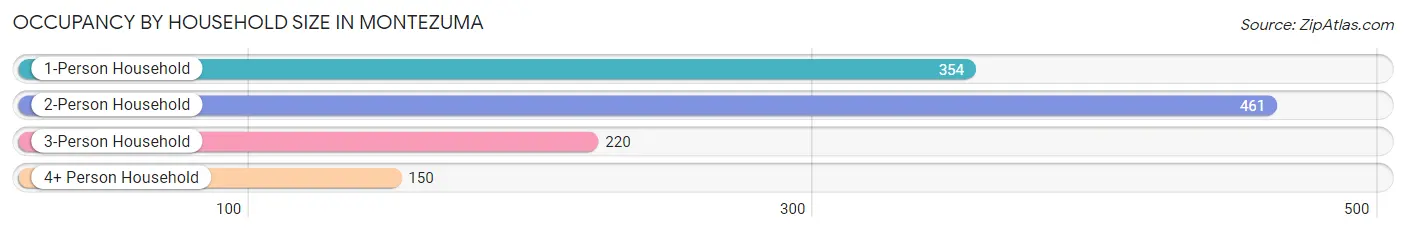
| Household Size | # Housing Units | % Housing Units |
| 1-Person Household | 354 | 29.9% |
| 2-Person Household | 461 | 38.9% |
| 3-Person Household | 220 | 18.6% |
| 4+ Person Household | 150 | 12.7% |
| Total Housing Units | 1,185 | 100.0% |
Occupancy by Ownership by Household Size in Montezuma
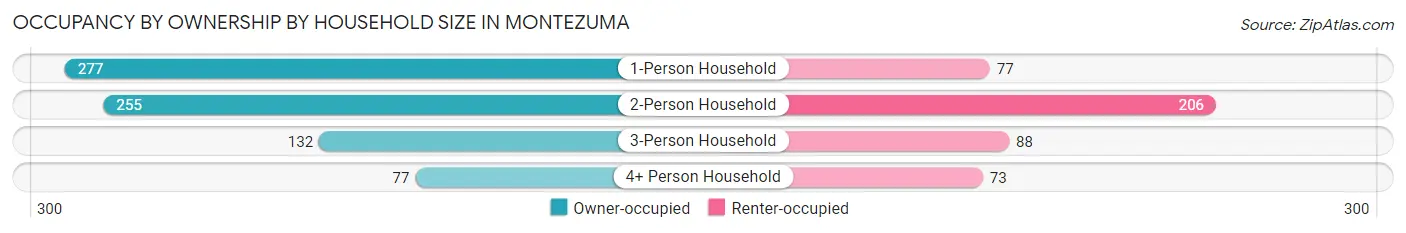
| Household Size | Owner-occupied | Renter-occupied |
| 1-Person Household | 277 (78.2%) | 77 (21.7%) |
| 2-Person Household | 255 (55.3%) | 206 (44.7%) |
| 3-Person Household | 132 (60.0%) | 88 (40.0%) |
| 4+ Person Household | 77 (51.3%) | 73 (48.7%) |
| Total Housing Units | 741 (62.5%) | 444 (37.5%) |
Occupancy by Educational Attainment in Montezuma
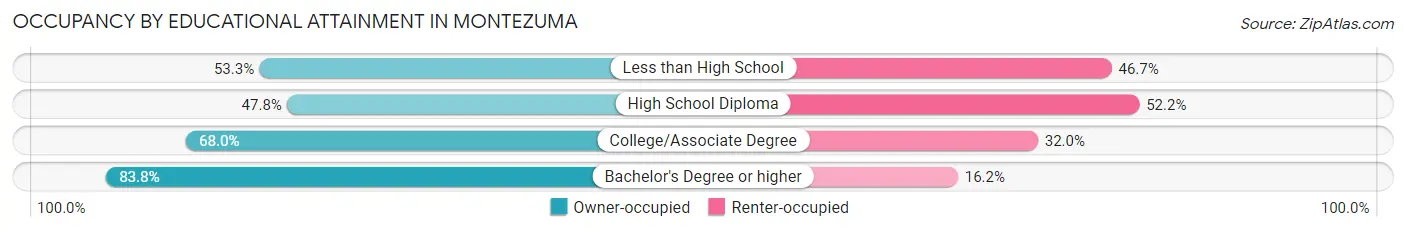
| Household Size | Owner-occupied | Renter-occupied |
| Less than High School | 72 (53.3%) | 63 (46.7%) |
| High School Diploma | 199 (47.8%) | 217 (52.2%) |
| College/Associate Degree | 263 (68.0%) | 124 (32.0%) |
| Bachelor's Degree or higher | 207 (83.8%) | 40 (16.2%) |
Occupancy by Age of Householder in Montezuma
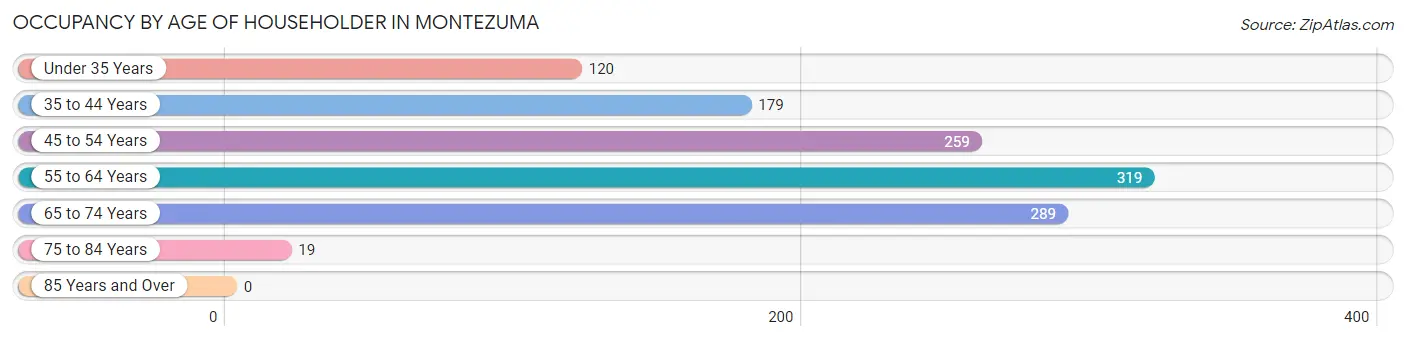
| Age Bracket | # Households | % Households |
| Under 35 Years | 120 | 10.1% |
| 35 to 44 Years | 179 | 15.1% |
| 45 to 54 Years | 259 | 21.9% |
| 55 to 64 Years | 319 | 26.9% |
| 65 to 74 Years | 289 | 24.4% |
| 75 to 84 Years | 19 | 1.6% |
| 85 Years and Over | 0 | 0.0% |
| Total | 1,185 | 100.0% |
Housing Finances in Montezuma
Median Income by Occupancy in Montezuma
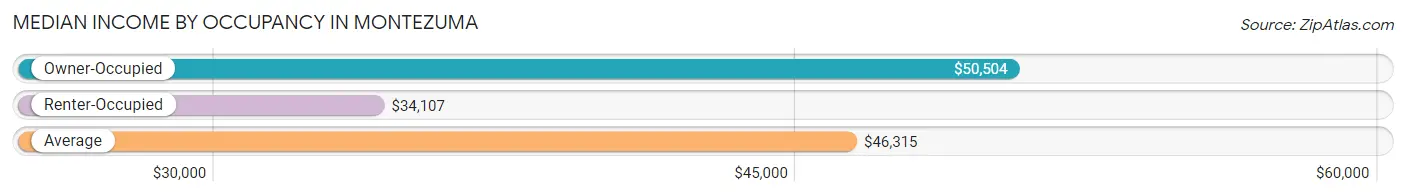
| Occupancy Type | # Households | Median Income |
| Owner-Occupied | 741 (62.5%) | $50,504 |
| Renter-Occupied | 444 (37.5%) | $34,107 |
| Average | 1,185 (100.0%) | $46,315 |
Occupancy by Householder Income Bracket in Montezuma
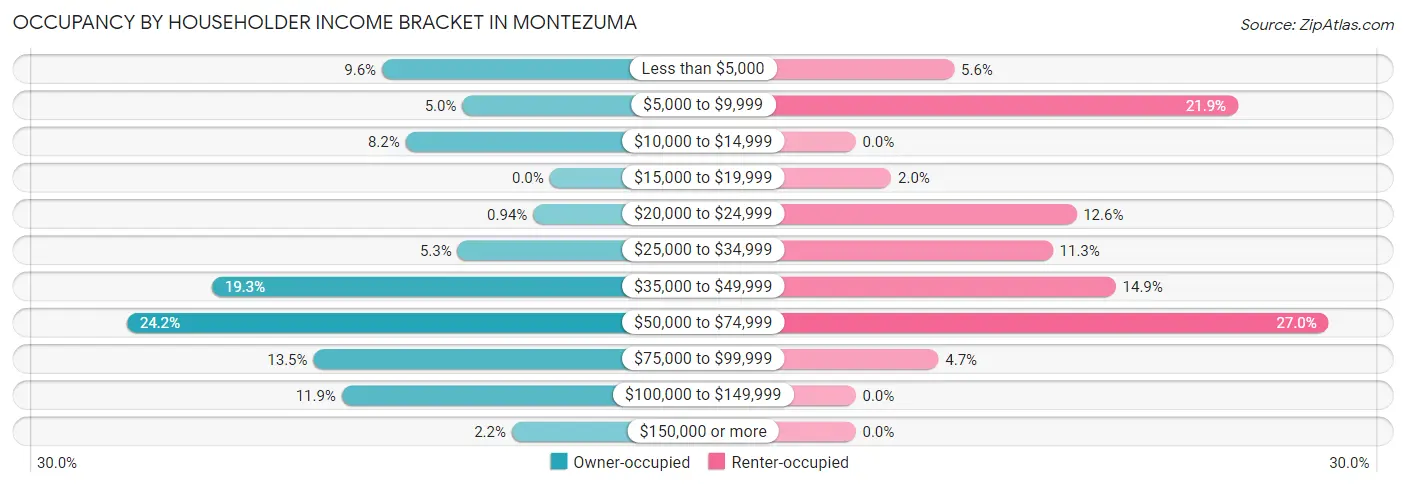
| Income Bracket | Owner-occupied | Renter-occupied |
| Less than $5,000 | 71 (9.6%) | 25 (5.6%) |
| $5,000 to $9,999 | 37 (5.0%) | 97 (21.8%) |
| $10,000 to $14,999 | 61 (8.2%) | 0 (0.0%) |
| $15,000 to $19,999 | 0 (0.0%) | 9 (2.0%) |
| $20,000 to $24,999 | 7 (0.9%) | 56 (12.6%) |
| $25,000 to $34,999 | 39 (5.3%) | 50 (11.3%) |
| $35,000 to $49,999 | 143 (19.3%) | 66 (14.9%) |
| $50,000 to $74,999 | 179 (24.2%) | 120 (27.0%) |
| $75,000 to $99,999 | 100 (13.5%) | 21 (4.7%) |
| $100,000 to $149,999 | 88 (11.9%) | 0 (0.0%) |
| $150,000 or more | 16 (2.2%) | 0 (0.0%) |
| Total | 741 (100.0%) | 444 (100.0%) |
Monthly Housing Cost Tiers in Montezuma
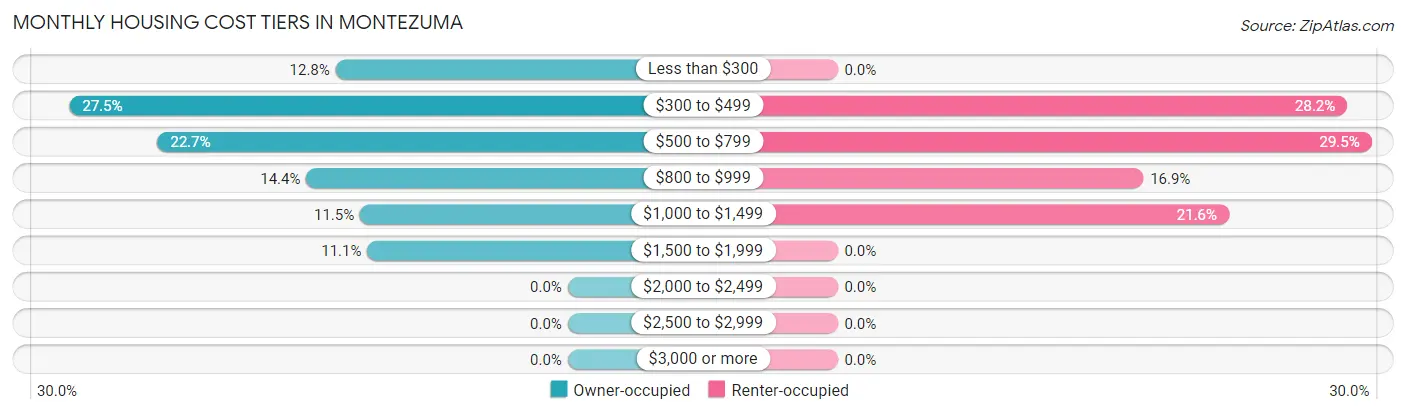
| Monthly Cost | Owner-occupied | Renter-occupied |
| Less than $300 | 95 (12.8%) | 0 (0.0%) |
| $300 to $499 | 204 (27.5%) | 125 (28.1%) |
| $500 to $799 | 168 (22.7%) | 131 (29.5%) |
| $800 to $999 | 107 (14.4%) | 75 (16.9%) |
| $1,000 to $1,499 | 85 (11.5%) | 96 (21.6%) |
| $1,500 to $1,999 | 82 (11.1%) | 0 (0.0%) |
| $2,000 to $2,499 | 0 (0.0%) | 0 (0.0%) |
| $2,500 to $2,999 | 0 (0.0%) | 0 (0.0%) |
| $3,000 or more | 0 (0.0%) | 0 (0.0%) |
| Total | 741 (100.0%) | 444 (100.0%) |
Physical Housing Characteristics in Montezuma
Housing Structures in Montezuma
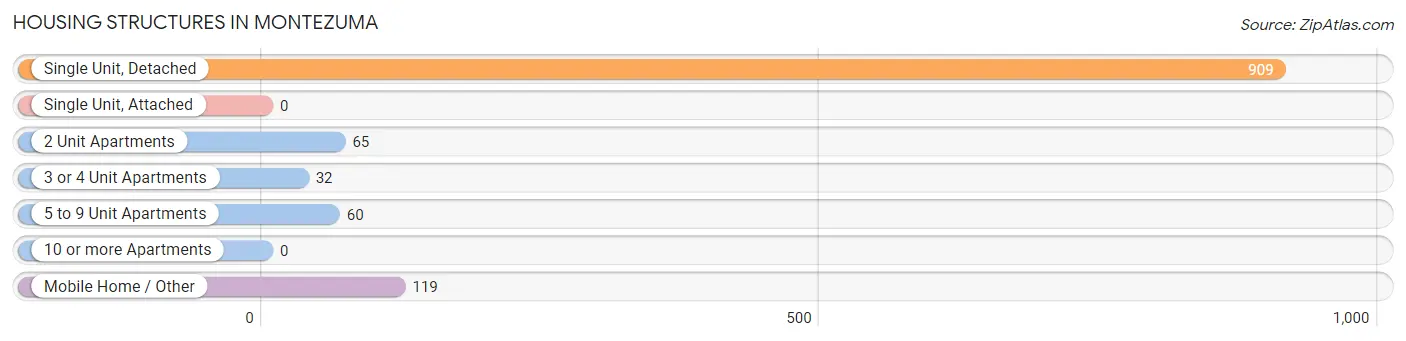
| Structure Type | # Housing Units | % Housing Units |
| Single Unit, Detached | 909 | 76.7% |
| Single Unit, Attached | 0 | 0.0% |
| 2 Unit Apartments | 65 | 5.5% |
| 3 or 4 Unit Apartments | 32 | 2.7% |
| 5 to 9 Unit Apartments | 60 | 5.1% |
| 10 or more Apartments | 0 | 0.0% |
| Mobile Home / Other | 119 | 10.0% |
| Total | 1,185 | 100.0% |
Housing Structures by Occupancy in Montezuma
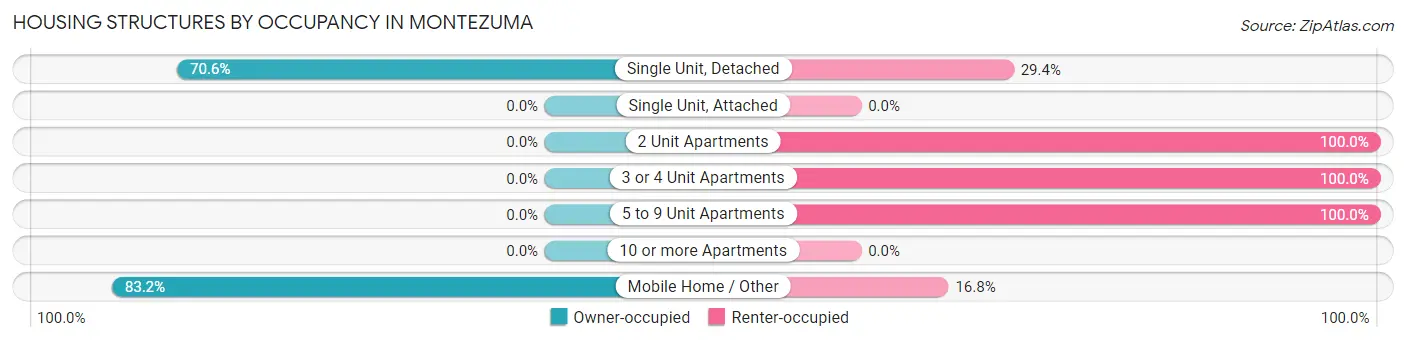
| Structure Type | Owner-occupied | Renter-occupied |
| Single Unit, Detached | 642 (70.6%) | 267 (29.4%) |
| Single Unit, Attached | 0 (0.0%) | 0 (0.0%) |
| 2 Unit Apartments | 0 (0.0%) | 65 (100.0%) |
| 3 or 4 Unit Apartments | 0 (0.0%) | 32 (100.0%) |
| 5 to 9 Unit Apartments | 0 (0.0%) | 60 (100.0%) |
| 10 or more Apartments | 0 (0.0%) | 0 (0.0%) |
| Mobile Home / Other | 99 (83.2%) | 20 (16.8%) |
| Total | 741 (62.5%) | 444 (37.5%) |
Housing Structures by Number of Rooms in Montezuma
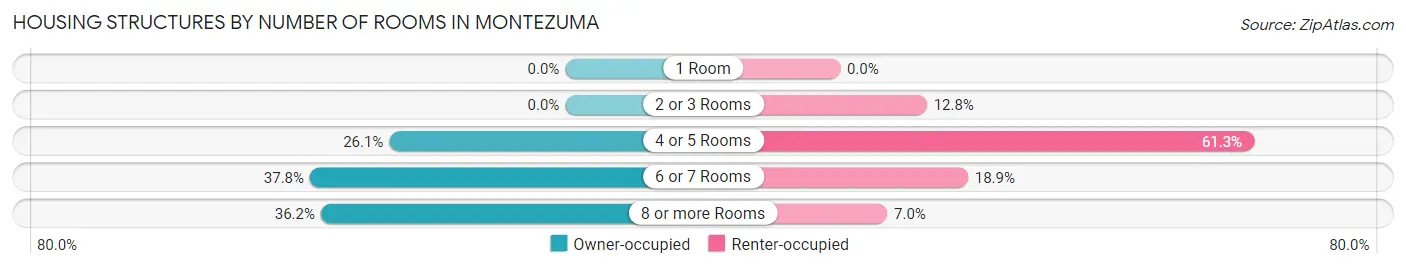
| Number of Rooms | Owner-occupied | Renter-occupied |
| 1 Room | 0 (0.0%) | 0 (0.0%) |
| 2 or 3 Rooms | 0 (0.0%) | 57 (12.8%) |
| 4 or 5 Rooms | 193 (26.1%) | 272 (61.3%) |
| 6 or 7 Rooms | 280 (37.8%) | 84 (18.9%) |
| 8 or more Rooms | 268 (36.2%) | 31 (7.0%) |
| Total | 741 (100.0%) | 444 (100.0%) |
Housing Structure by Heating Type in Montezuma
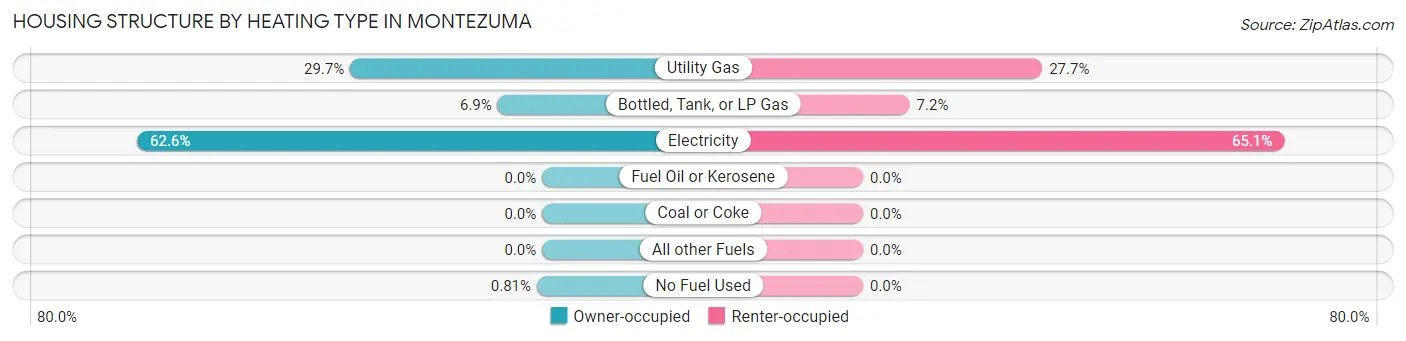
| Heating Type | Owner-occupied | Renter-occupied |
| Utility Gas | 220 (29.7%) | 123 (27.7%) |
| Bottled, Tank, or LP Gas | 51 (6.9%) | 32 (7.2%) |
| Electricity | 464 (62.6%) | 289 (65.1%) |
| Fuel Oil or Kerosene | 0 (0.0%) | 0 (0.0%) |
| Coal or Coke | 0 (0.0%) | 0 (0.0%) |
| All other Fuels | 0 (0.0%) | 0 (0.0%) |
| No Fuel Used | 6 (0.8%) | 0 (0.0%) |
| Total | 741 (100.0%) | 444 (100.0%) |
Household Vehicle Usage in Montezuma
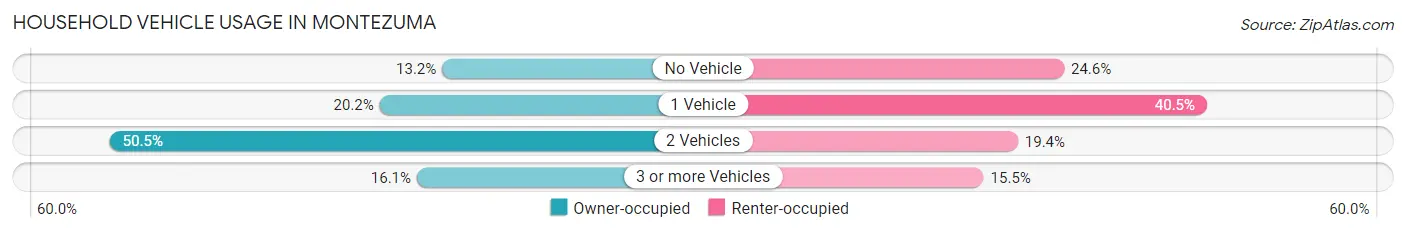
| Vehicles per Household | Owner-occupied | Renter-occupied |
| No Vehicle | 98 (13.2%) | 109 (24.5%) |
| 1 Vehicle | 150 (20.2%) | 180 (40.5%) |
| 2 Vehicles | 374 (50.5%) | 86 (19.4%) |
| 3 or more Vehicles | 119 (16.1%) | 69 (15.5%) |
| Total | 741 (100.0%) | 444 (100.0%) |
Real Estate & Mortgages in Montezuma
Real Estate and Mortgage Overview in Montezuma
| Characteristic | Without Mortgage | With Mortgage |
| Housing Units | 438 | 303 |
| Median Property Value | $67,000 | $117,800 |
| Median Household Income | $43,295 | $12 |
| Monthly Housing Costs | $417 | $0 |
| Real Estate Taxes | $782 | $0 |
Property Value by Mortgage Status in Montezuma
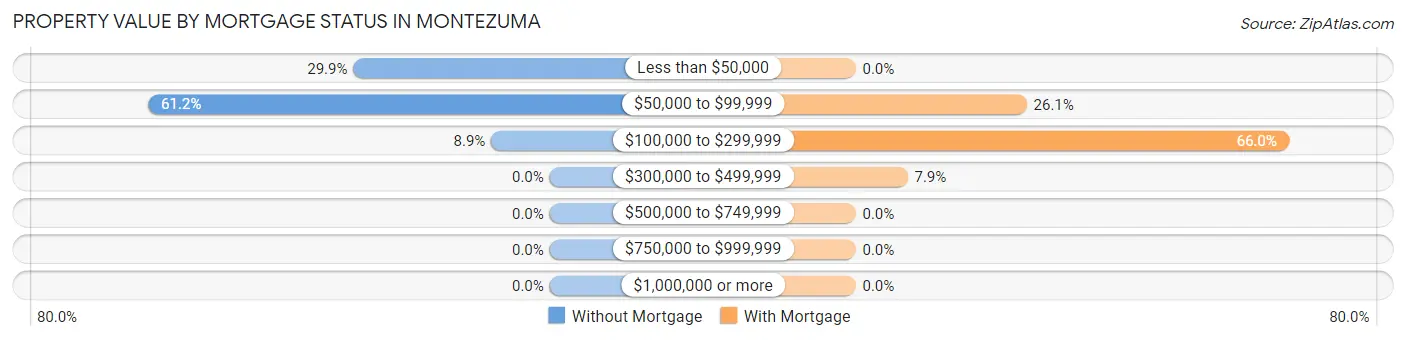
| Property Value | Without Mortgage | With Mortgage |
| Less than $50,000 | 131 (29.9%) | 0 (0.0%) |
| $50,000 to $99,999 | 268 (61.2%) | 79 (26.1%) |
| $100,000 to $299,999 | 39 (8.9%) | 200 (66.0%) |
| $300,000 to $499,999 | 0 (0.0%) | 24 (7.9%) |
| $500,000 to $749,999 | 0 (0.0%) | 0 (0.0%) |
| $750,000 to $999,999 | 0 (0.0%) | 0 (0.0%) |
| $1,000,000 or more | 0 (0.0%) | 0 (0.0%) |
| Total | 438 (100.0%) | 303 (100.0%) |
Household Income by Mortgage Status in Montezuma
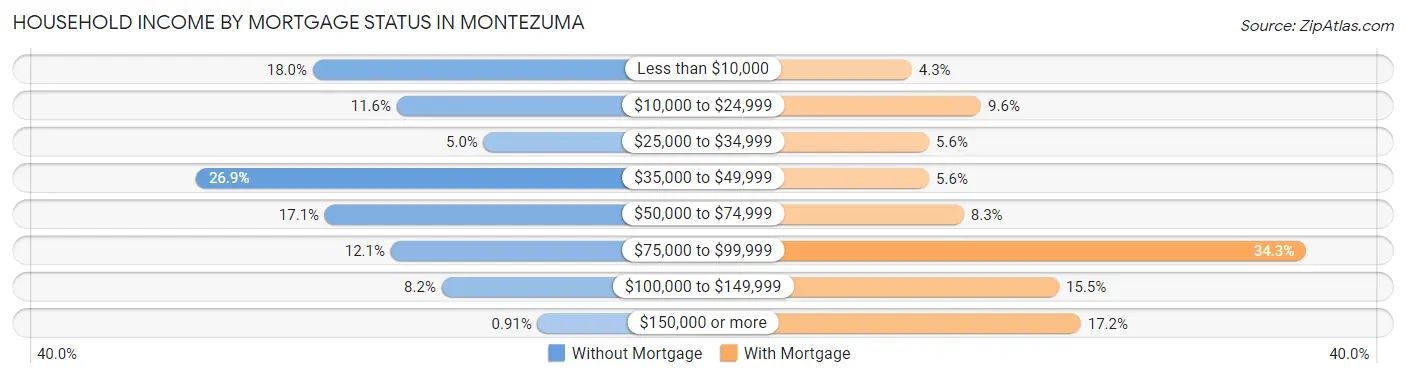
| Household Income | Without Mortgage | With Mortgage |
| Less than $10,000 | 79 (18.0%) | 13 (4.3%) |
| $10,000 to $24,999 | 51 (11.6%) | 29 (9.6%) |
| $25,000 to $34,999 | 22 (5.0%) | 17 (5.6%) |
| $35,000 to $49,999 | 118 (26.9%) | 17 (5.6%) |
| $50,000 to $74,999 | 75 (17.1%) | 25 (8.3%) |
| $75,000 to $99,999 | 53 (12.1%) | 104 (34.3%) |
| $100,000 to $149,999 | 36 (8.2%) | 47 (15.5%) |
| $150,000 or more | 4 (0.9%) | 52 (17.2%) |
| Total | 438 (100.0%) | 303 (100.0%) |
Property Value to Household Income Ratio in Montezuma
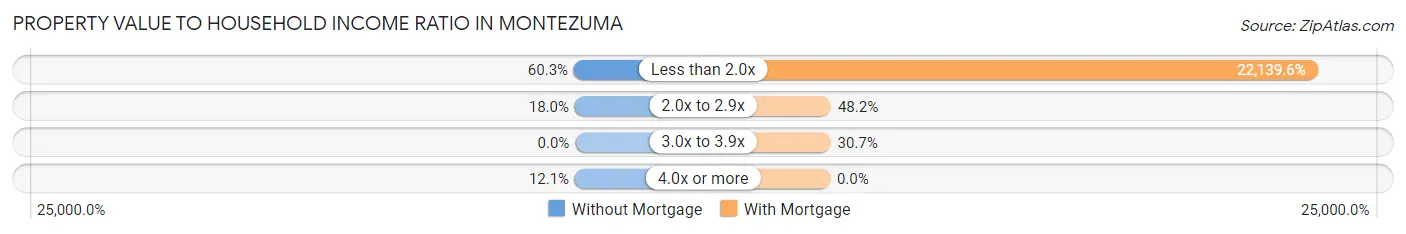
| Value-to-Income Ratio | Without Mortgage | With Mortgage |
| Less than 2.0x | 264 (60.3%) | 67,083 (22,139.6%) |
| 2.0x to 2.9x | 79 (18.0%) | 146 (48.2%) |
| 3.0x to 3.9x | 0 (0.0%) | 93 (30.7%) |
| 4.0x or more | 53 (12.1%) | 0 (0.0%) |
| Total | 438 (100.0%) | 303 (100.0%) |
Real Estate Taxes by Mortgage Status in Montezuma
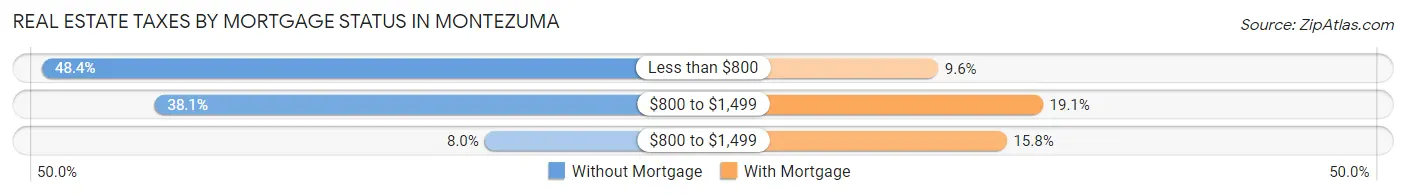
| Property Taxes | Without Mortgage | With Mortgage |
| Less than $800 | 212 (48.4%) | 29 (9.6%) |
| $800 to $1,499 | 167 (38.1%) | 58 (19.1%) |
| $800 to $1,499 | 35 (8.0%) | 48 (15.8%) |
| Total | 438 (100.0%) | 303 (100.0%) |
Health & Disability in Montezuma
Health Insurance Coverage by Age in Montezuma
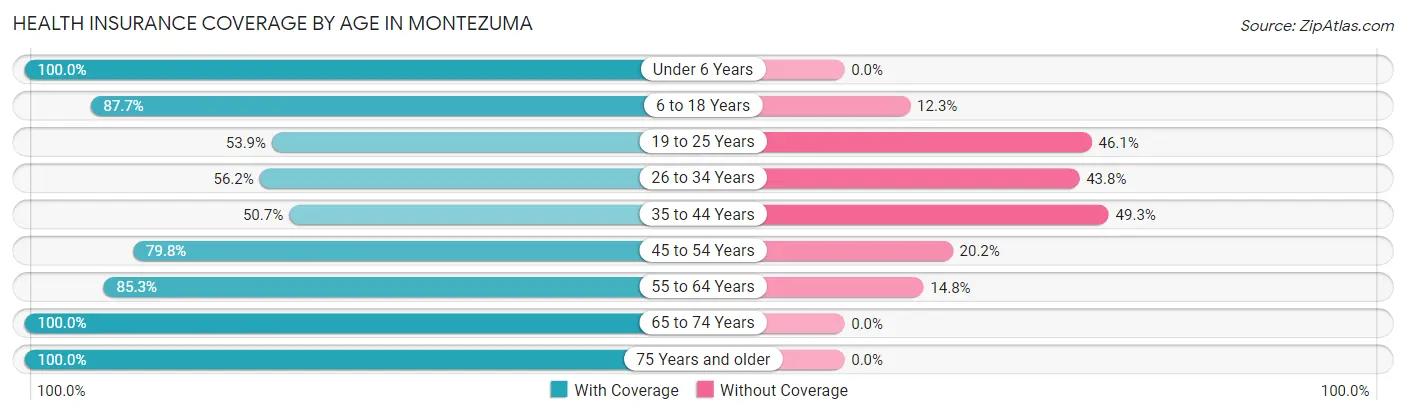
| Age Bracket | With Coverage | Without Coverage |
| Under 6 Years | 178 (100.0%) | 0 (0.0%) |
| 6 to 18 Years | 350 (87.7%) | 49 (12.3%) |
| 19 to 25 Years | 201 (53.9%) | 172 (46.1%) |
| 26 to 34 Years | 186 (56.2%) | 145 (43.8%) |
| 35 to 44 Years | 144 (50.7%) | 140 (49.3%) |
| 45 to 54 Years | 403 (79.8%) | 102 (20.2%) |
| 55 to 64 Years | 370 (85.3%) | 64 (14.7%) |
| 65 to 74 Years | 438 (100.0%) | 0 (0.0%) |
| 75 Years and older | 26 (100.0%) | 0 (0.0%) |
| Total | 2,296 (77.4%) | 672 (22.6%) |
Health Insurance Coverage by Citizenship Status in Montezuma
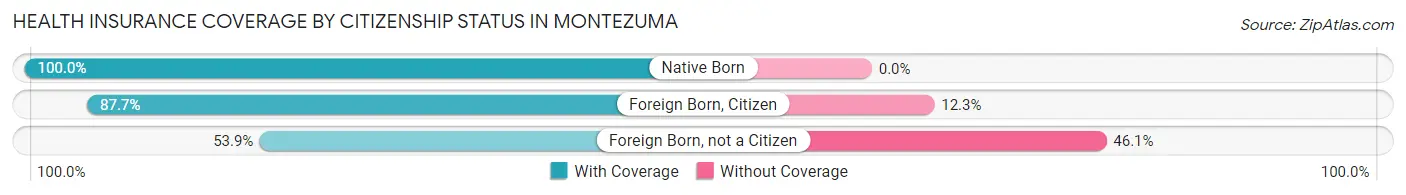
| Citizenship Status | With Coverage | Without Coverage |
| Native Born | 178 (100.0%) | 0 (0.0%) |
| Foreign Born, Citizen | 350 (87.7%) | 49 (12.3%) |
| Foreign Born, not a Citizen | 201 (53.9%) | 172 (46.1%) |
Health Insurance Coverage by Household Income in Montezuma
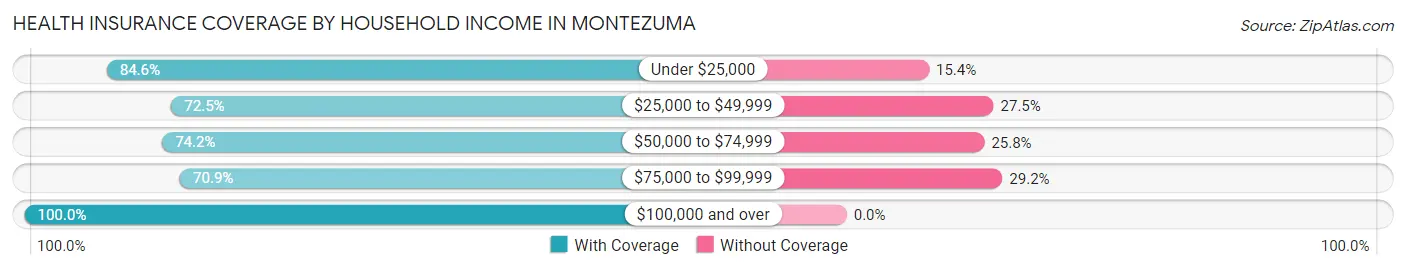
| Household Income | With Coverage | Without Coverage |
| Under $25,000 | 560 (84.6%) | 102 (15.4%) |
| $25,000 to $49,999 | 593 (72.5%) | 225 (27.5%) |
| $50,000 to $74,999 | 659 (74.2%) | 229 (25.8%) |
| $75,000 to $99,999 | 282 (70.9%) | 116 (29.1%) |
| $100,000 and over | 202 (100.0%) | 0 (0.0%) |
Public vs Private Health Insurance Coverage by Age in Montezuma
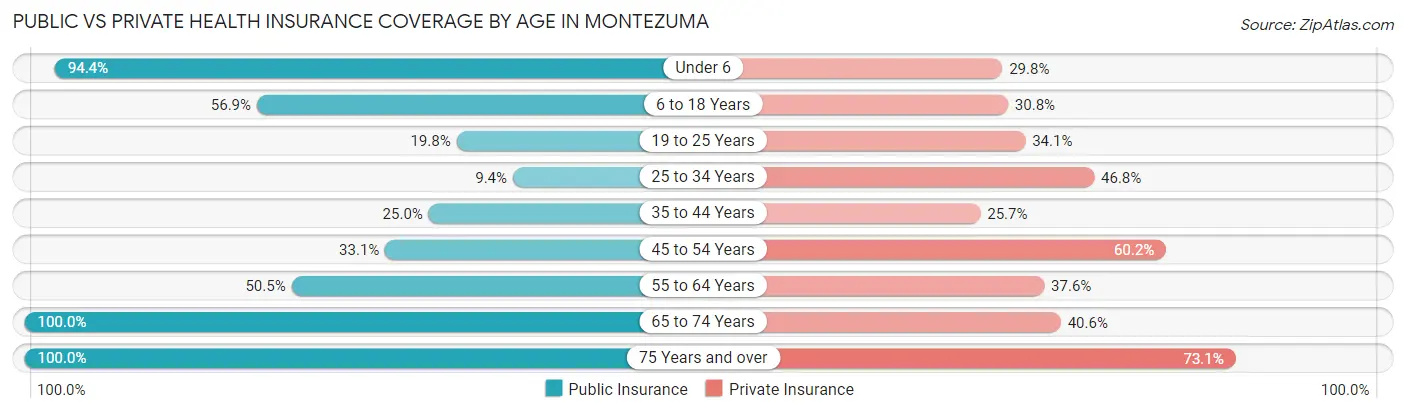
| Age Bracket | Public Insurance | Private Insurance |
| Under 6 | 168 (94.4%) | 53 (29.8%) |
| 6 to 18 Years | 227 (56.9%) | 123 (30.8%) |
| 19 to 25 Years | 74 (19.8%) | 127 (34.1%) |
| 25 to 34 Years | 31 (9.4%) | 155 (46.8%) |
| 35 to 44 Years | 71 (25.0%) | 73 (25.7%) |
| 45 to 54 Years | 167 (33.1%) | 304 (60.2%) |
| 55 to 64 Years | 219 (50.5%) | 163 (37.6%) |
| 65 to 74 Years | 438 (100.0%) | 178 (40.6%) |
| 75 Years and over | 26 (100.0%) | 19 (73.1%) |
| Total | 1,421 (47.9%) | 1,195 (40.3%) |
Disability Status by Sex by Age in Montezuma
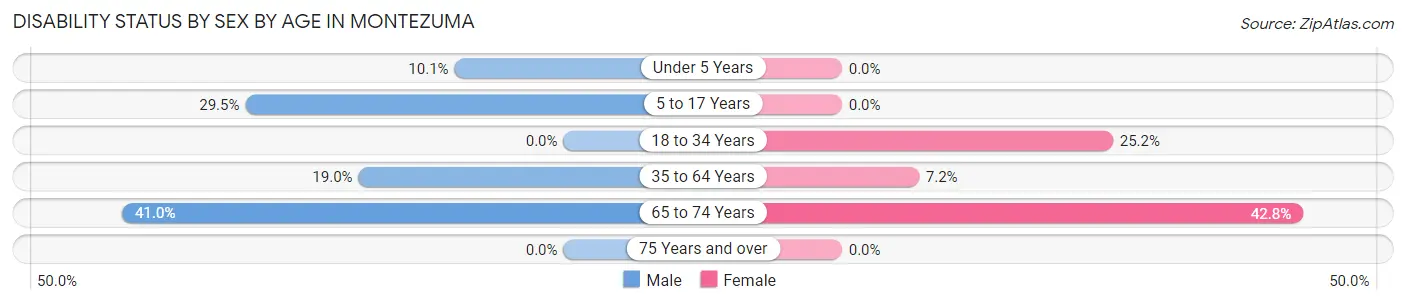
| Age Bracket | Male | Female |
| Under 5 Years | 9 (10.1%) | 0 (0.0%) |
| 5 to 17 Years | 67 (29.5%) | 0 (0.0%) |
| 18 to 34 Years | 0 (0.0%) | 82 (25.2%) |
| 35 to 64 Years | 105 (19.0%) | 48 (7.1%) |
| 65 to 74 Years | 77 (41.0%) | 107 (42.8%) |
| 75 Years and over | 0 (0.0%) | 0 (0.0%) |
Disability Class by Sex by Age in Montezuma
Disability Class: Hearing Difficulty
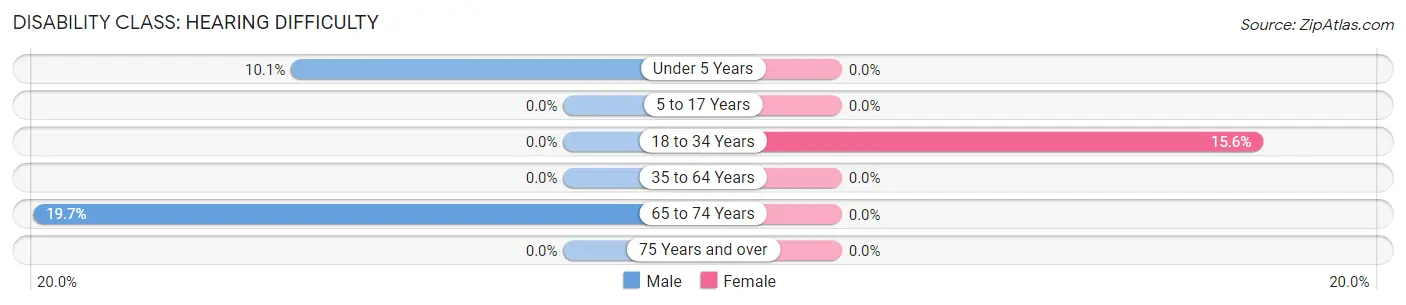
| Age Bracket | Male | Female |
| Under 5 Years | 9 (10.1%) | 0 (0.0%) |
| 5 to 17 Years | 0 (0.0%) | 0 (0.0%) |
| 18 to 34 Years | 0 (0.0%) | 51 (15.6%) |
| 35 to 64 Years | 0 (0.0%) | 0 (0.0%) |
| 65 to 74 Years | 37 (19.7%) | 0 (0.0%) |
| 75 Years and over | 0 (0.0%) | 0 (0.0%) |
Disability Class: Vision Difficulty
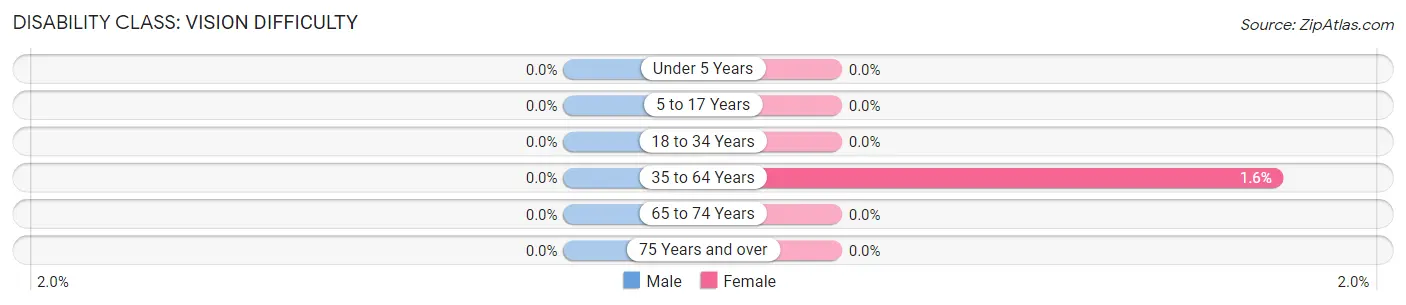
| Age Bracket | Male | Female |
| Under 5 Years | 0 (0.0%) | 0 (0.0%) |
| 5 to 17 Years | 0 (0.0%) | 0 (0.0%) |
| 18 to 34 Years | 0 (0.0%) | 0 (0.0%) |
| 35 to 64 Years | 0 (0.0%) | 11 (1.6%) |
| 65 to 74 Years | 0 (0.0%) | 0 (0.0%) |
| 75 Years and over | 0 (0.0%) | 0 (0.0%) |
Disability Class: Cognitive Difficulty
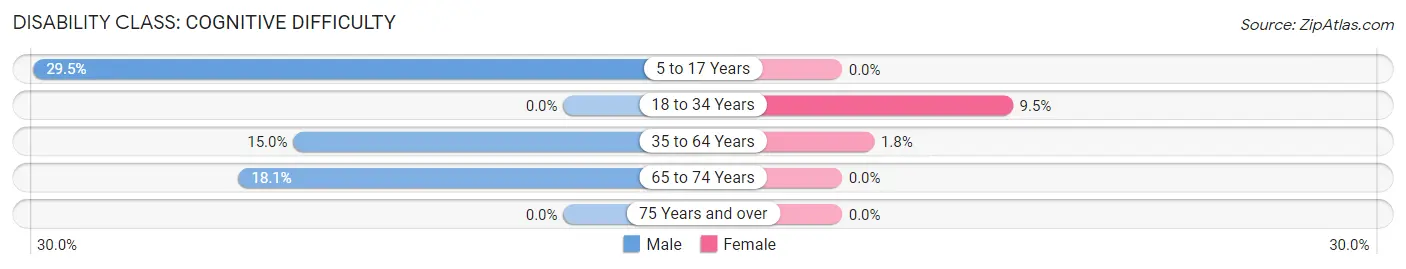
| Age Bracket | Male | Female |
| 5 to 17 Years | 67 (29.5%) | 0 (0.0%) |
| 18 to 34 Years | 0 (0.0%) | 31 (9.5%) |
| 35 to 64 Years | 83 (15.0%) | 12 (1.8%) |
| 65 to 74 Years | 34 (18.1%) | 0 (0.0%) |
| 75 Years and over | 0 (0.0%) | 0 (0.0%) |
Disability Class: Ambulatory Difficulty
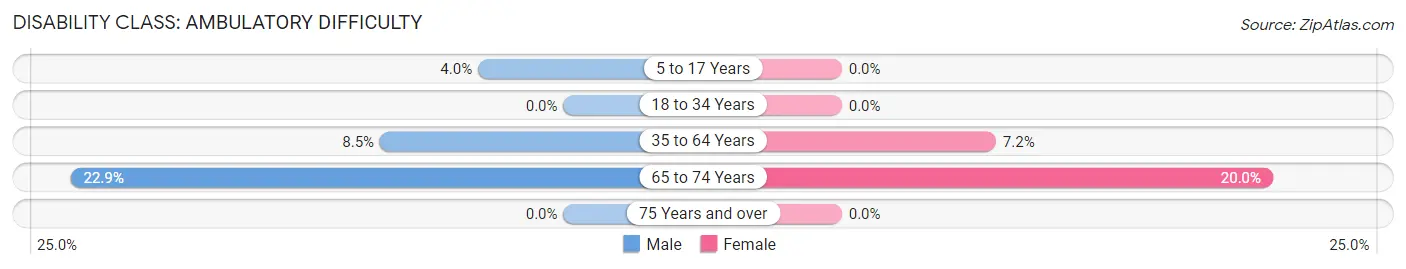
| Age Bracket | Male | Female |
| 5 to 17 Years | 9 (4.0%) | 0 (0.0%) |
| 18 to 34 Years | 0 (0.0%) | 0 (0.0%) |
| 35 to 64 Years | 47 (8.5%) | 48 (7.1%) |
| 65 to 74 Years | 43 (22.9%) | 50 (20.0%) |
| 75 Years and over | 0 (0.0%) | 0 (0.0%) |
Disability Class: Self-Care Difficulty
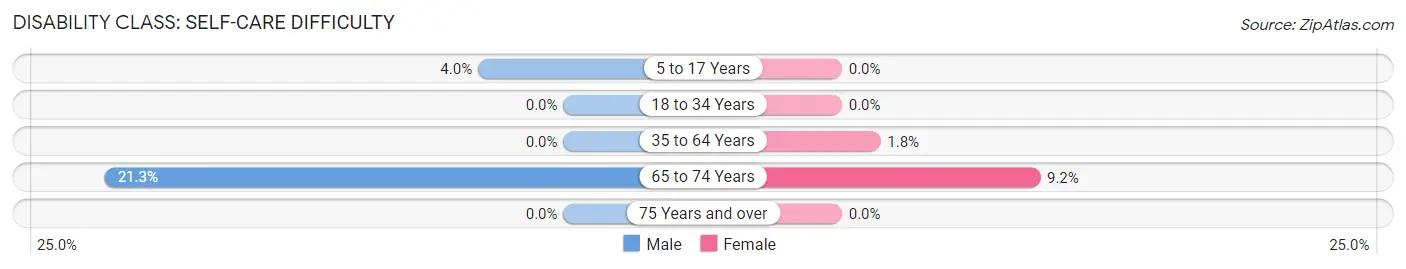
| Age Bracket | Male | Female |
| 5 to 17 Years | 9 (4.0%) | 0 (0.0%) |
| 18 to 34 Years | 0 (0.0%) | 0 (0.0%) |
| 35 to 64 Years | 0 (0.0%) | 12 (1.8%) |
| 65 to 74 Years | 40 (21.3%) | 23 (9.2%) |
| 75 Years and over | 0 (0.0%) | 0 (0.0%) |
Technology Access in Montezuma
Computing Device Access in Montezuma
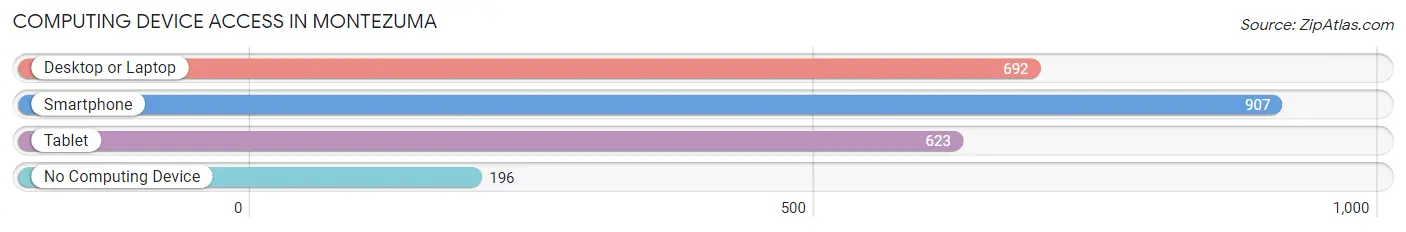
| Device Type | # Households | % Households |
| Desktop or Laptop | 692 | 58.4% |
| Smartphone | 907 | 76.5% |
| Tablet | 623 | 52.6% |
| No Computing Device | 196 | 16.5% |
| Total | 1,185 | 100.0% |
Internet Access in Montezuma
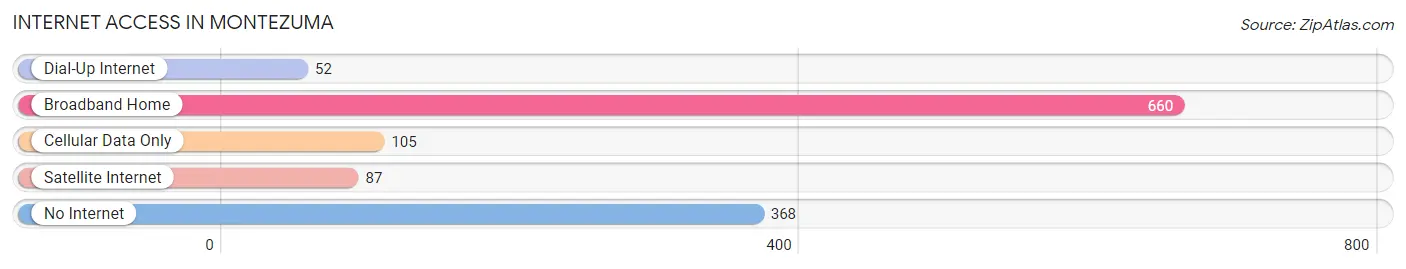
| Internet Type | # Households | % Households |
| Dial-Up Internet | 52 | 4.4% |
| Broadband Home | 660 | 55.7% |
| Cellular Data Only | 105 | 8.9% |
| Satellite Internet | 87 | 7.3% |
| No Internet | 368 | 31.0% |
| Total | 1,185 | 100.0% |
Montezuma Summary
Montezuma, Georgia is a small city located in Macon County, Georgia. It is the county seat of Macon County and is located in the heart of the state, about 90 miles south of Atlanta. The city has a population of approximately 3,000 people and is part of the larger Macon-Warner Robins metropolitan area.
History
Montezuma was founded in 1825 and was named after the Aztec emperor, Montezuma. The city was originally a trading post and was the site of a major battle during the Creek War of 1836. The city was also the site of a major Civil War battle in 1864. After the war, the city was rebuilt and became a major center for cotton production. The city was also home to a major railroad line, which connected it to other cities in the region.
Geography
Montezuma is located in the central part of Georgia, about 90 miles south of Atlanta. The city is situated in the Flint River Valley and is surrounded by rolling hills and forests. The city is located at an elevation of about 500 feet above sea level. The climate in Montezuma is humid subtropical, with hot summers and mild winters.
Economy
Montezuma’s economy is largely based on agriculture and manufacturing. The city is home to several large agricultural operations, including cotton, corn, soybeans, and peanuts. The city is also home to several manufacturing companies, including a paper mill, a furniture factory, and a plastics plant. The city is also home to several retail stores and restaurants.
Demographics
As of the 2010 census, Montezuma had a population of 3,000 people. The racial makeup of the city was 57.3% White, 37.2% African American, 0.3% Native American, 0.7% Asian, and 4.5% from other races. The median household income in Montezuma was $30,000, and the median family income was $35,000. The city’s poverty rate was 22.3%.
Montezuma is a small city with a rich history and a diverse economy. The city is home to several large agricultural operations and manufacturing companies, as well as several retail stores and restaurants. The city has a population of approximately 3,000 people, and the racial makeup of the city is predominantly White and African American. The median household income in Montezuma is $30,000, and the poverty rate is 22.3%.
Common Questions
What is Per Capita Income in Montezuma?
Per Capita income in Montezuma is $20,216.
What is the Median Family Income in Montezuma?
Median Family Income in Montezuma is $57,500.
What is the Median Household income in Montezuma?
Median Household Income in Montezuma is $46,315.
What is Income or Wage Gap in Montezuma?
Income or Wage Gap in Montezuma is 14.2%.
Women in Montezuma earn 85.8 cents for every dollar earned by a man.
What is Inequality or Gini Index in Montezuma?
Inequality or Gini Index in Montezuma is 0.42.
What is the Total Population of Montezuma?
Total Population of Montezuma is 3,040.
What is the Total Male Population of Montezuma?
Total Male Population of Montezuma is 1,469.
What is the Total Female Population of Montezuma?
Total Female Population of Montezuma is 1,571.
What is the Ratio of Males per 100 Females in Montezuma?
There are 93.51 Males per 100 Females in Montezuma.
What is the Ratio of Females per 100 Males in Montezuma?
There are 106.94 Females per 100 Males in Montezuma.
What is the Median Population Age in Montezuma?
Median Population Age in Montezuma is 43.2 Years.
What is the Average Family Size in Montezuma
Average Family Size in Montezuma is 3.3 People.
What is the Average Household Size in Montezuma
Average Household Size in Montezuma is 2.5 People.
How Large is the Labor Force in Montezuma?
There are 1,244 People in the Labor Forcein in Montezuma.
What is the Percentage of People in the Labor Force in Montezuma?
50.3% of People are in the Labor Force in Montezuma.
What is the Unemployment Rate in Montezuma?
Unemployment Rate in Montezuma is 6.4%.