Zip Codes with the Highest Percentage of Population Employed in Food Preparation & Serving in Douglasville, GA
RELATED REPORTS & OPTIONS
Food Preparation & Serving
Douglasville
Compare Zip Codes
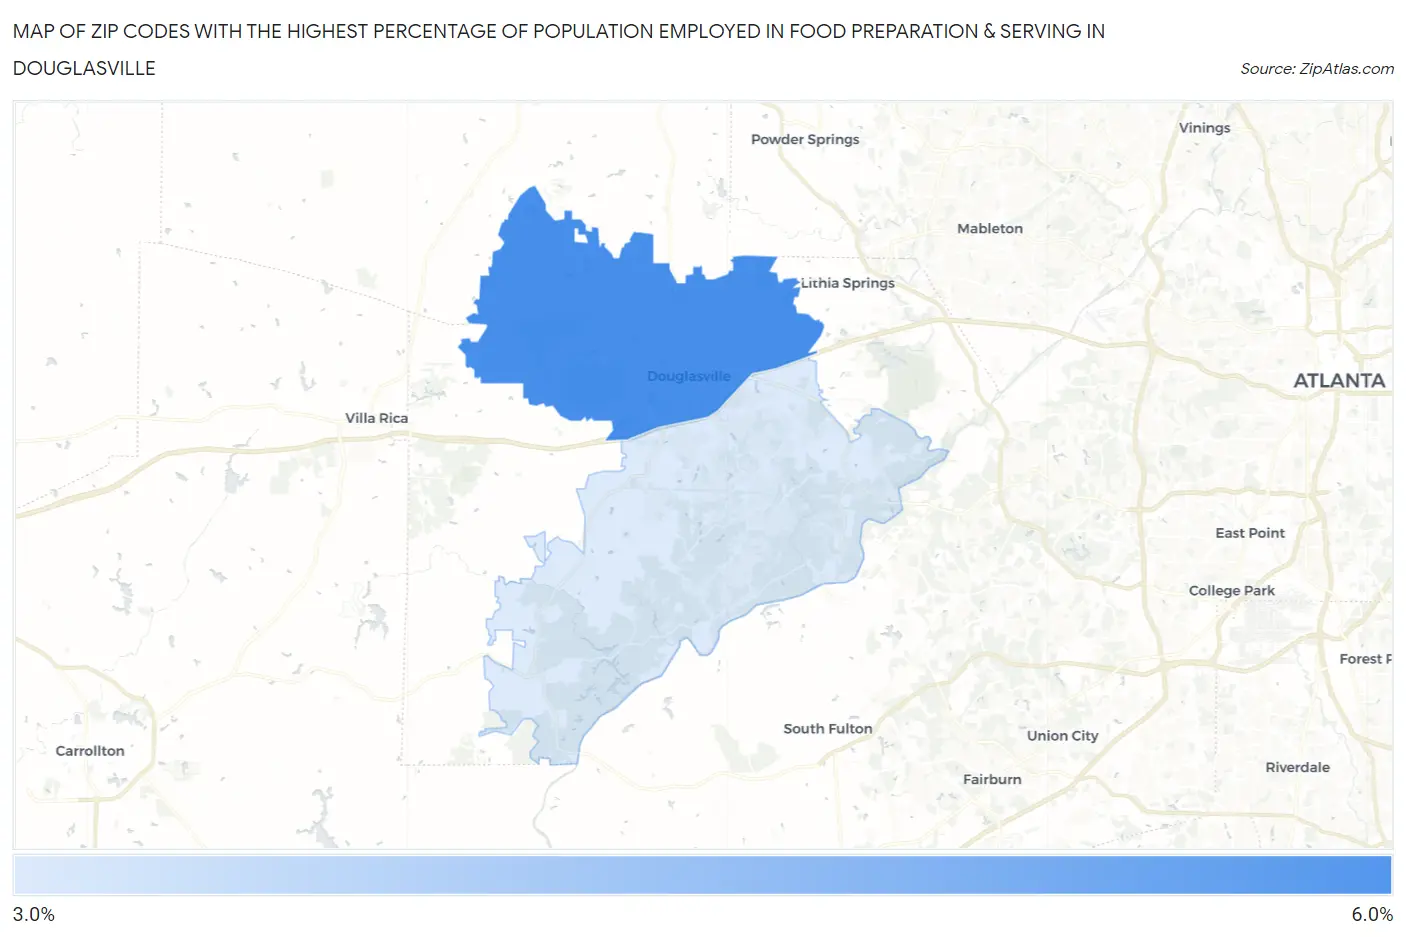
Map of Zip Codes with the Highest Percentage of Population Employed in Food Preparation & Serving in Douglasville
3.6%
5.1%
Zip Codes with the Highest Percentage of Population Employed in Food Preparation & Serving in Douglasville, GA
| Zip Code | % Employed | vs State | vs National | |
| 1. | 30134 | 5.1% | 5.1%(-0.039)#285 | 5.3%(-0.180)#12,522 |
| 2. | 30135 | 3.6% | 5.1%(-1.56)#450 | 5.3%(-1.70)#18,844 |
1
Common Questions
What are the Top Zip Codes with the Highest Percentage of Population Employed in Food Preparation & Serving in Douglasville, GA?
Top Zip Codes with the Highest Percentage of Population Employed in Food Preparation & Serving in Douglasville, GA are:
What zip code has the Highest Percentage of Population Employed in Food Preparation & Serving in Douglasville, GA?
30134 has the Highest Percentage of Population Employed in Food Preparation & Serving in Douglasville, GA with 5.1%.
What is the Percentage of Population Employed in Food Preparation & Serving in Douglasville, GA?
Percentage of Population Employed in Food Preparation & Serving in Douglasville is 1.9%.
What is the Percentage of Population Employed in Food Preparation & Serving in Georgia?
Percentage of Population Employed in Food Preparation & Serving in Georgia is 5.1%.
What is the Percentage of Population Employed in Food Preparation & Serving in the United States?
Percentage of Population Employed in Food Preparation & Serving in the United States is 5.3%.