Sycamore, GA Map & Demographics
Sycamore Map
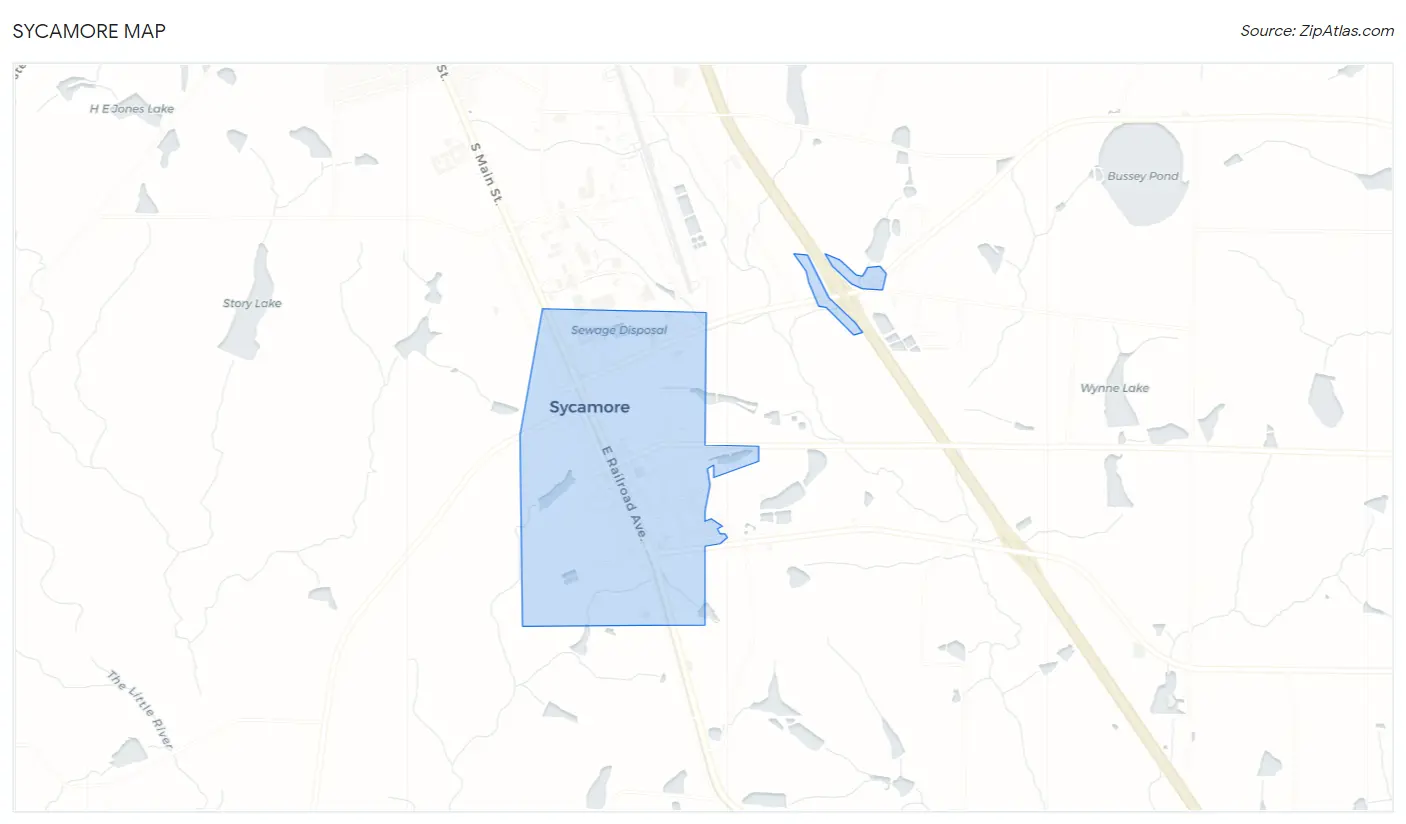
Sycamore Overview
$15,904
PER CAPITA INCOME
$50,583
AVG FAMILY INCOME
$41,538
AVG HOUSEHOLD INCOME
20.4%
WAGE / INCOME GAP [ % ]
79.6¢/ $1
WAGE / INCOME GAP [ $ ]
0.41
INEQUALITY / GINI INDEX
1,223
TOTAL POPULATION
723
MALE POPULATION
500
FEMALE POPULATION
144.60
MALES / 100 FEMALES
69.16
FEMALES / 100 MALES
30.6
MEDIAN AGE
5.2
AVG FAMILY SIZE
4.1
AVG HOUSEHOLD SIZE
420
LABOR FORCE [ PEOPLE ]
45.4%
PERCENT IN LABOR FORCE
16.0%
UNEMPLOYMENT RATE
Sycamore Zip Codes
Sycamore Area Codes
Income in Sycamore
Income Overview in Sycamore
Per Capita Income in Sycamore is $15,904, while median incomes of families and households are $50,583 and $41,538 respectively.
| Characteristic | Number | Measure |
| Per Capita Income | 1,223 | $15,904 |
| Median Family Income | 171 | $50,583 |
| Mean Family Income | 171 | $57,268 |
| Median Household Income | 244 | $41,538 |
| Mean Household Income | 244 | $47,927 |
| Income Deficit | 171 | $0 |
| Wage / Income Gap (%) | 1,223 | 20.38% |
| Wage / Income Gap ($) | 1,223 | 79.62¢ per $1 |
| Gini / Inequality Index | 1,223 | 0.41 |
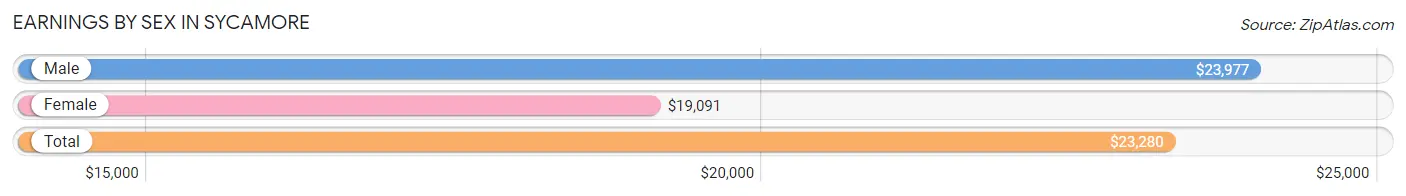
Earnings by Sex in Sycamore
Average Earnings in Sycamore are $23,280, $23,977 for men and $19,091 for women, a difference of 20.4%.
| Sex | Number | Average Earnings |
| Male | 446 (75.3%) | $23,977 |
| Female | 146 (24.7%) | $19,091 |
| Total | 592 (100.0%) | $23,280 |
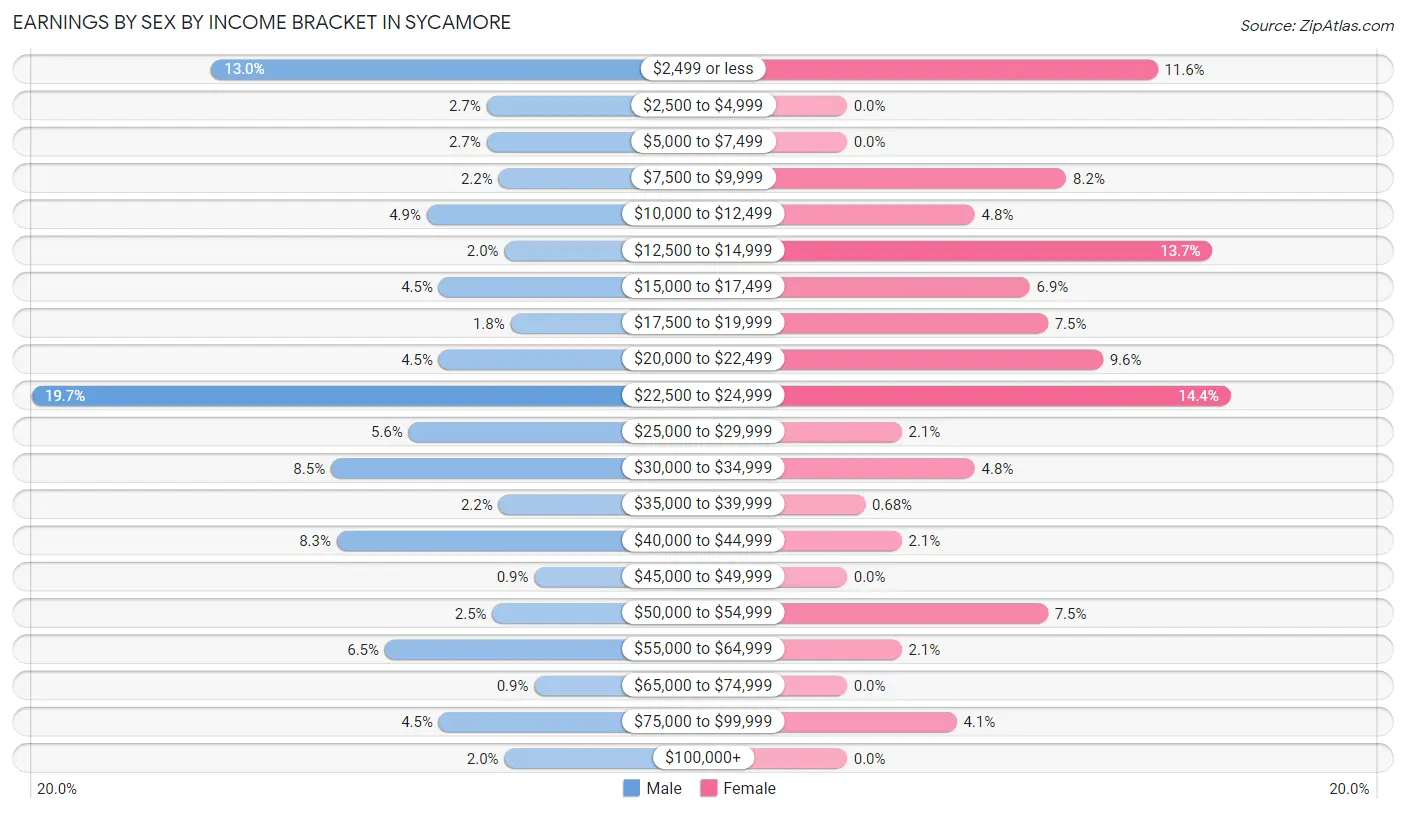
Earnings by Sex by Income Bracket in Sycamore
The most common earnings brackets in Sycamore are $22,500 to $24,999 for men (88 | 19.7%) and $22,500 to $24,999 for women (21 | 14.4%).
| Income | Male | Female |
| $2,499 or less | 58 (13.0%) | 17 (11.6%) |
| $2,500 to $4,999 | 12 (2.7%) | 0 (0.0%) |
| $5,000 to $7,499 | 12 (2.7%) | 0 (0.0%) |
| $7,500 to $9,999 | 10 (2.2%) | 12 (8.2%) |
| $10,000 to $12,499 | 22 (4.9%) | 7 (4.8%) |
| $12,500 to $14,999 | 9 (2.0%) | 20 (13.7%) |
| $15,000 to $17,499 | 20 (4.5%) | 10 (6.9%) |
| $17,500 to $19,999 | 8 (1.8%) | 11 (7.5%) |
| $20,000 to $22,499 | 20 (4.5%) | 14 (9.6%) |
| $22,500 to $24,999 | 88 (19.7%) | 21 (14.4%) |
| $25,000 to $29,999 | 25 (5.6%) | 3 (2.1%) |
| $30,000 to $34,999 | 38 (8.5%) | 7 (4.8%) |
| $35,000 to $39,999 | 10 (2.2%) | 1 (0.7%) |
| $40,000 to $44,999 | 37 (8.3%) | 3 (2.1%) |
| $45,000 to $49,999 | 4 (0.9%) | 0 (0.0%) |
| $50,000 to $54,999 | 11 (2.5%) | 11 (7.5%) |
| $55,000 to $64,999 | 29 (6.5%) | 3 (2.1%) |
| $65,000 to $74,999 | 4 (0.9%) | 0 (0.0%) |
| $75,000 to $99,999 | 20 (4.5%) | 6 (4.1%) |
| $100,000+ | 9 (2.0%) | 0 (0.0%) |
| Total | 446 (100.0%) | 146 (100.0%) |
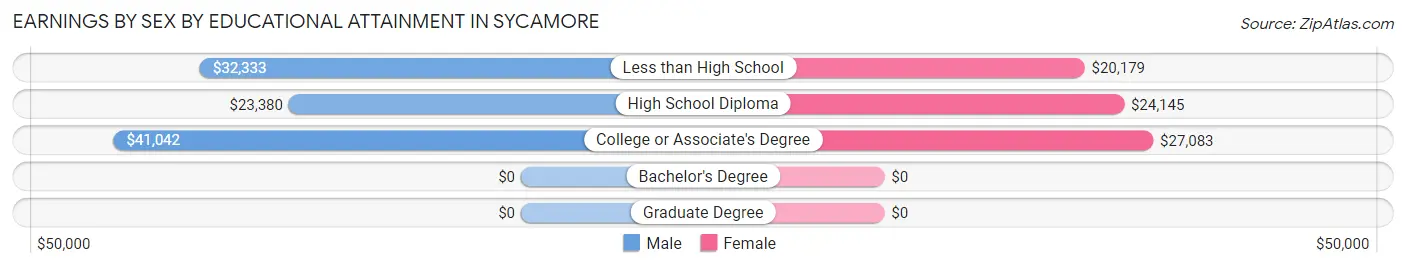
Earnings by Sex by Educational Attainment in Sycamore
Average earnings in Sycamore are $24,851 for men and $22,321 for women, a difference of 10.2%. Men with an educational attainment of college or associate's degree enjoy the highest average annual earnings of $41,042, while those with high school diploma education earn the least with $23,380. Women with an educational attainment of college or associate's degree earn the most with the average annual earnings of $27,083, while those with less than high school education have the smallest earnings of $20,179.
| Educational Attainment | Male Income | Female Income |
| Less than High School | $32,333 | $20,179 |
| High School Diploma | $23,380 | $24,145 |
| College or Associate's Degree | $41,042 | $27,083 |
| Bachelor's Degree | - | - |
| Graduate Degree | - | - |
| Total | $24,851 | $22,321 |
Family Income in Sycamore
Family Income Brackets in Sycamore
According to the Sycamore family income data, there are 46 families falling into the $50,000 to $74,999 income range, which is the most common income bracket and makes up 26.9% of all families.
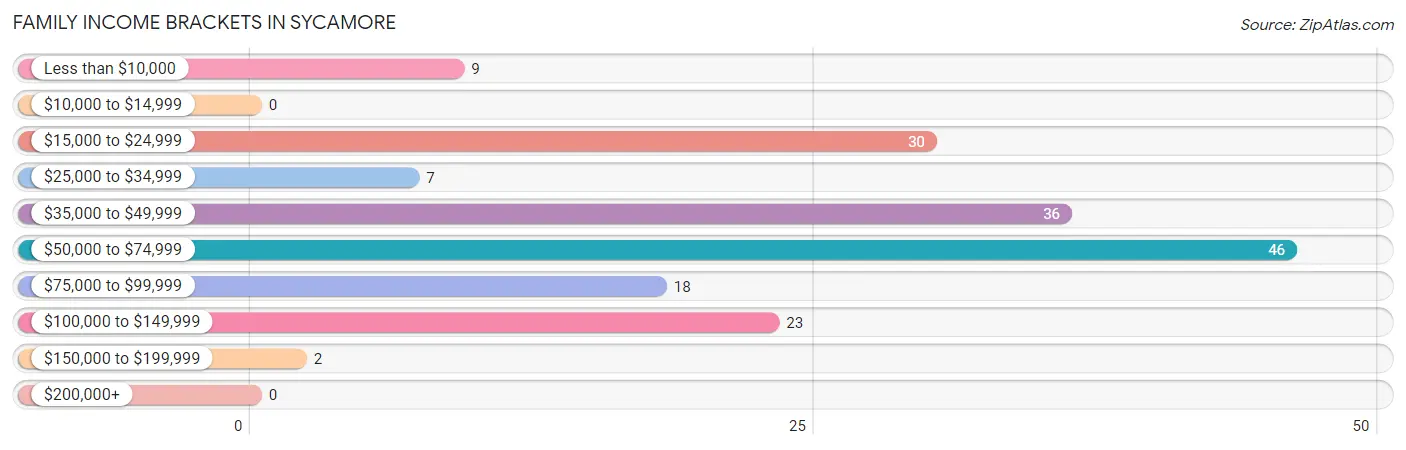
| Income Bracket | # Families | % Families |
| Less than $10,000 | 9 | 5.3% |
| $10,000 to $14,999 | 0 | 0.0% |
| $15,000 to $24,999 | 30 | 17.5% |
| $25,000 to $34,999 | 7 | 4.1% |
| $35,000 to $49,999 | 36 | 21.1% |
| $50,000 to $74,999 | 46 | 26.9% |
| $75,000 to $99,999 | 18 | 10.5% |
| $100,000 to $149,999 | 23 | 13.5% |
| $150,000 to $199,999 | 2 | 1.2% |
| $200,000+ | 0 | 0.0% |
Family Income by Famaliy Size in Sycamore
5-person families (17 | 9.9%) account for the highest median family income in Sycamore with $71,250 per family, while 5-person families (17 | 9.9%) have the highest median income of $14,250 per family member.
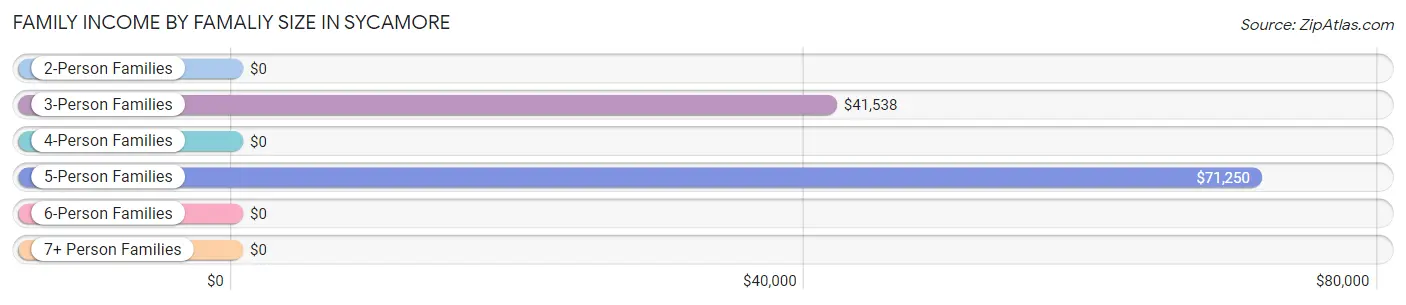
| Income Bracket | # Families | Median Income |
| 2-Person Families | 48 (28.1%) | $0 |
| 3-Person Families | 24 (14.0%) | $41,538 |
| 4-Person Families | 51 (29.8%) | $0 |
| 5-Person Families | 17 (9.9%) | $71,250 |
| 6-Person Families | 23 (13.5%) | $0 |
| 7+ Person Families | 8 (4.7%) | $0 |
| Total | 171 (100.0%) | $50,583 |
Family Income by Number of Earners in Sycamore
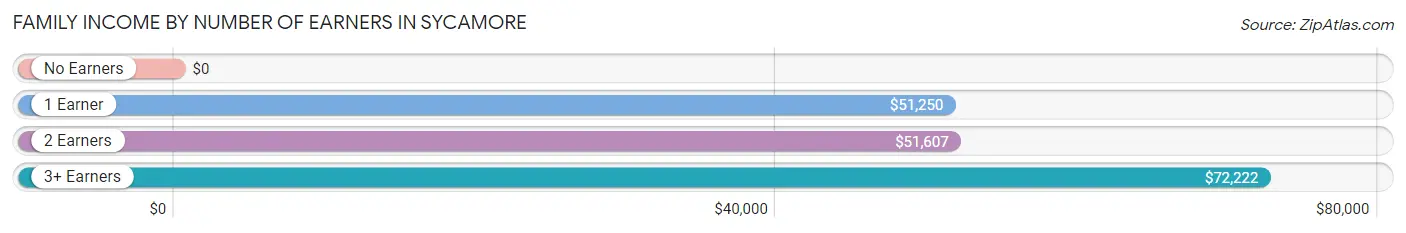
| Number of Earners | # Families | Median Income |
| No Earners | 28 (16.4%) | $0 |
| 1 Earner | 37 (21.6%) | $51,250 |
| 2 Earners | 70 (40.9%) | $51,607 |
| 3+ Earners | 36 (21.0%) | $72,222 |
| Total | 171 (100.0%) | $50,583 |
Household Income in Sycamore
Household Income Brackets in Sycamore
With 68 households falling in the category, the $50,000 to $74,999 income range is the most frequent in Sycamore, accounting for 27.9% of all households.
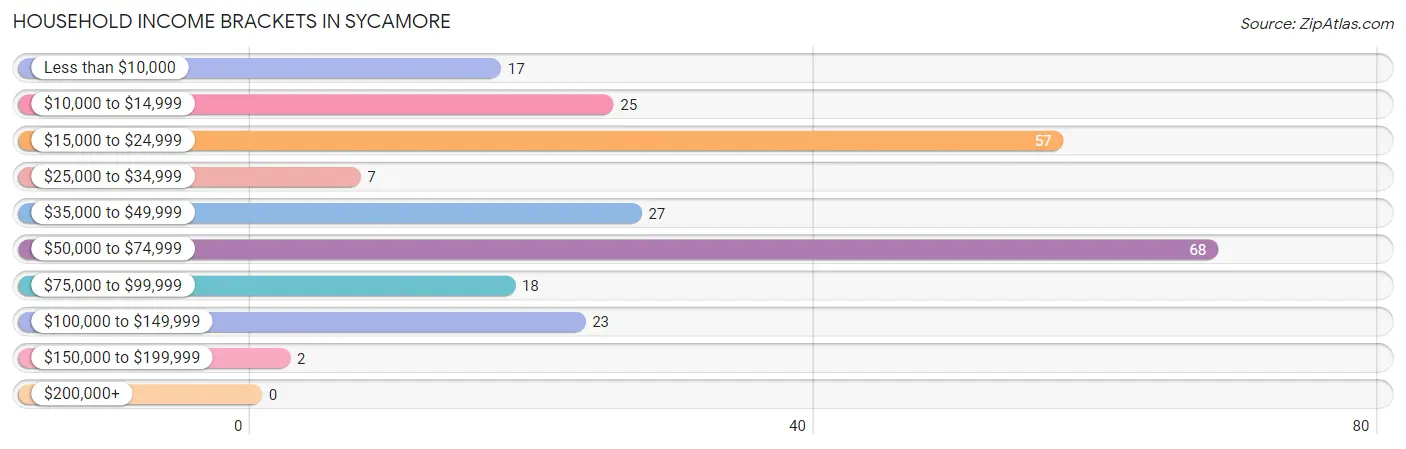
| Income Bracket | # Households | % Households |
| Less than $10,000 | 17 | 7.0% |
| $10,000 to $14,999 | 25 | 10.2% |
| $15,000 to $24,999 | 57 | 23.4% |
| $25,000 to $34,999 | 7 | 2.9% |
| $35,000 to $49,999 | 27 | 11.1% |
| $50,000 to $74,999 | 68 | 27.9% |
| $75,000 to $99,999 | 18 | 7.4% |
| $100,000 to $149,999 | 23 | 9.4% |
| $150,000 to $199,999 | 2 | 0.8% |
| $200,000+ | 0 | 0.0% |
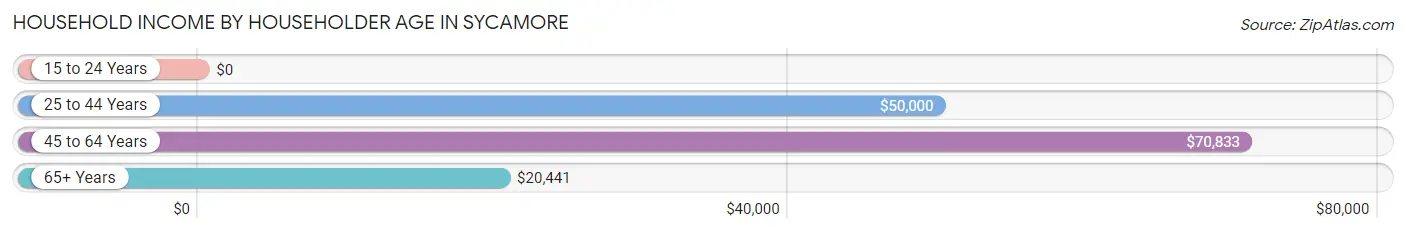
Household Income by Householder Age in Sycamore
The median household income in Sycamore is $41,538, with the highest median household income of $70,833 found in the 45 to 64 years age bracket for the primary householder. A total of 86 households (35.2%) fall into this category. Meanwhile, the 15 to 24 years age bracket for the primary householder has the lowest median household income of $0, with 10 households (4.1%) in this group.
| Income Bracket | # Households | Median Income |
| 15 to 24 Years | 10 (4.1%) | $0 |
| 25 to 44 Years | 82 (33.6%) | $50,000 |
| 45 to 64 Years | 86 (35.2%) | $70,833 |
| 65+ Years | 66 (27.1%) | $20,441 |
| Total | 244 (100.0%) | $41,538 |
Poverty in Sycamore
Income Below Poverty by Sex and Age in Sycamore
With 28.0% poverty level for males and 26.6% for females among the residents of Sycamore, 5 year old males and 12 to 14 year old females are the most vulnerable to poverty, with 8 males (100.0%) and 24 females (85.7%) in their respective age groups living below the poverty level.
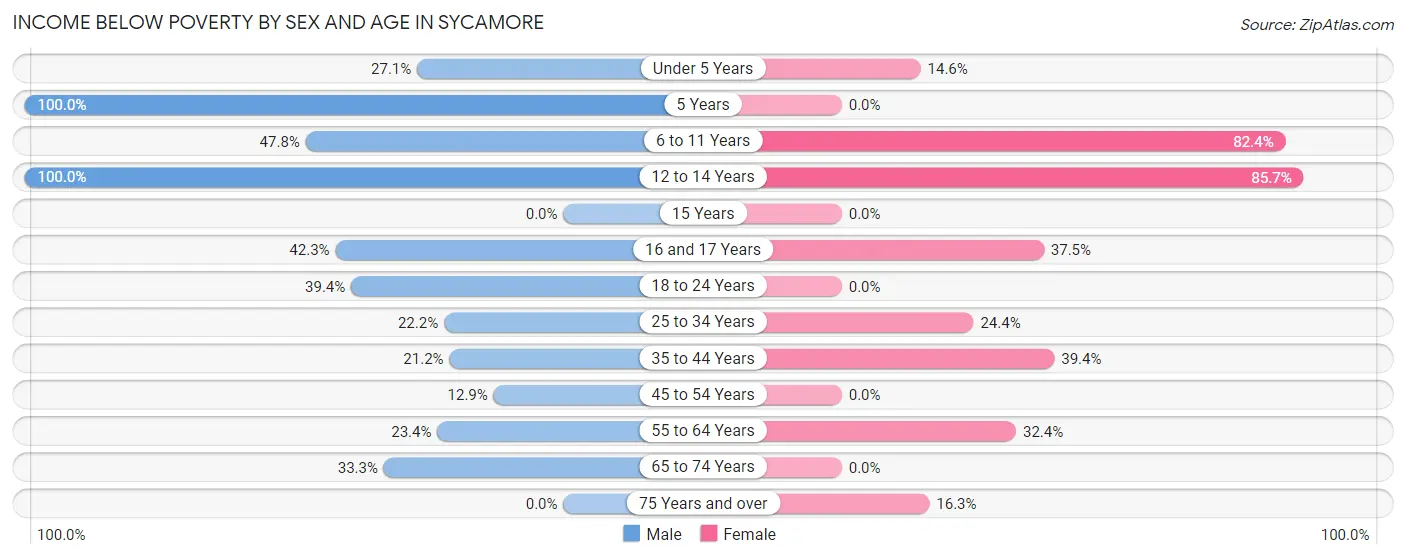
| Age Bracket | Male | Female |
| Under 5 Years | 19 (27.1%) | 12 (14.6%) |
| 5 Years | 8 (100.0%) | 0 (0.0%) |
| 6 to 11 Years | 22 (47.8%) | 28 (82.4%) |
| 12 to 14 Years | 3 (100.0%) | 24 (85.7%) |
| 15 Years | 0 (0.0%) | 0 (0.0%) |
| 16 and 17 Years | 22 (42.3%) | 6 (37.5%) |
| 18 to 24 Years | 13 (39.4%) | 0 (0.0%) |
| 25 to 34 Years | 41 (22.2%) | 11 (24.4%) |
| 35 to 44 Years | 11 (21.1%) | 28 (39.4%) |
| 45 to 54 Years | 11 (12.9%) | 0 (0.0%) |
| 55 to 64 Years | 11 (23.4%) | 11 (32.4%) |
| 65 to 74 Years | 11 (33.3%) | 0 (0.0%) |
| 75 Years and over | 0 (0.0%) | 13 (16.3%) |
| Total | 172 (28.0%) | 133 (26.6%) |
Income Above Poverty by Sex and Age in Sycamore
According to the poverty statistics in Sycamore, males aged 45 to 54 years and females aged 5 years are the age groups that are most secure financially, with 87.1% of males and 100.0% of females in these age groups living above the poverty line.
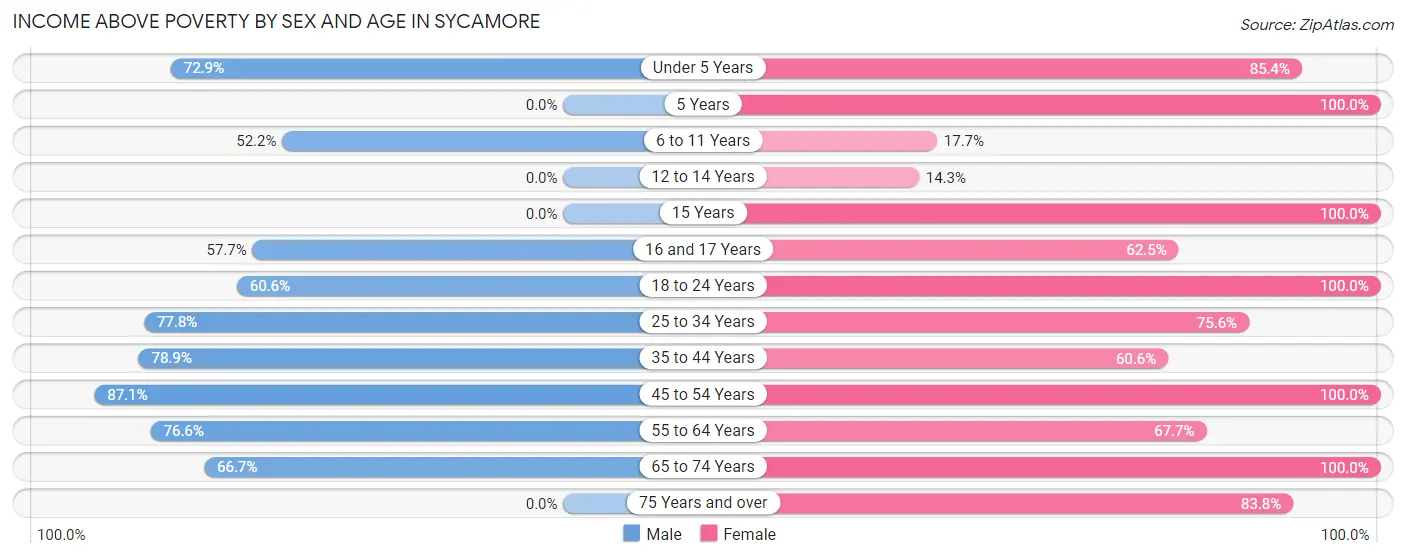
| Age Bracket | Male | Female |
| Under 5 Years | 51 (72.9%) | 70 (85.4%) |
| 5 Years | 0 (0.0%) | 6 (100.0%) |
| 6 to 11 Years | 24 (52.2%) | 6 (17.6%) |
| 12 to 14 Years | 0 (0.0%) | 4 (14.3%) |
| 15 Years | 0 (0.0%) | 21 (100.0%) |
| 16 and 17 Years | 30 (57.7%) | 10 (62.5%) |
| 18 to 24 Years | 20 (60.6%) | 24 (100.0%) |
| 25 to 34 Years | 144 (77.8%) | 34 (75.6%) |
| 35 to 44 Years | 41 (78.8%) | 43 (60.6%) |
| 45 to 54 Years | 74 (87.1%) | 30 (100.0%) |
| 55 to 64 Years | 36 (76.6%) | 23 (67.6%) |
| 65 to 74 Years | 22 (66.7%) | 29 (100.0%) |
| 75 Years and over | 0 (0.0%) | 67 (83.8%) |
| Total | 442 (72.0%) | 367 (73.4%) |
Income Below Poverty Among Married-Couple Families in Sycamore
The poverty statistics for married-couple families in Sycamore show that 13.6% or 15 of the total 110 families live below the poverty line. Families with 5 or more children have the highest poverty rate of 100.0%, comprising of 8 families. On the other hand, families with no children have the lowest poverty rate of 0.0%, which includes 0 families.
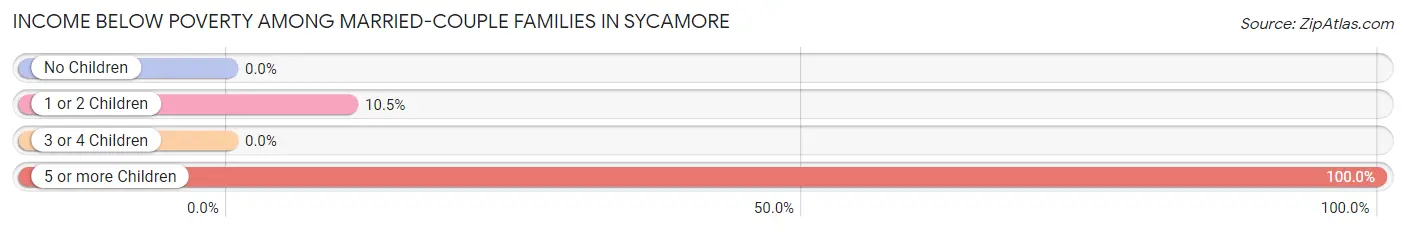
| Children | Above Poverty | Below Poverty |
| No Children | 35 (100.0%) | 0 (0.0%) |
| 1 or 2 Children | 60 (89.5%) | 7 (10.4%) |
| 3 or 4 Children | 0 (0.0%) | 0 (0.0%) |
| 5 or more Children | 0 (0.0%) | 8 (100.0%) |
| Total | 95 (86.4%) | 15 (13.6%) |
Income Below Poverty Among Single-Parent Households in Sycamore
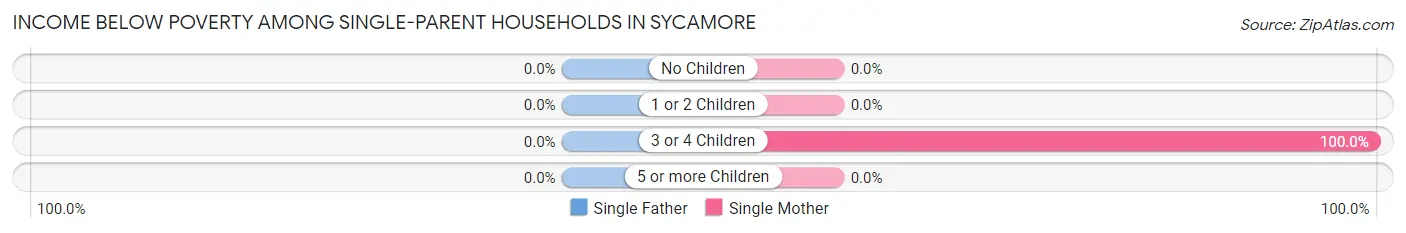
| Children | Single Father | Single Mother |
| No Children | 0 (0.0%) | 0 (0.0%) |
| 1 or 2 Children | 0 (0.0%) | 0 (0.0%) |
| 3 or 4 Children | 0 (0.0%) | 26 (100.0%) |
| 5 or more Children | 0 (0.0%) | 0 (0.0%) |
| Total | 0 (0.0%) | 26 (81.2%) |
Income Below Poverty Among Married-Couple vs Single-Parent Households in Sycamore
The poverty data for Sycamore shows that 15 of the married-couple family households (13.6%) and 26 of the single-parent households (42.6%) are living below the poverty level. Within the married-couple family households, those with 5 or more children have the highest poverty rate, with 8 households (100.0%) falling below the poverty line. Among the single-parent households, those with 3 or 4 children have the highest poverty rate, with 26 household (100.0%) living below poverty.
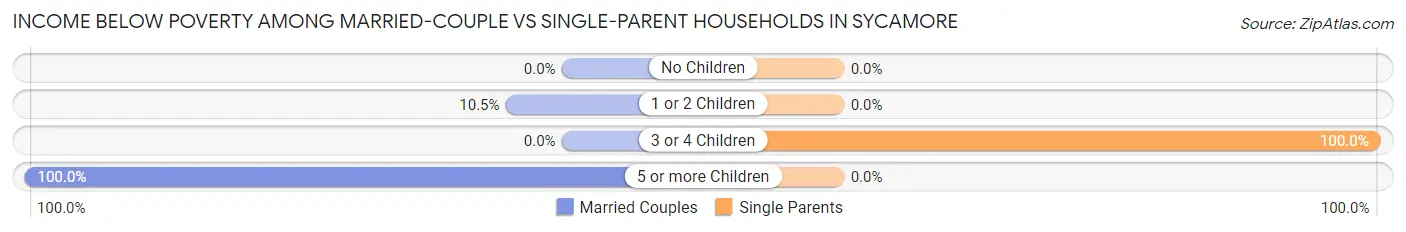
| Children | Married-Couple Families | Single-Parent Households |
| No Children | 0 (0.0%) | 0 (0.0%) |
| 1 or 2 Children | 7 (10.4%) | 0 (0.0%) |
| 3 or 4 Children | 0 (0.0%) | 26 (100.0%) |
| 5 or more Children | 8 (100.0%) | 0 (0.0%) |
| Total | 15 (13.6%) | 26 (42.6%) |
Race in Sycamore
The most populous races in Sycamore are White / Caucasian (933 | 76.3%), Hispanic or Latino (243 | 19.9%), and Black / African American (158 | 12.9%).
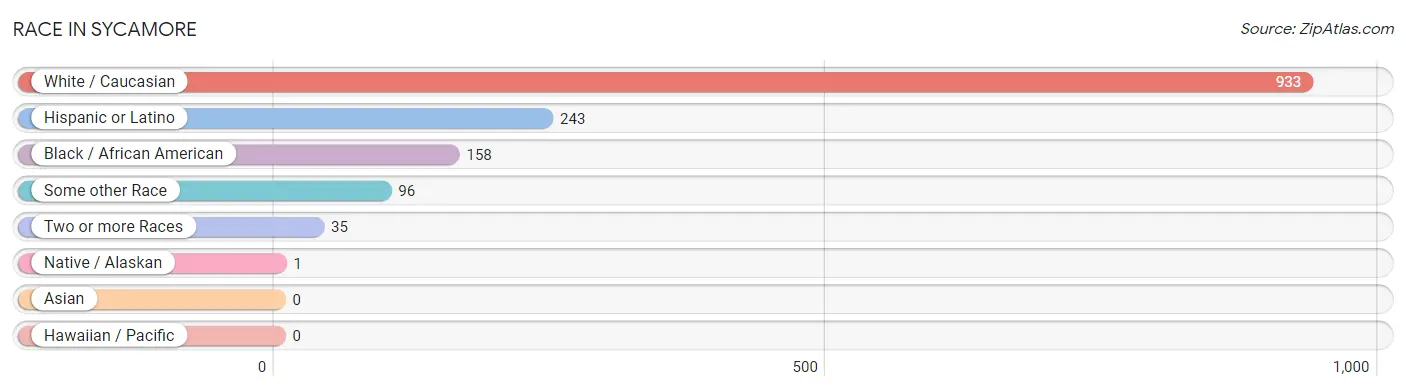
| Race | # Population | % Population |
| Asian | 0 | 0.0% |
| Black / African American | 158 | 12.9% |
| Hawaiian / Pacific | 0 | 0.0% |
| Hispanic or Latino | 243 | 19.9% |
| Native / Alaskan | 1 | 0.1% |
| White / Caucasian | 933 | 76.3% |
| Two or more Races | 35 | 2.9% |
| Some other Race | 96 | 7.9% |
| Total | 1,223 | 100.0% |
Ancestry in Sycamore
The most populous ancestries reported in Sycamore are Mexican (236 | 19.3%), Irish (89 | 7.3%), American (79 | 6.5%), English (72 | 5.9%), and German (54 | 4.4%), together accounting for 43.4% of all Sycamore residents.
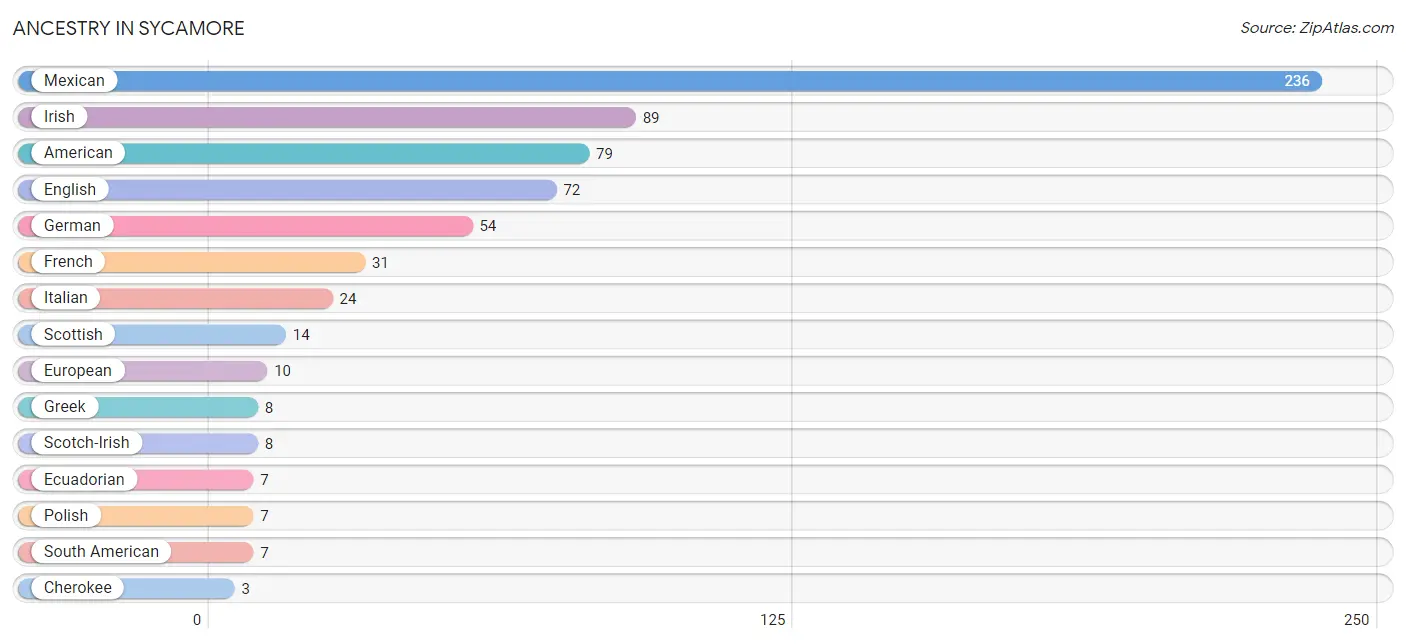
| Ancestry | # Population | % Population |
| African | 2 | 0.2% |
| American | 79 | 6.5% |
| Cherokee | 3 | 0.3% |
| Ecuadorian | 7 | 0.6% |
| English | 72 | 5.9% |
| European | 10 | 0.8% |
| French | 31 | 2.5% |
| German | 54 | 4.4% |
| Greek | 8 | 0.6% |
| Irish | 89 | 7.3% |
| Italian | 24 | 2.0% |
| Mexican | 236 | 19.3% |
| Polish | 7 | 0.6% |
| Scotch-Irish | 8 | 0.6% |
| Scottish | 14 | 1.1% |
| South American | 7 | 0.6% |
| Subsaharan African | 2 | 0.2% | View All 17 Rows |
Immigrants in Sycamore
The most numerous immigrant groups reported in Sycamore came from Latin America (86 | 7.0%), Central America (79 | 6.5%), Mexico (79 | 6.5%), Ecuador (7 | 0.6%), and South America (7 | 0.6%), together accounting for 21.1% of all Sycamore residents.
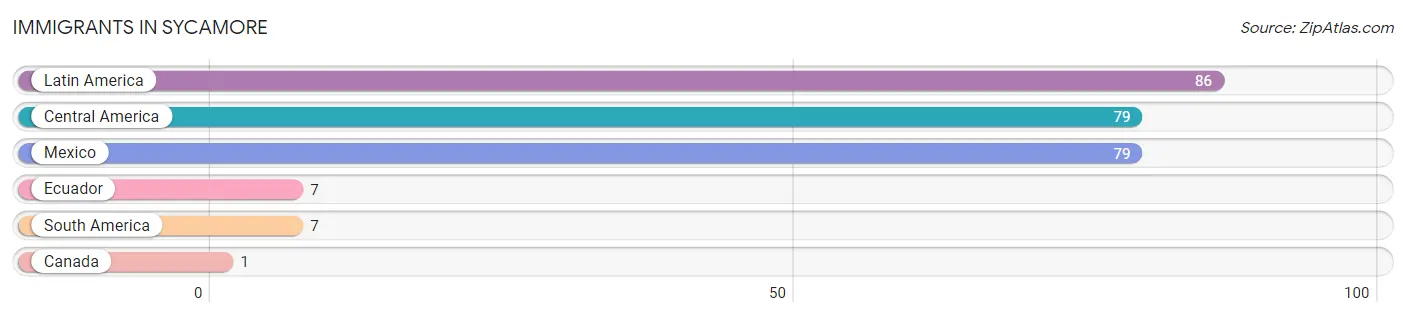
| Immigration Origin | # Population | % Population |
| Canada | 1 | 0.1% |
| Central America | 79 | 6.5% |
| Ecuador | 7 | 0.6% |
| Latin America | 86 | 7.0% |
| Mexico | 79 | 6.5% |
| South America | 7 | 0.6% | View All 6 Rows |
Sex and Age in Sycamore
Sex and Age in Sycamore
The most populous age groups in Sycamore are 30 to 34 Years (146 | 20.2%) for men and Under 5 Years (82 | 16.4%) for women.
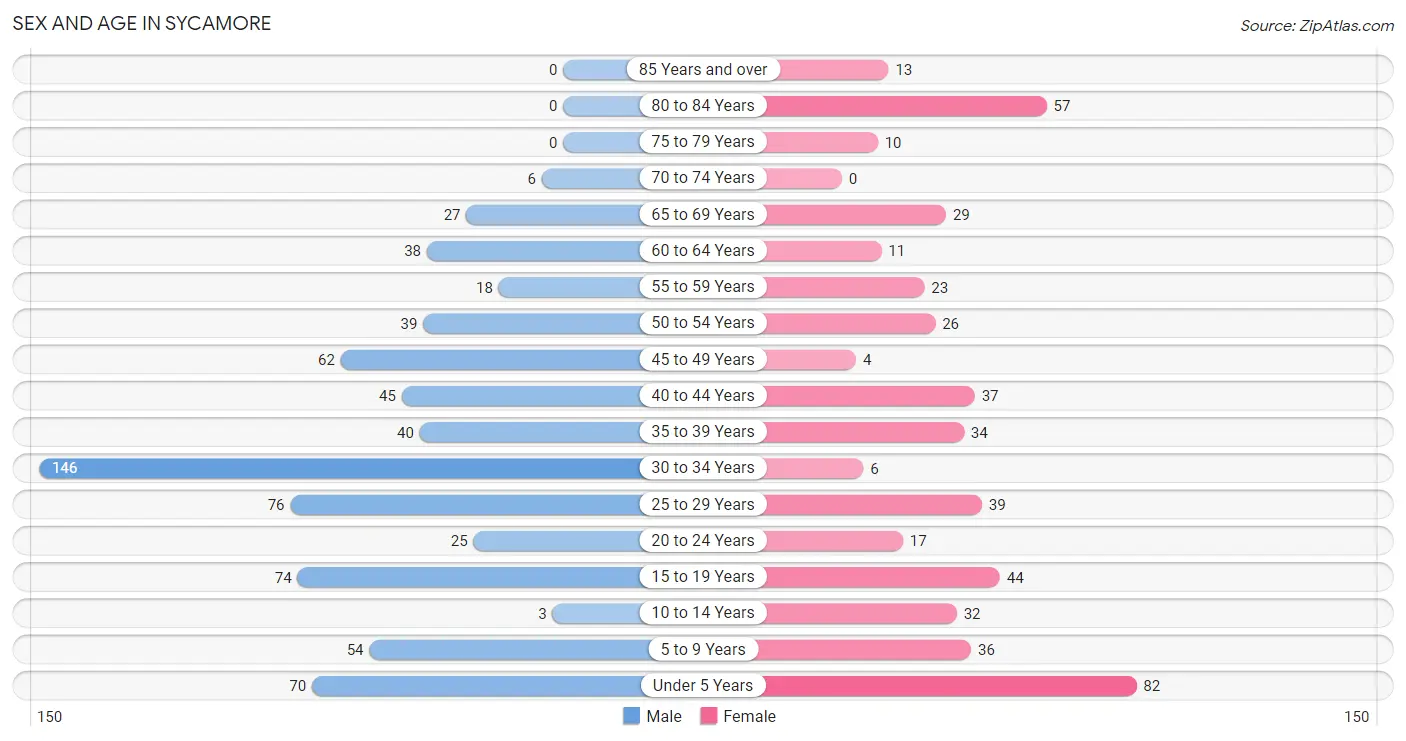
| Age Bracket | Male | Female |
| Under 5 Years | 70 (9.7%) | 82 (16.4%) |
| 5 to 9 Years | 54 (7.5%) | 36 (7.2%) |
| 10 to 14 Years | 3 (0.4%) | 32 (6.4%) |
| 15 to 19 Years | 74 (10.2%) | 44 (8.8%) |
| 20 to 24 Years | 25 (3.5%) | 17 (3.4%) |
| 25 to 29 Years | 76 (10.5%) | 39 (7.8%) |
| 30 to 34 Years | 146 (20.2%) | 6 (1.2%) |
| 35 to 39 Years | 40 (5.5%) | 34 (6.8%) |
| 40 to 44 Years | 45 (6.2%) | 37 (7.4%) |
| 45 to 49 Years | 62 (8.6%) | 4 (0.8%) |
| 50 to 54 Years | 39 (5.4%) | 26 (5.2%) |
| 55 to 59 Years | 18 (2.5%) | 23 (4.6%) |
| 60 to 64 Years | 38 (5.3%) | 11 (2.2%) |
| 65 to 69 Years | 27 (3.7%) | 29 (5.8%) |
| 70 to 74 Years | 6 (0.8%) | 0 (0.0%) |
| 75 to 79 Years | 0 (0.0%) | 10 (2.0%) |
| 80 to 84 Years | 0 (0.0%) | 57 (11.4%) |
| 85 Years and over | 0 (0.0%) | 13 (2.6%) |
| Total | 723 (100.0%) | 500 (100.0%) |
Families and Households in Sycamore
Median Family Size in Sycamore
The median family size in Sycamore is 5.23 persons per family, with married-couple families (110 | 64.3%) accounting for the largest median family size of 5.94 persons per family. On the other hand, single female/mother families (32 | 18.7%) represent the smallest median family size with 3.88 persons per family.
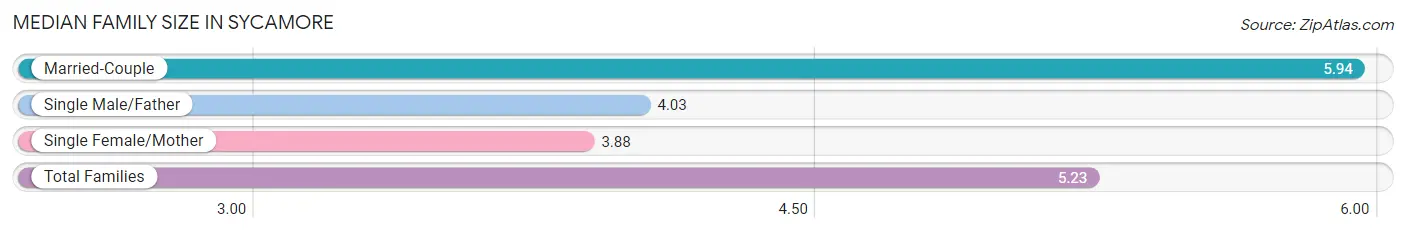
| Family Type | # Families | Family Size |
| Married-Couple | 110 (64.3%) | 5.94 |
| Single Male/Father | 29 (17.0%) | 4.03 |
| Single Female/Mother | 32 (18.7%) | 3.88 |
| Total Families | 171 (100.0%) | 5.23 |
Median Household Size in Sycamore
The median household size in Sycamore is 4.06 persons per household, with married-couple households (110 | 45.1%) accounting for the largest median household size of 6.03 persons per household. non-family households (73 | 29.9%) represent the smallest median household size with 1.10 persons per household.
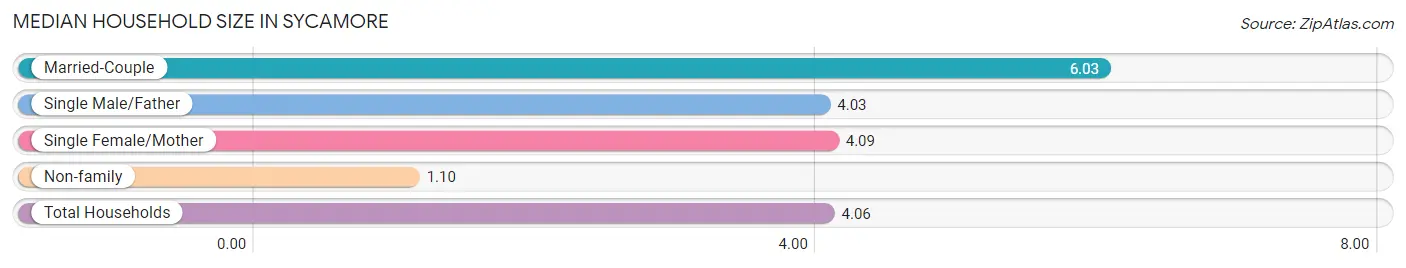
| Household Type | # Households | Household Size |
| Married-Couple | 110 (45.1%) | 6.03 |
| Single Male/Father | 29 (11.9%) | 4.03 |
| Single Female/Mother | 32 (13.1%) | 4.09 |
| Non-family | 73 (29.9%) | 1.10 |
| Total Households | 244 (100.0%) | 4.06 |
Household Size by Marriage Status in Sycamore
Out of a total of 244 households in Sycamore, 171 (70.1%) are family households, while 73 (29.9%) are nonfamily households. The most numerous type of family households are 4-person households, comprising 51, and the most common type of nonfamily households are 1-person households, comprising 65.
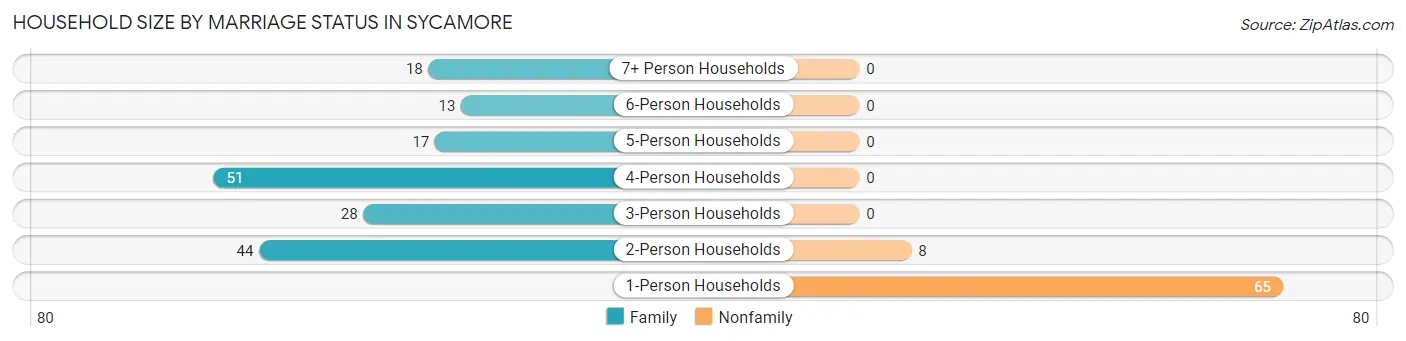
| Household Size | Family Households | Nonfamily Households |
| 1-Person Households | - | 65 (26.6%) |
| 2-Person Households | 44 (18.0%) | 8 (3.3%) |
| 3-Person Households | 28 (11.5%) | 0 (0.0%) |
| 4-Person Households | 51 (20.9%) | 0 (0.0%) |
| 5-Person Households | 17 (7.0%) | 0 (0.0%) |
| 6-Person Households | 13 (5.3%) | 0 (0.0%) |
| 7+ Person Households | 18 (7.4%) | 0 (0.0%) |
| Total | 171 (70.1%) | 73 (29.9%) |
Female Fertility in Sycamore
Fertility by Age in Sycamore
Average fertility rate in Sycamore is 41.0 births per 1,000 women. Women in the age bracket of 20 to 34 years have the highest fertility rate with 129.0 births per 1,000 women. Women in the age bracket of 20 to 34 years acount for 100.0% of all women with births.
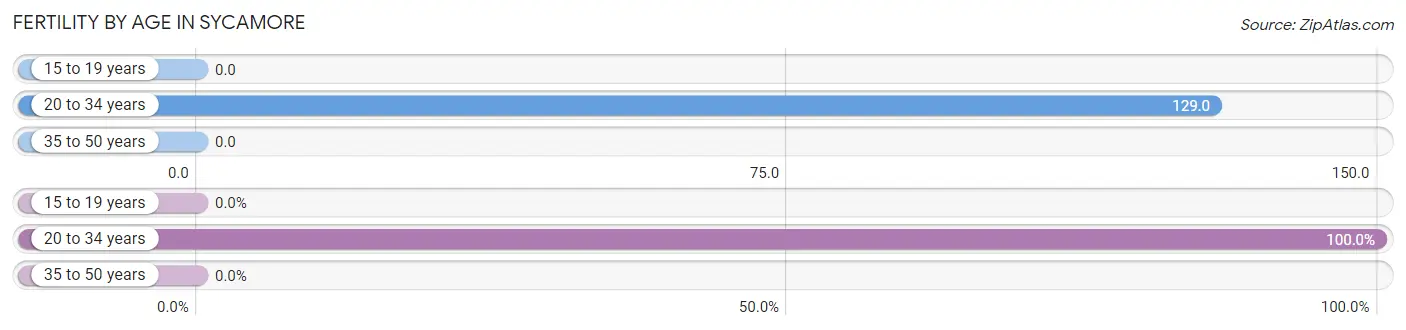
| Age Bracket | Women with Births | Births / 1,000 Women |
| 15 to 19 years | 0 (0.0%) | 0.0 |
| 20 to 34 years | 8 (100.0%) | 129.0 |
| 35 to 50 years | 0 (0.0%) | 0.0 |
| Total | 8 (100.0%) | 41.0 |
Fertility by Age by Marriage Status in Sycamore
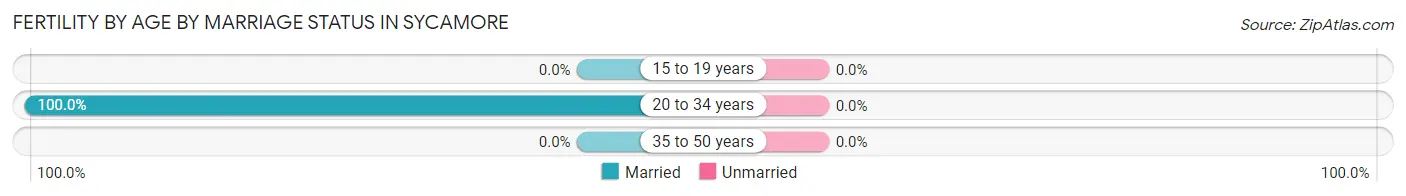
| Age Bracket | Married | Unmarried |
| 15 to 19 years | 0 (0.0%) | 0 (0.0%) |
| 20 to 34 years | 8 (100.0%) | 0 (0.0%) |
| 35 to 50 years | 0 (0.0%) | 0 (0.0%) |
| Total | 8 (100.0%) | 0 (0.0%) |
Fertility by Education in Sycamore
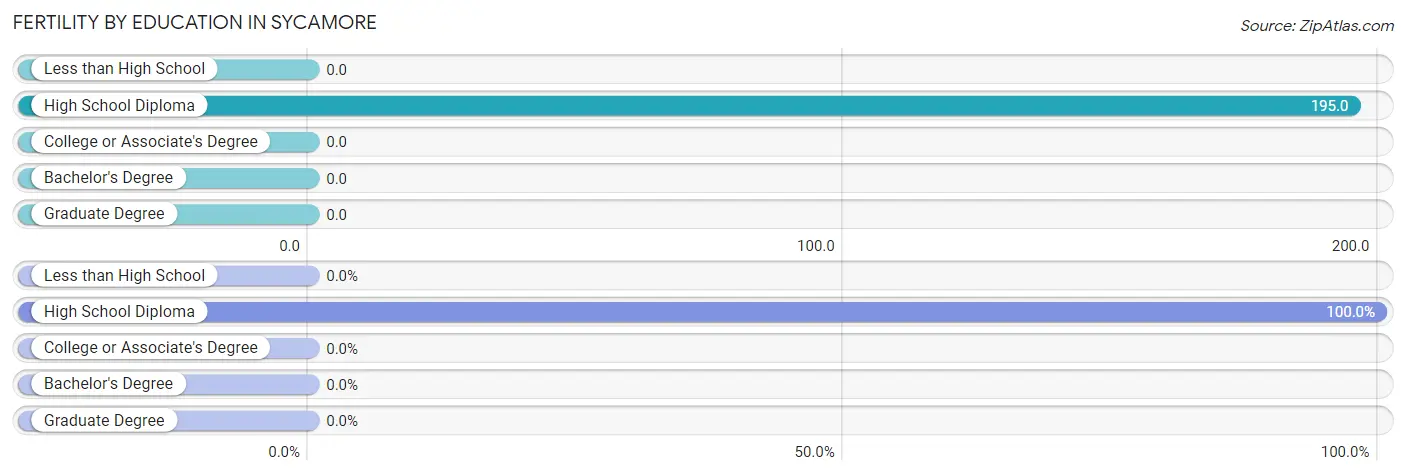
| Educational Attainment | Women with Births | Births / 1,000 Women |
| Less than High School | 0 (0.0%) | 0.0 |
| High School Diploma | 8 (100.0%) | 195.0 |
| College or Associate's Degree | 0 (0.0%) | 0.0 |
| Bachelor's Degree | 0 (0.0%) | 0.0 |
| Graduate Degree | 0 (0.0%) | 0.0 |
| Total | 8 (100.0%) | 41.0 |
Fertility by Education by Marriage Status in Sycamore
| Educational Attainment | Married | Unmarried |
| Less than High School | 0 (0.0%) | 0 (0.0%) |
| High School Diploma | 8 (100.0%) | 0 (0.0%) |
| College or Associate's Degree | 0 (0.0%) | 0 (0.0%) |
| Bachelor's Degree | 0 (0.0%) | 0 (0.0%) |
| Graduate Degree | 0 (0.0%) | 0 (0.0%) |
| Total | 8 (100.0%) | 0 (0.0%) |
Employment Characteristics in Sycamore
Employment by Class of Employer in Sycamore
Among the 348 employed individuals in Sycamore, private company employees (280 | 80.5%), self-employed (not incorporated) (24 | 6.9%), and local government employees (19 | 5.5%) make up the most common classes of employment.
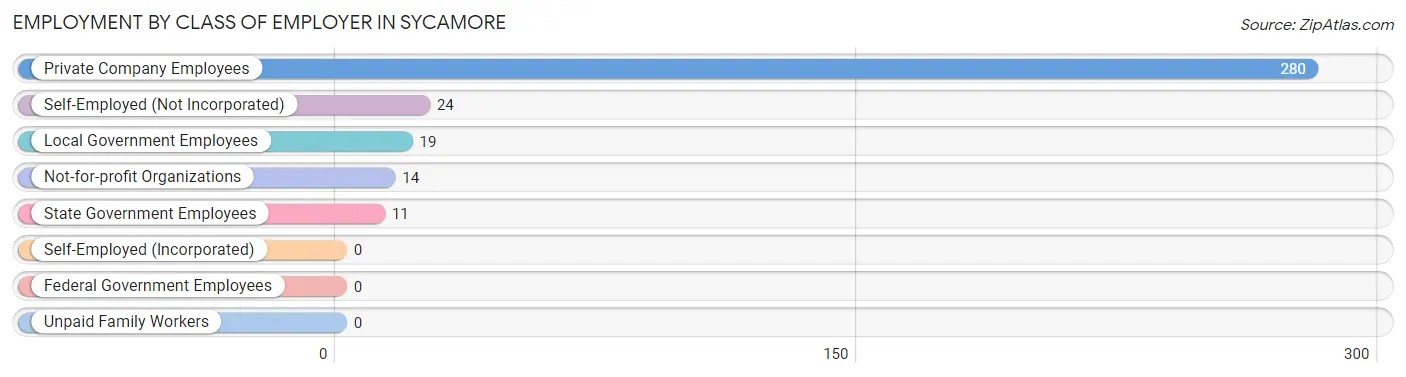
| Employer Class | # Employees | % Employees |
| Private Company Employees | 280 | 80.5% |
| Self-Employed (Incorporated) | 0 | 0.0% |
| Self-Employed (Not Incorporated) | 24 | 6.9% |
| Not-for-profit Organizations | 14 | 4.0% |
| Local Government Employees | 19 | 5.5% |
| State Government Employees | 11 | 3.2% |
| Federal Government Employees | 0 | 0.0% |
| Unpaid Family Workers | 0 | 0.0% |
| Total | 348 | 100.0% |
Employment Status by Age in Sycamore
According to the labor force statistics for Sycamore, out of the total population over 16 years of age (925), 45.4% or 420 individuals are in the labor force, with 16.0% or 67 of them unemployed. The age group with the highest labor force participation rate is 30 to 34 years, with 58.6% or 89 individuals in the labor force. Within the labor force, the 25 to 29 years age range has the highest percentage of unemployed individuals, with 38.1% or 24 of them being unemployed.
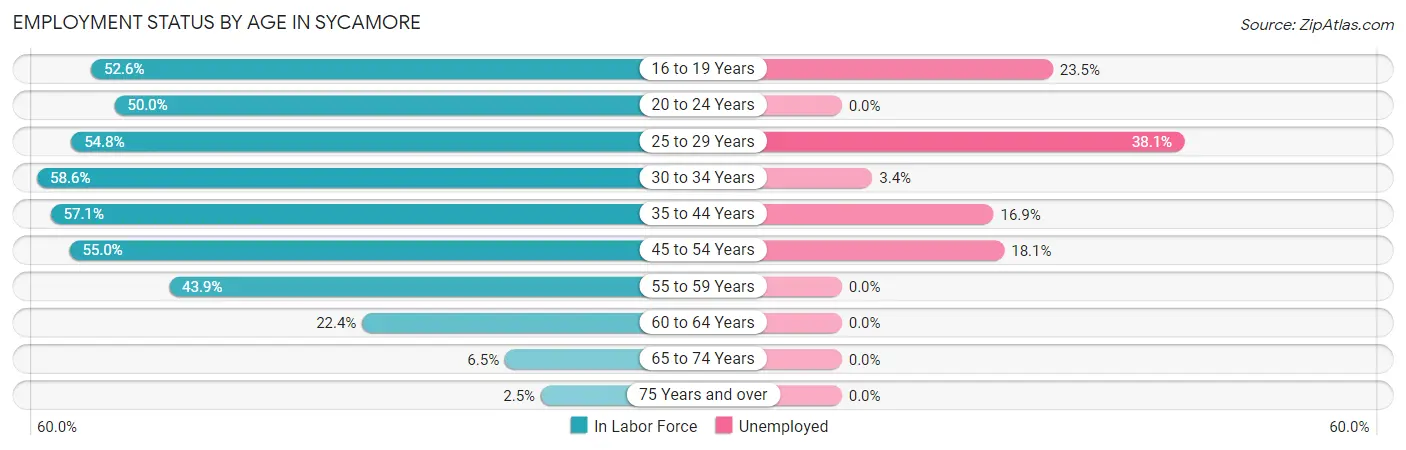
| Age Bracket | In Labor Force | Unemployed |
| 16 to 19 Years | 51 (52.6%) | 12 (23.5%) |
| 20 to 24 Years | 21 (50.0%) | 0 (0.0%) |
| 25 to 29 Years | 63 (54.8%) | 24 (38.1%) |
| 30 to 34 Years | 89 (58.6%) | 3 (3.4%) |
| 35 to 44 Years | 89 (57.1%) | 15 (16.9%) |
| 45 to 54 Years | 72 (55.0%) | 13 (18.1%) |
| 55 to 59 Years | 18 (43.9%) | 0 (0.0%) |
| 60 to 64 Years | 11 (22.4%) | 0 (0.0%) |
| 65 to 74 Years | 4 (6.5%) | 0 (0.0%) |
| 75 Years and over | 2 (2.5%) | 0 (0.0%) |
| Total | 420 (45.4%) | 67 (16.0%) |
Employment Status by Educational Attainment in Sycamore
According to labor force statistics for Sycamore, 53.1% of individuals (342) out of the total population between 25 and 64 years of age (644) are in the labor force, with 16.1% or 55 of them being unemployed. The group with the highest labor force participation rate are those with the educational attainment of college / associate degree, with 65.2% or 90 individuals in the labor force. Within the labor force, individuals with bachelor's degree or higher education have the highest percentage of unemployment, with 35.1% or 13 of them being unemployed.
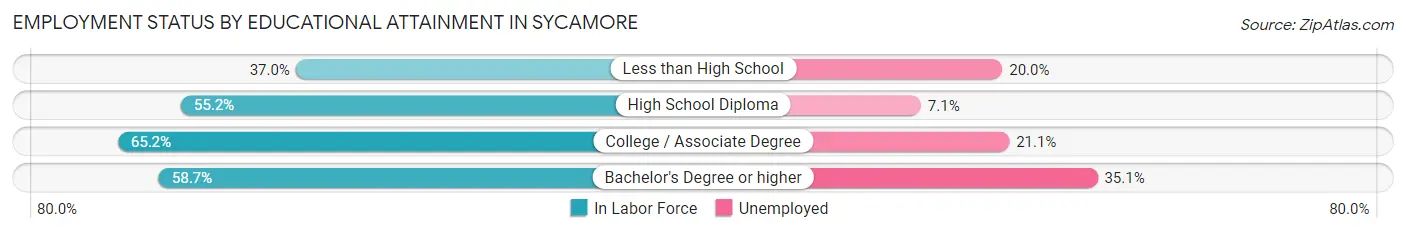
| Educational Attainment | In Labor Force | Unemployed |
| Less than High School | 60 (37.0%) | 32 (20.0%) |
| High School Diploma | 155 (55.2%) | 20 (7.1%) |
| College / Associate Degree | 90 (65.2%) | 29 (21.1%) |
| Bachelor's Degree or higher | 37 (58.7%) | 22 (35.1%) |
| Total | 342 (53.1%) | 104 (16.1%) |
Employment Occupations by Sex in Sycamore
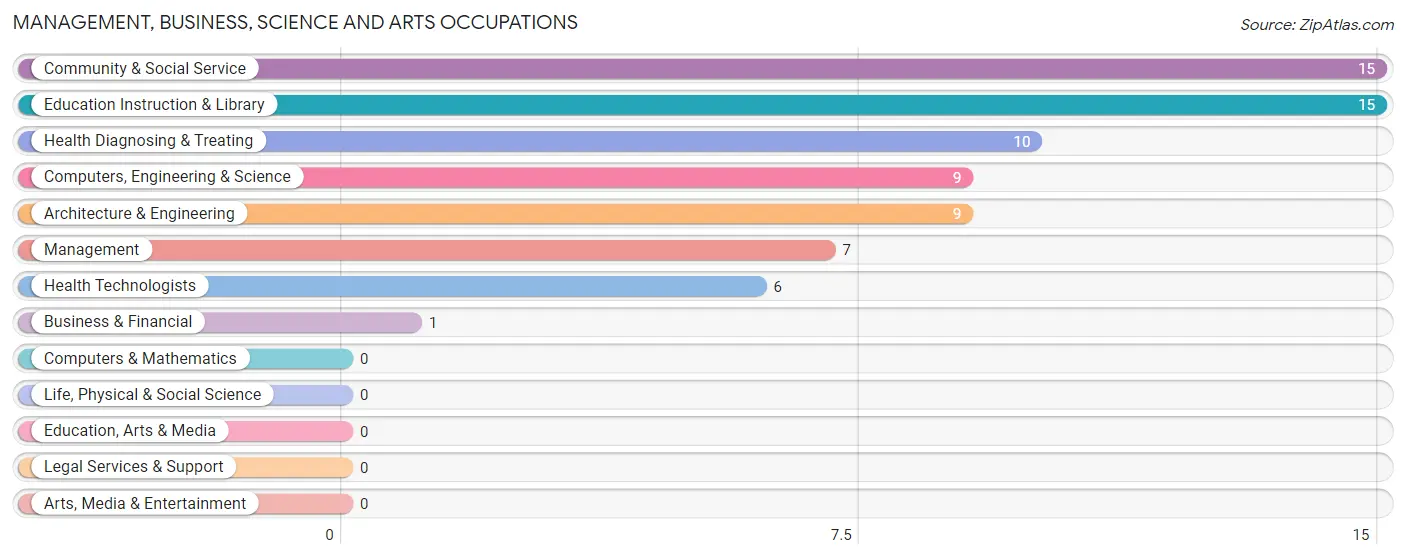
Management, Business, Science and Arts Occupations
The most common Management, Business, Science and Arts occupations in Sycamore are Community & Social Service (15 | 4.3%), Education Instruction & Library (15 | 4.3%), Health Diagnosing & Treating (10 | 2.8%), Computers, Engineering & Science (9 | 2.5%), and Architecture & Engineering (9 | 2.5%).
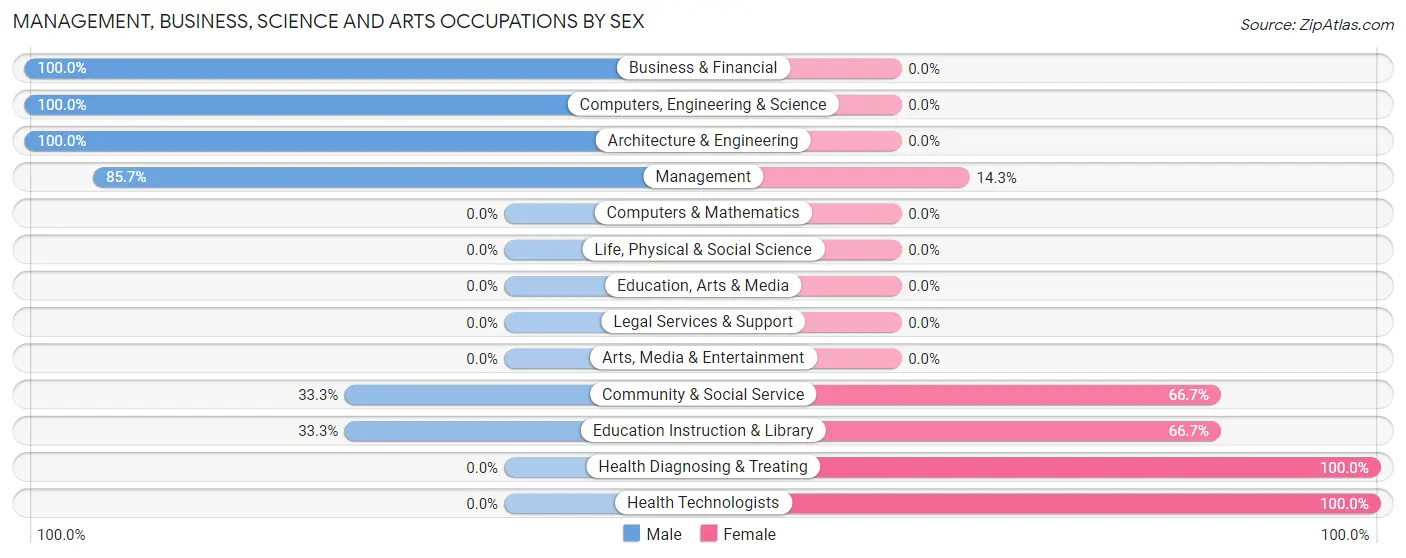
Management, Business, Science and Arts Occupations by Sex
Within the Management, Business, Science and Arts occupations in Sycamore, the most male-oriented occupations are Business & Financial (100.0%), Computers, Engineering & Science (100.0%), and Architecture & Engineering (100.0%), while the most female-oriented occupations are Health Diagnosing & Treating (100.0%), Health Technologists (100.0%), and Community & Social Service (66.7%).
| Occupation | Male | Female |
| Management | 6 (85.7%) | 1 (14.3%) |
| Business & Financial | 1 (100.0%) | 0 (0.0%) |
| Computers, Engineering & Science | 9 (100.0%) | 0 (0.0%) |
| Computers & Mathematics | 0 (0.0%) | 0 (0.0%) |
| Architecture & Engineering | 9 (100.0%) | 0 (0.0%) |
| Life, Physical & Social Science | 0 (0.0%) | 0 (0.0%) |
| Community & Social Service | 5 (33.3%) | 10 (66.7%) |
| Education, Arts & Media | 0 (0.0%) | 0 (0.0%) |
| Legal Services & Support | 0 (0.0%) | 0 (0.0%) |
| Education Instruction & Library | 5 (33.3%) | 10 (66.7%) |
| Arts, Media & Entertainment | 0 (0.0%) | 0 (0.0%) |
| Health Diagnosing & Treating | 0 (0.0%) | 10 (100.0%) |
| Health Technologists | 0 (0.0%) | 6 (100.0%) |
| Total (Category) | 21 (50.0%) | 21 (50.0%) |
| Total (Overall) | 221 (62.6%) | 132 (37.4%) |
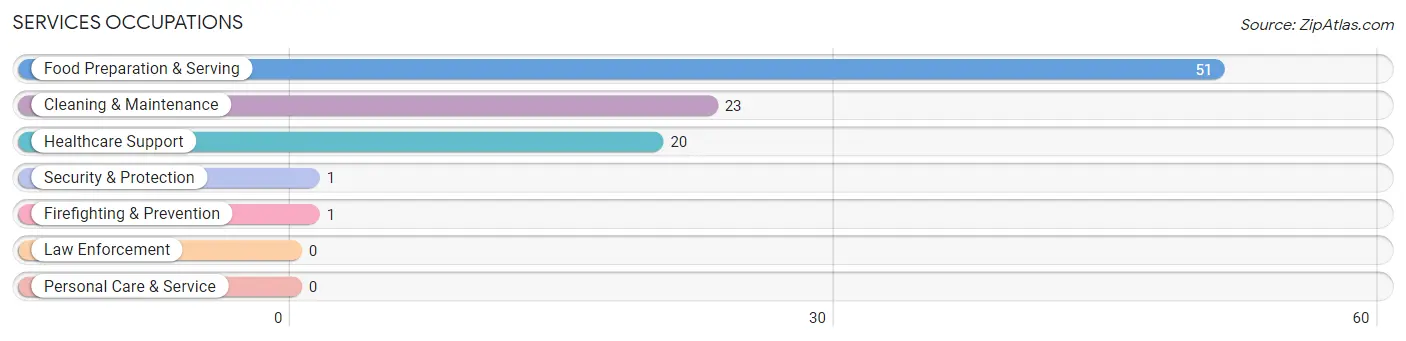
Services Occupations
The most common Services occupations in Sycamore are Food Preparation & Serving (51 | 14.4%), Cleaning & Maintenance (23 | 6.5%), Healthcare Support (20 | 5.7%), Security & Protection (1 | 0.3%), and Firefighting & Prevention (1 | 0.3%).
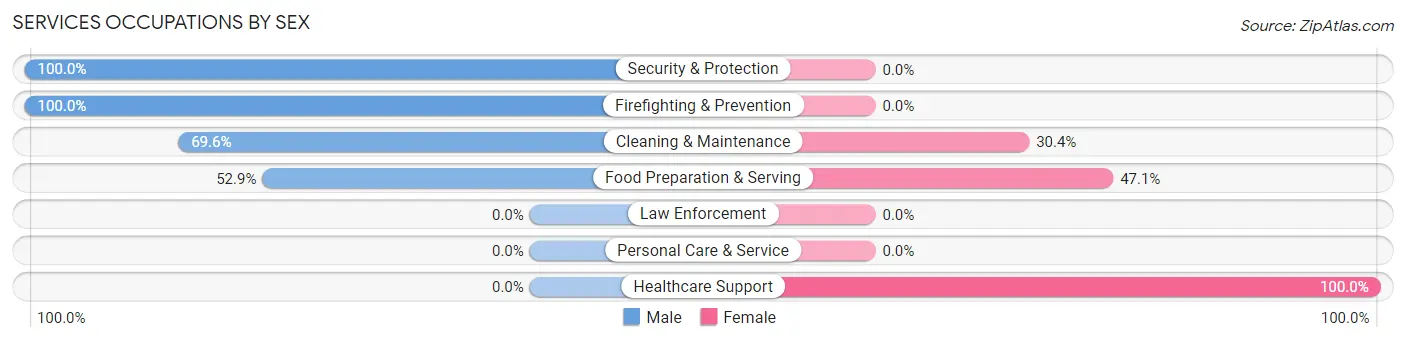
Services Occupations by Sex
Within the Services occupations in Sycamore, the most male-oriented occupations are Security & Protection (100.0%), Firefighting & Prevention (100.0%), and Cleaning & Maintenance (69.6%), while the most female-oriented occupations are Healthcare Support (100.0%), Food Preparation & Serving (47.1%), and Cleaning & Maintenance (30.4%).
| Occupation | Male | Female |
| Healthcare Support | 0 (0.0%) | 20 (100.0%) |
| Security & Protection | 1 (100.0%) | 0 (0.0%) |
| Firefighting & Prevention | 1 (100.0%) | 0 (0.0%) |
| Law Enforcement | 0 (0.0%) | 0 (0.0%) |
| Food Preparation & Serving | 27 (52.9%) | 24 (47.1%) |
| Cleaning & Maintenance | 16 (69.6%) | 7 (30.4%) |
| Personal Care & Service | 0 (0.0%) | 0 (0.0%) |
| Total (Category) | 44 (46.3%) | 51 (53.7%) |
| Total (Overall) | 221 (62.6%) | 132 (37.4%) |
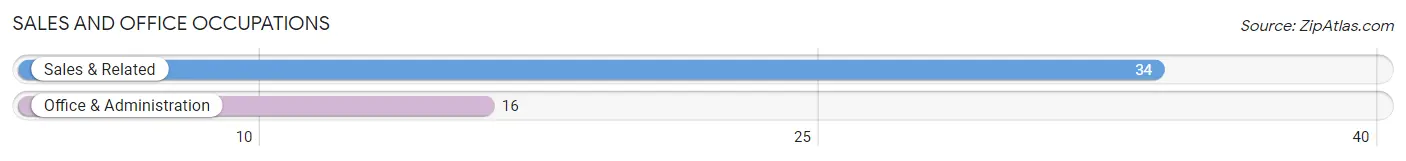
Sales and Office Occupations
The most common Sales and Office occupations in Sycamore are Sales & Related (34 | 9.6%), and Office & Administration (16 | 4.5%).
Sales and Office Occupations by Sex
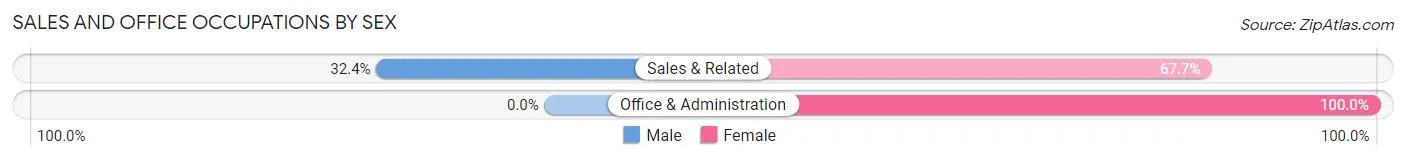
| Occupation | Male | Female |
| Sales & Related | 11 (32.4%) | 23 (67.6%) |
| Office & Administration | 0 (0.0%) | 16 (100.0%) |
| Total (Category) | 11 (22.0%) | 39 (78.0%) |
| Total (Overall) | 221 (62.6%) | 132 (37.4%) |
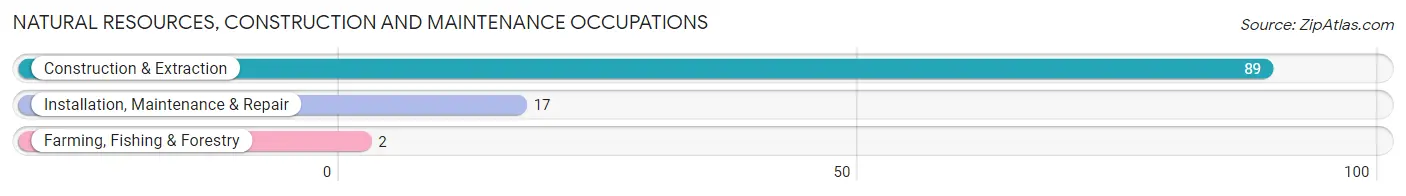
Natural Resources, Construction and Maintenance Occupations
The most common Natural Resources, Construction and Maintenance occupations in Sycamore are Construction & Extraction (89 | 25.2%), Installation, Maintenance & Repair (17 | 4.8%), and Farming, Fishing & Forestry (2 | 0.6%).
Natural Resources, Construction and Maintenance Occupations by Sex
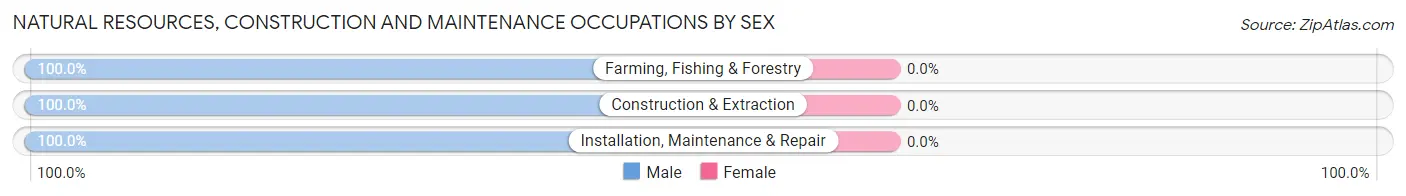
| Occupation | Male | Female |
| Farming, Fishing & Forestry | 2 (100.0%) | 0 (0.0%) |
| Construction & Extraction | 89 (100.0%) | 0 (0.0%) |
| Installation, Maintenance & Repair | 17 (100.0%) | 0 (0.0%) |
| Total (Category) | 108 (100.0%) | 0 (0.0%) |
| Total (Overall) | 221 (62.6%) | 132 (37.4%) |
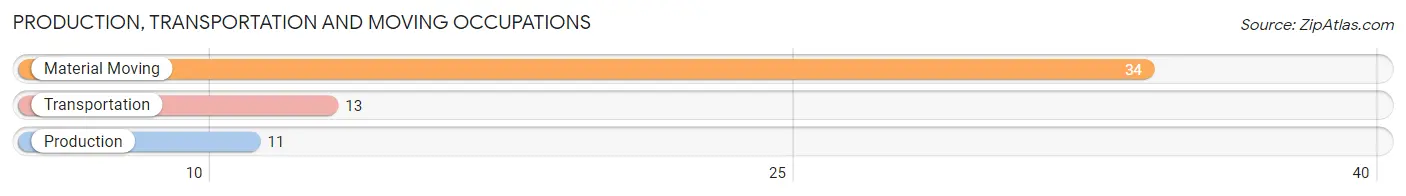
Production, Transportation and Moving Occupations
The most common Production, Transportation and Moving occupations in Sycamore are Material Moving (34 | 9.6%), Transportation (13 | 3.7%), and Production (11 | 3.1%).
Production, Transportation and Moving Occupations by Sex
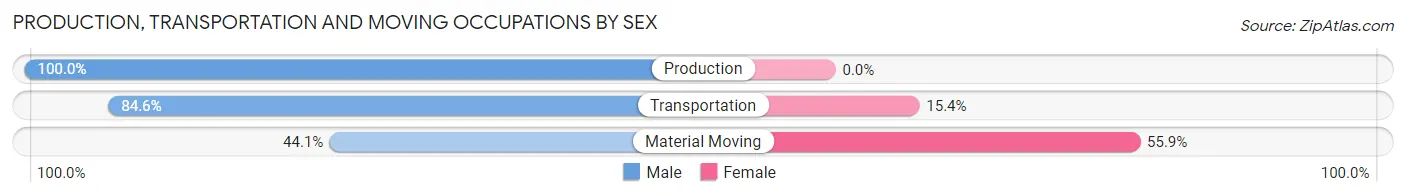
| Occupation | Male | Female |
| Production | 11 (100.0%) | 0 (0.0%) |
| Transportation | 11 (84.6%) | 2 (15.4%) |
| Material Moving | 15 (44.1%) | 19 (55.9%) |
| Total (Category) | 37 (63.8%) | 21 (36.2%) |
| Total (Overall) | 221 (62.6%) | 132 (37.4%) |
Employment Industries by Sex in Sycamore
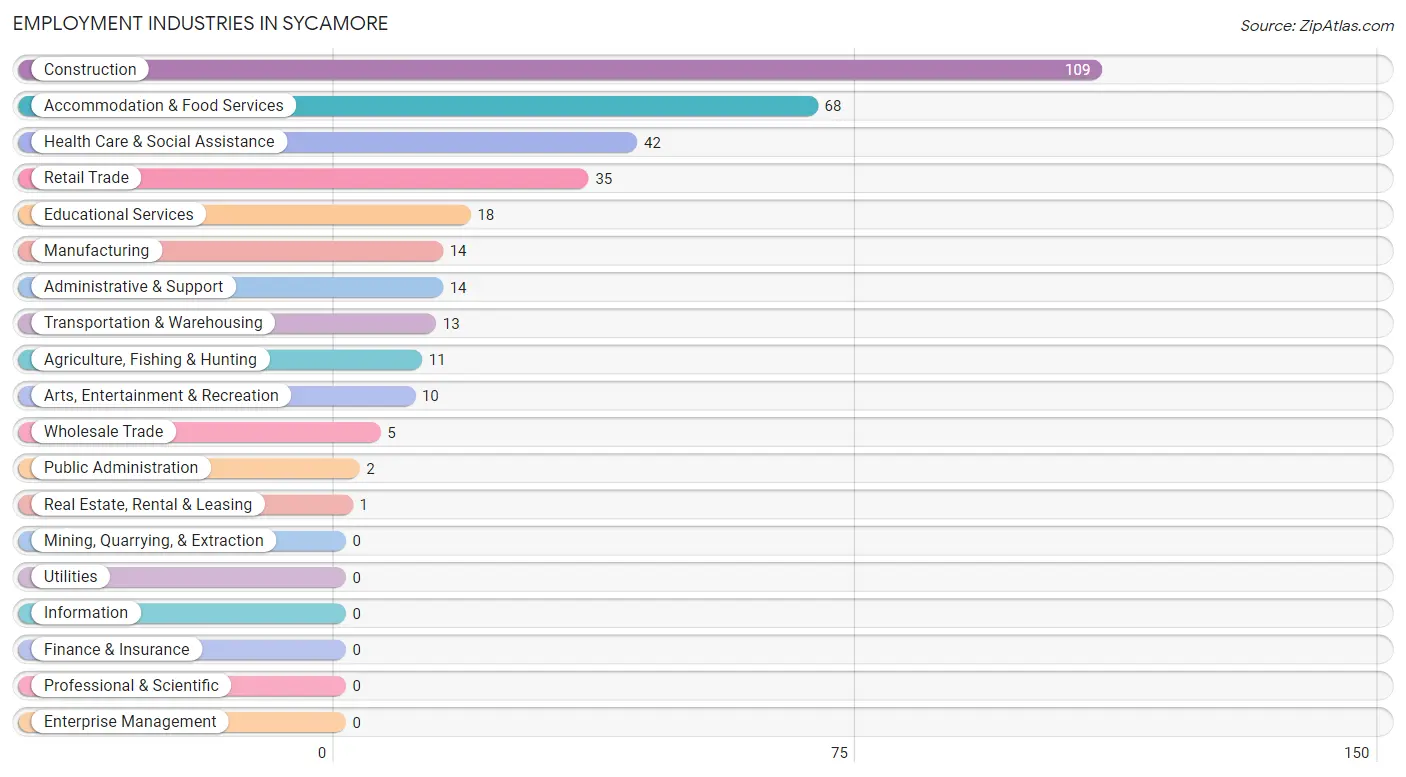
Employment Industries in Sycamore
The major employment industries in Sycamore include Construction (109 | 30.9%), Accommodation & Food Services (68 | 19.3%), Health Care & Social Assistance (42 | 11.9%), Retail Trade (35 | 9.9%), and Educational Services (18 | 5.1%).
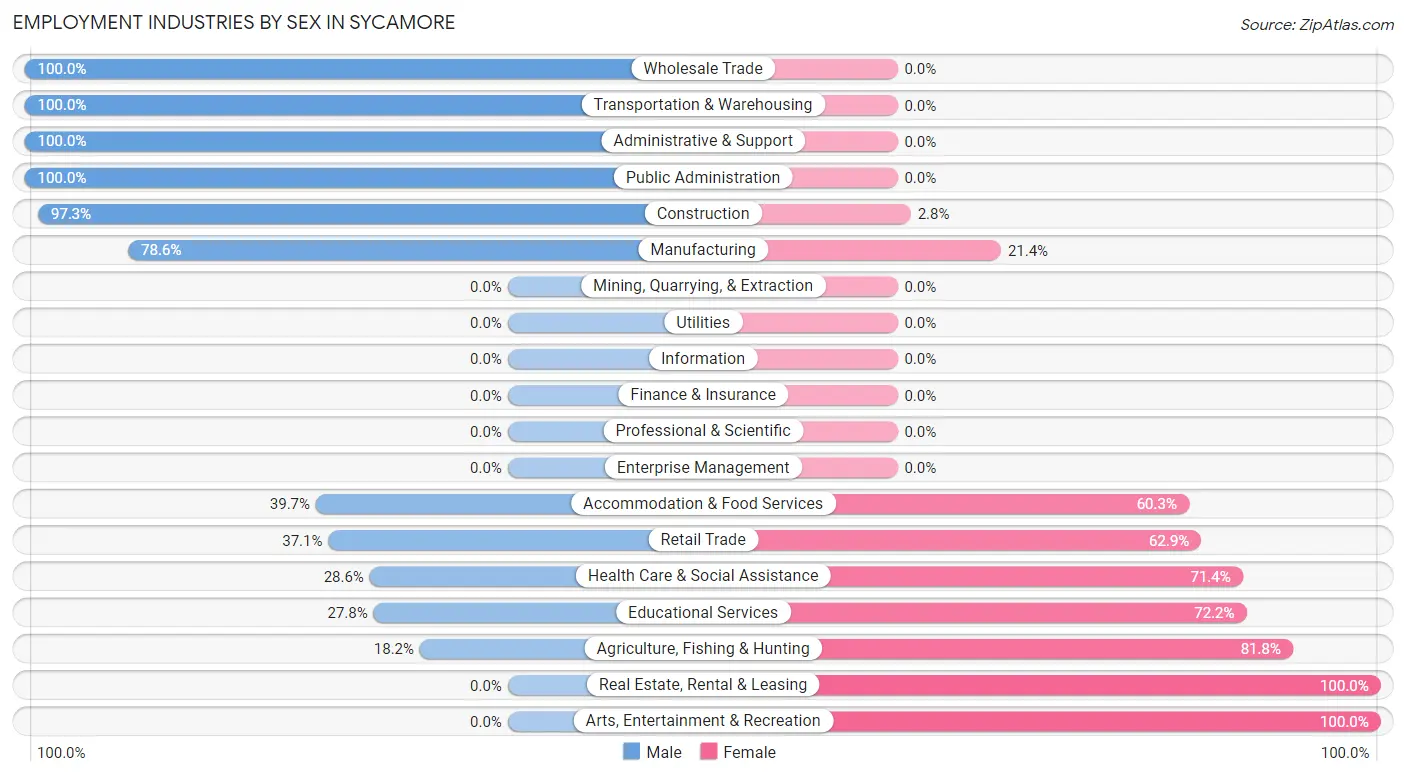
Employment Industries by Sex in Sycamore
The Sycamore industries that see more men than women are Wholesale Trade (100.0%), Transportation & Warehousing (100.0%), and Administrative & Support (100.0%), whereas the industries that tend to have a higher number of women are Real Estate, Rental & Leasing (100.0%), Arts, Entertainment & Recreation (100.0%), and Agriculture, Fishing & Hunting (81.8%).
| Industry | Male | Female |
| Agriculture, Fishing & Hunting | 2 (18.2%) | 9 (81.8%) |
| Mining, Quarrying, & Extraction | 0 (0.0%) | 0 (0.0%) |
| Construction | 106 (97.3%) | 3 (2.8%) |
| Manufacturing | 11 (78.6%) | 3 (21.4%) |
| Wholesale Trade | 5 (100.0%) | 0 (0.0%) |
| Retail Trade | 13 (37.1%) | 22 (62.9%) |
| Transportation & Warehousing | 13 (100.0%) | 0 (0.0%) |
| Utilities | 0 (0.0%) | 0 (0.0%) |
| Information | 0 (0.0%) | 0 (0.0%) |
| Finance & Insurance | 0 (0.0%) | 0 (0.0%) |
| Real Estate, Rental & Leasing | 0 (0.0%) | 1 (100.0%) |
| Professional & Scientific | 0 (0.0%) | 0 (0.0%) |
| Enterprise Management | 0 (0.0%) | 0 (0.0%) |
| Administrative & Support | 14 (100.0%) | 0 (0.0%) |
| Educational Services | 5 (27.8%) | 13 (72.2%) |
| Health Care & Social Assistance | 12 (28.6%) | 30 (71.4%) |
| Arts, Entertainment & Recreation | 0 (0.0%) | 10 (100.0%) |
| Accommodation & Food Services | 27 (39.7%) | 41 (60.3%) |
| Public Administration | 2 (100.0%) | 0 (0.0%) |
| Total | 221 (62.6%) | 132 (37.4%) |
Education in Sycamore
School Enrollment in Sycamore
The most common levels of schooling among the 271 students in Sycamore are high school (99 | 36.5%), elementary school (82 | 30.3%), and middle school (35 | 12.9%).
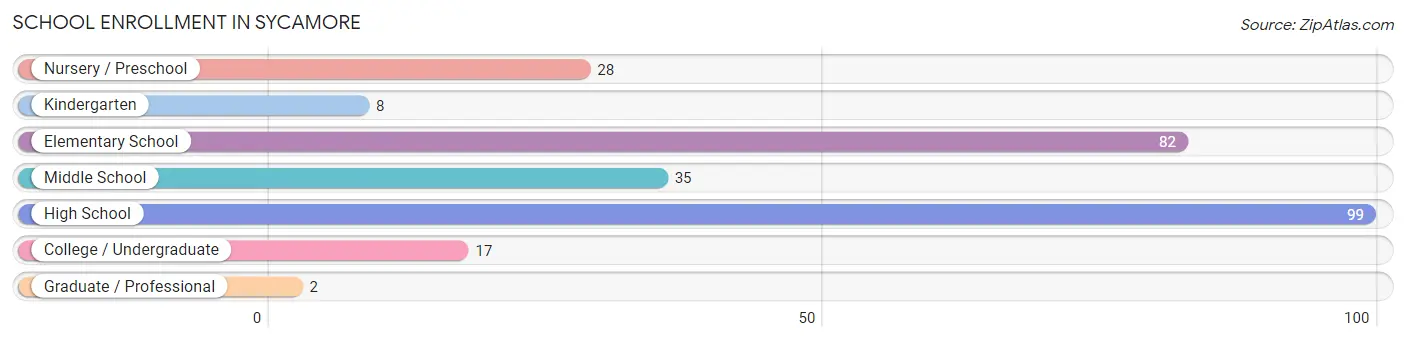
| School Level | # Students | % Students |
| Nursery / Preschool | 28 | 10.3% |
| Kindergarten | 8 | 2.9% |
| Elementary School | 82 | 30.3% |
| Middle School | 35 | 12.9% |
| High School | 99 | 36.5% |
| College / Undergraduate | 17 | 6.3% |
| Graduate / Professional | 2 | 0.7% |
| Total | 271 | 100.0% |
School Enrollment by Age by Funding Source in Sycamore
Out of a total of 271 students who are enrolled in schools in Sycamore, 26 (9.6%) attend a private institution, while the remaining 245 (90.4%) are enrolled in public schools. The age group of 15 to 17 year olds has the highest likelihood of being enrolled in private schools, with 25 (28.1% in the age bracket) enrolled. Conversely, the age group of 3 to 4 year olds has the lowest likelihood of being enrolled in a private school, with 28 (100.0% in the age bracket) attending a public institution.
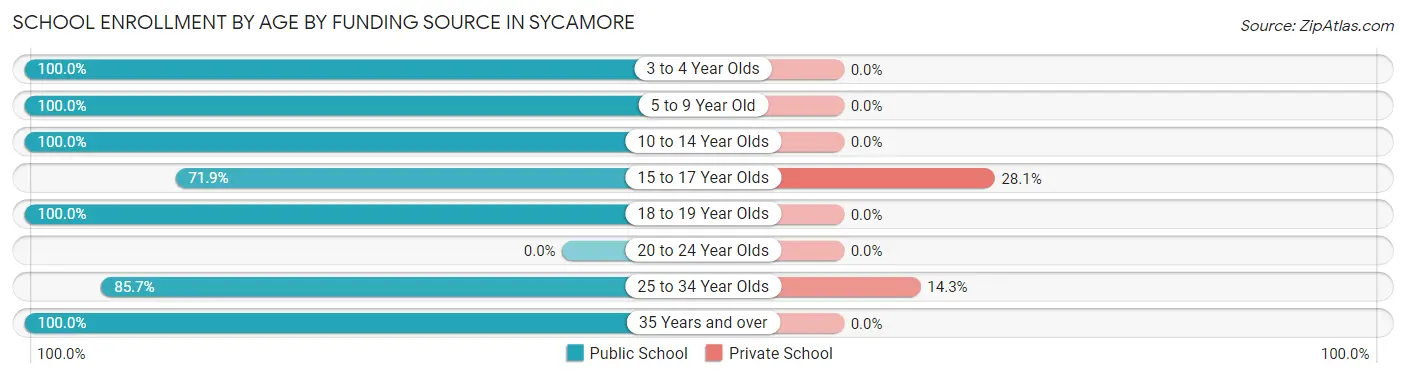
| Age Bracket | Public School | Private School |
| 3 to 4 Year Olds | 28 (100.0%) | 0 (0.0%) |
| 5 to 9 Year Old | 90 (100.0%) | 0 (0.0%) |
| 10 to 14 Year Olds | 35 (100.0%) | 0 (0.0%) |
| 15 to 17 Year Olds | 64 (71.9%) | 25 (28.1%) |
| 18 to 19 Year Olds | 10 (100.0%) | 0 (0.0%) |
| 20 to 24 Year Olds | 0 (0.0%) | 0 (0.0%) |
| 25 to 34 Year Olds | 6 (85.7%) | 1 (14.3%) |
| 35 Years and over | 12 (100.0%) | 0 (0.0%) |
| Total | 245 (90.4%) | 26 (9.6%) |
Educational Attainment by Field of Study in Sycamore
Business (19 | 30.2%), visual & performing arts (13 | 20.6%), science & technology (10 | 15.9%), education (10 | 15.9%), and psychology (6 | 9.5%) are the most common fields of study among 63 individuals in Sycamore who have obtained a bachelor's degree or higher.
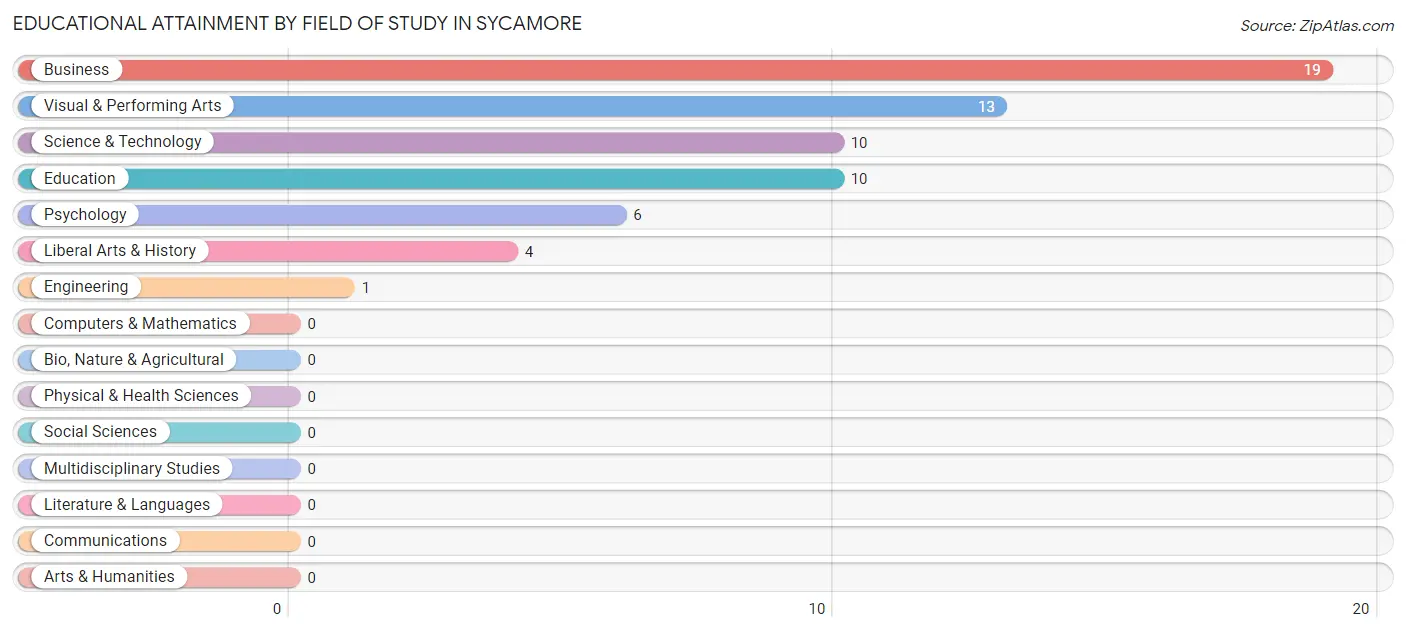
| Field of Study | # Graduates | % Graduates |
| Computers & Mathematics | 0 | 0.0% |
| Bio, Nature & Agricultural | 0 | 0.0% |
| Physical & Health Sciences | 0 | 0.0% |
| Psychology | 6 | 9.5% |
| Social Sciences | 0 | 0.0% |
| Engineering | 1 | 1.6% |
| Multidisciplinary Studies | 0 | 0.0% |
| Science & Technology | 10 | 15.9% |
| Business | 19 | 30.2% |
| Education | 10 | 15.9% |
| Literature & Languages | 0 | 0.0% |
| Liberal Arts & History | 4 | 6.4% |
| Visual & Performing Arts | 13 | 20.6% |
| Communications | 0 | 0.0% |
| Arts & Humanities | 0 | 0.0% |
| Total | 63 | 100.0% |
Transportation & Commute in Sycamore
Vehicle Availability by Sex in Sycamore
The most prevalent vehicle ownership categories in Sycamore are males with 1 vehicle (122, accounting for 56.5%) and females with 1 vehicle (23, making up 92.4%).
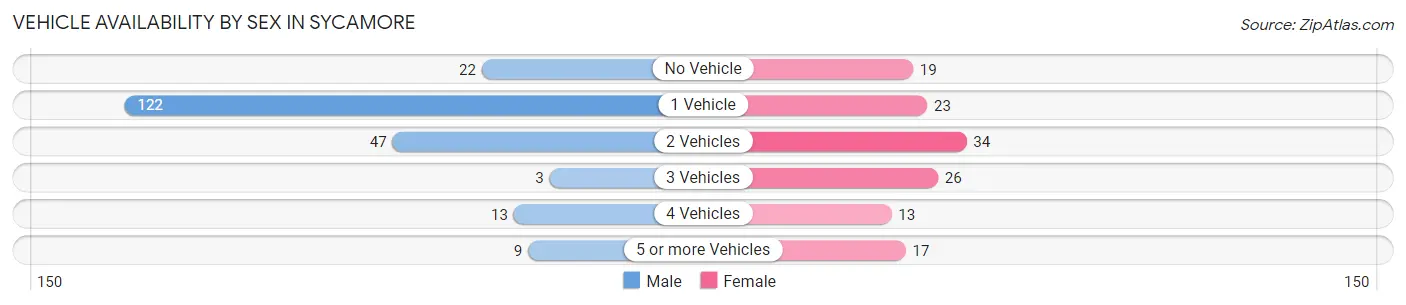
| Vehicles Available | Male | Female |
| No Vehicle | 22 (10.2%) | 19 (14.4%) |
| 1 Vehicle | 122 (56.5%) | 23 (17.4%) |
| 2 Vehicles | 47 (21.8%) | 34 (25.8%) |
| 3 Vehicles | 3 (1.4%) | 26 (19.7%) |
| 4 Vehicles | 13 (6.0%) | 13 (9.9%) |
| 5 or more Vehicles | 9 (4.2%) | 17 (12.9%) |
| Total | 216 (100.0%) | 132 (100.0%) |
Commute Time in Sycamore
The most frequently occuring commute durations in Sycamore are 5 to 9 minutes (112 commuters, 32.8%), 10 to 14 minutes (100 commuters, 29.2%), and 20 to 24 minutes (53 commuters, 15.5%).
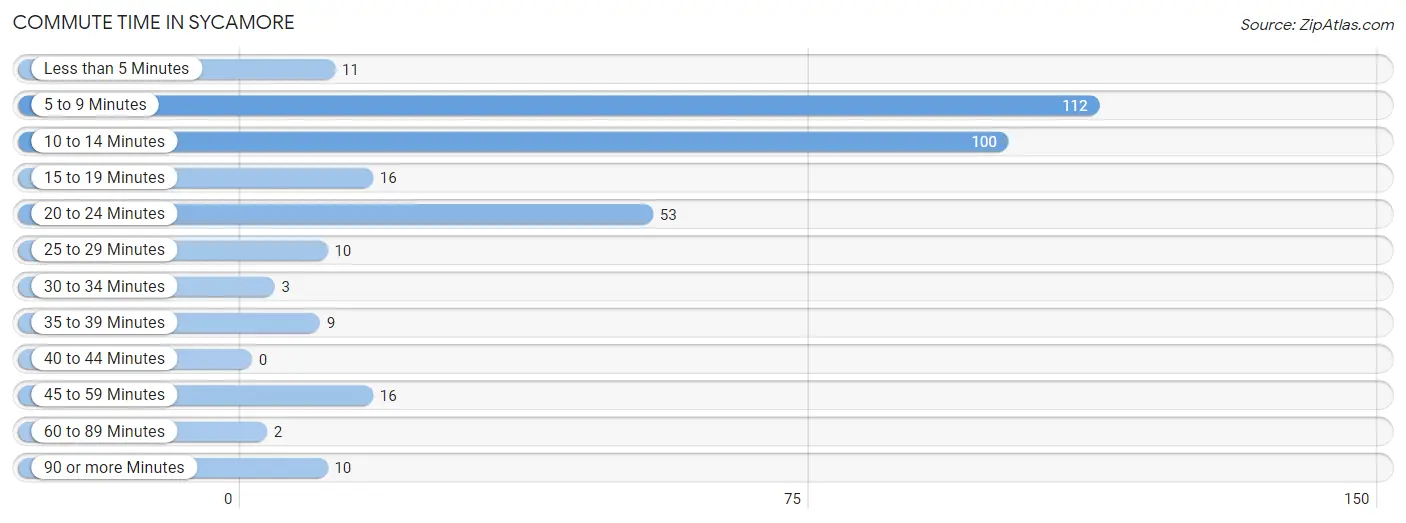
| Commute Time | # Commuters | % Commuters |
| Less than 5 Minutes | 11 | 3.2% |
| 5 to 9 Minutes | 112 | 32.8% |
| 10 to 14 Minutes | 100 | 29.2% |
| 15 to 19 Minutes | 16 | 4.7% |
| 20 to 24 Minutes | 53 | 15.5% |
| 25 to 29 Minutes | 10 | 2.9% |
| 30 to 34 Minutes | 3 | 0.9% |
| 35 to 39 Minutes | 9 | 2.6% |
| 40 to 44 Minutes | 0 | 0.0% |
| 45 to 59 Minutes | 16 | 4.7% |
| 60 to 89 Minutes | 2 | 0.6% |
| 90 or more Minutes | 10 | 2.9% |
Commute Time by Sex in Sycamore
The most common commute times in Sycamore are 5 to 9 minutes (88 commuters, 41.9%) for males and 10 to 14 minutes (57 commuters, 43.2%) for females.
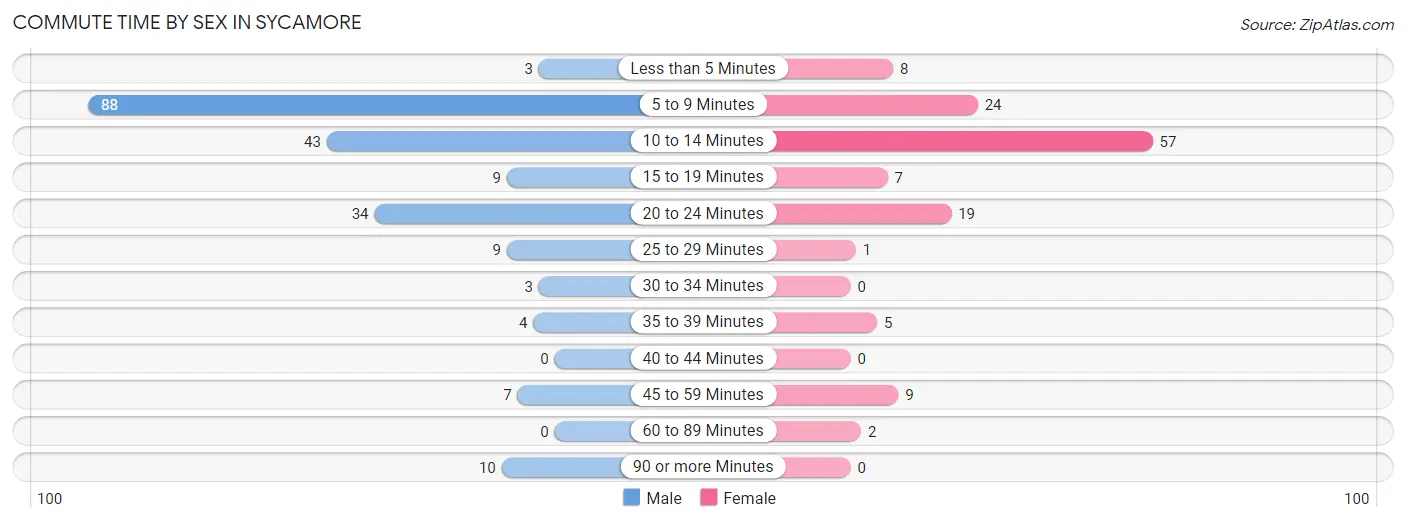
| Commute Time | Male | Female |
| Less than 5 Minutes | 3 (1.4%) | 8 (6.1%) |
| 5 to 9 Minutes | 88 (41.9%) | 24 (18.2%) |
| 10 to 14 Minutes | 43 (20.5%) | 57 (43.2%) |
| 15 to 19 Minutes | 9 (4.3%) | 7 (5.3%) |
| 20 to 24 Minutes | 34 (16.2%) | 19 (14.4%) |
| 25 to 29 Minutes | 9 (4.3%) | 1 (0.8%) |
| 30 to 34 Minutes | 3 (1.4%) | 0 (0.0%) |
| 35 to 39 Minutes | 4 (1.9%) | 5 (3.8%) |
| 40 to 44 Minutes | 0 (0.0%) | 0 (0.0%) |
| 45 to 59 Minutes | 7 (3.3%) | 9 (6.8%) |
| 60 to 89 Minutes | 0 (0.0%) | 2 (1.5%) |
| 90 or more Minutes | 10 (4.8%) | 0 (0.0%) |
Time of Departure to Work by Sex in Sycamore
The most frequent times of departure to work in Sycamore are 6:30 AM to 6:59 AM (92, 43.8%) for males and 7:30 AM to 7:59 AM (30, 22.7%) for females.
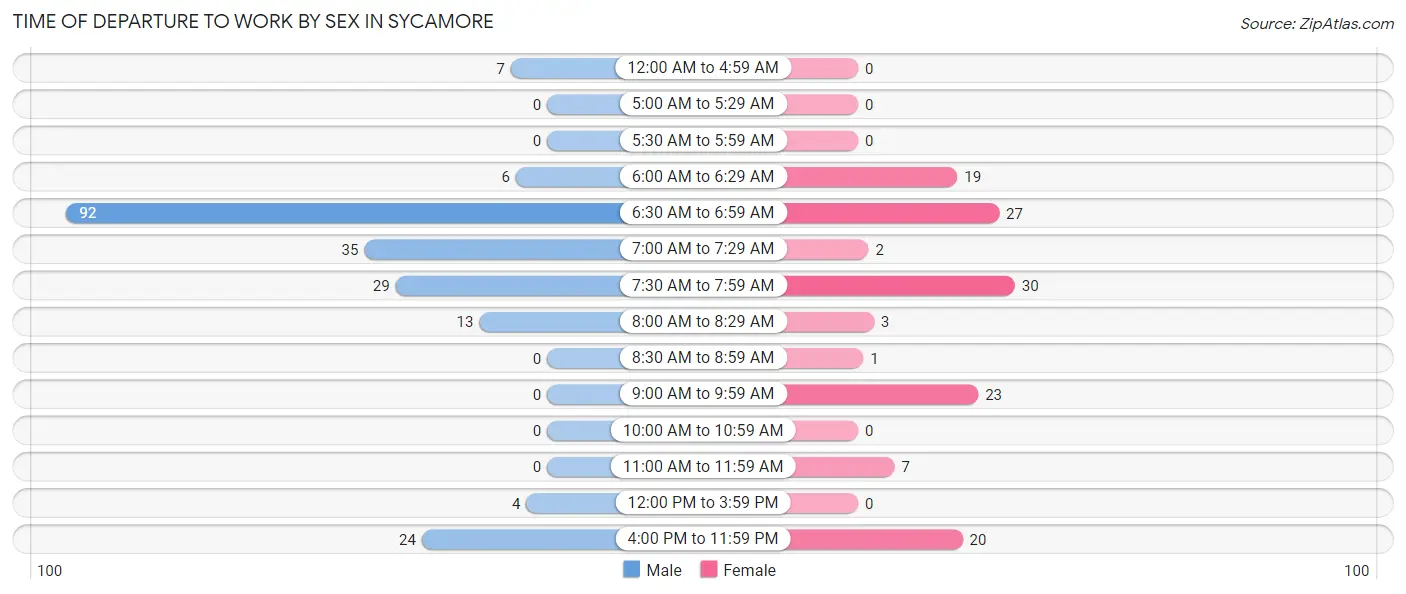
| Time of Departure | Male | Female |
| 12:00 AM to 4:59 AM | 7 (3.3%) | 0 (0.0%) |
| 5:00 AM to 5:29 AM | 0 (0.0%) | 0 (0.0%) |
| 5:30 AM to 5:59 AM | 0 (0.0%) | 0 (0.0%) |
| 6:00 AM to 6:29 AM | 6 (2.9%) | 19 (14.4%) |
| 6:30 AM to 6:59 AM | 92 (43.8%) | 27 (20.4%) |
| 7:00 AM to 7:29 AM | 35 (16.7%) | 2 (1.5%) |
| 7:30 AM to 7:59 AM | 29 (13.8%) | 30 (22.7%) |
| 8:00 AM to 8:29 AM | 13 (6.2%) | 3 (2.3%) |
| 8:30 AM to 8:59 AM | 0 (0.0%) | 1 (0.8%) |
| 9:00 AM to 9:59 AM | 0 (0.0%) | 23 (17.4%) |
| 10:00 AM to 10:59 AM | 0 (0.0%) | 0 (0.0%) |
| 11:00 AM to 11:59 AM | 0 (0.0%) | 7 (5.3%) |
| 12:00 PM to 3:59 PM | 4 (1.9%) | 0 (0.0%) |
| 4:00 PM to 11:59 PM | 24 (11.4%) | 20 (15.1%) |
| Total | 210 (100.0%) | 132 (100.0%) |
Housing Occupancy in Sycamore
Occupancy by Ownership in Sycamore
Of the total 244 dwellings in Sycamore, owner-occupied units account for 172 (70.5%), while renter-occupied units make up 72 (29.5%).
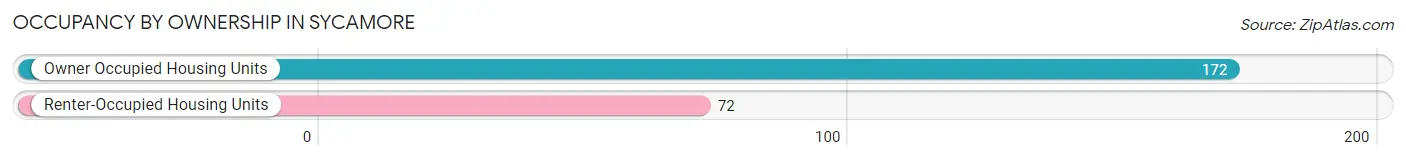
| Occupancy | # Housing Units | % Housing Units |
| Owner Occupied Housing Units | 172 | 70.5% |
| Renter-Occupied Housing Units | 72 | 29.5% |
| Total Occupied Housing Units | 244 | 100.0% |
Occupancy by Household Size in Sycamore
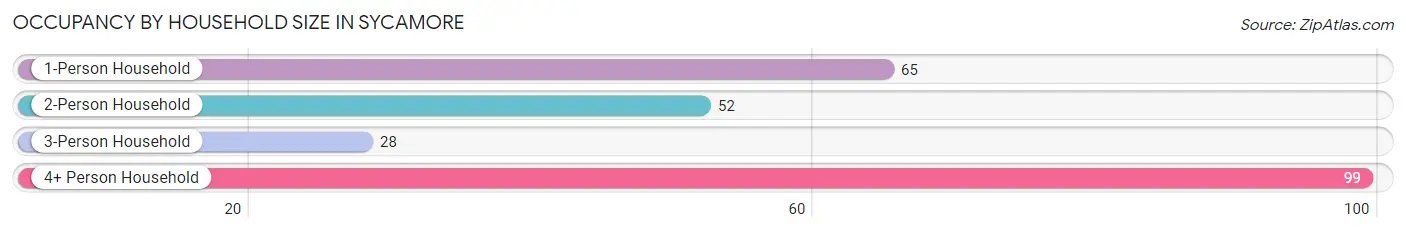
| Household Size | # Housing Units | % Housing Units |
| 1-Person Household | 65 | 26.6% |
| 2-Person Household | 52 | 21.3% |
| 3-Person Household | 28 | 11.5% |
| 4+ Person Household | 99 | 40.6% |
| Total Housing Units | 244 | 100.0% |
Occupancy by Ownership by Household Size in Sycamore
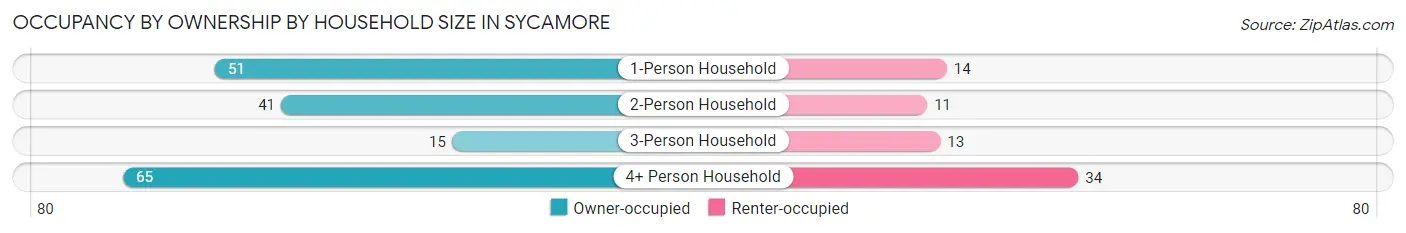
| Household Size | Owner-occupied | Renter-occupied |
| 1-Person Household | 51 (78.5%) | 14 (21.5%) |
| 2-Person Household | 41 (78.8%) | 11 (21.1%) |
| 3-Person Household | 15 (53.6%) | 13 (46.4%) |
| 4+ Person Household | 65 (65.7%) | 34 (34.3%) |
| Total Housing Units | 172 (70.5%) | 72 (29.5%) |
Occupancy by Educational Attainment in Sycamore
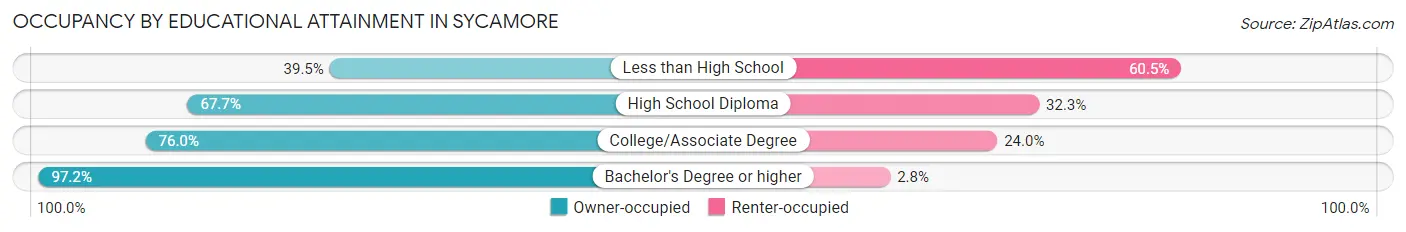
| Household Size | Owner-occupied | Renter-occupied |
| Less than High School | 17 (39.5%) | 26 (60.5%) |
| High School Diploma | 44 (67.7%) | 21 (32.3%) |
| College/Associate Degree | 76 (76.0%) | 24 (24.0%) |
| Bachelor's Degree or higher | 35 (97.2%) | 1 (2.8%) |
Occupancy by Age of Householder in Sycamore
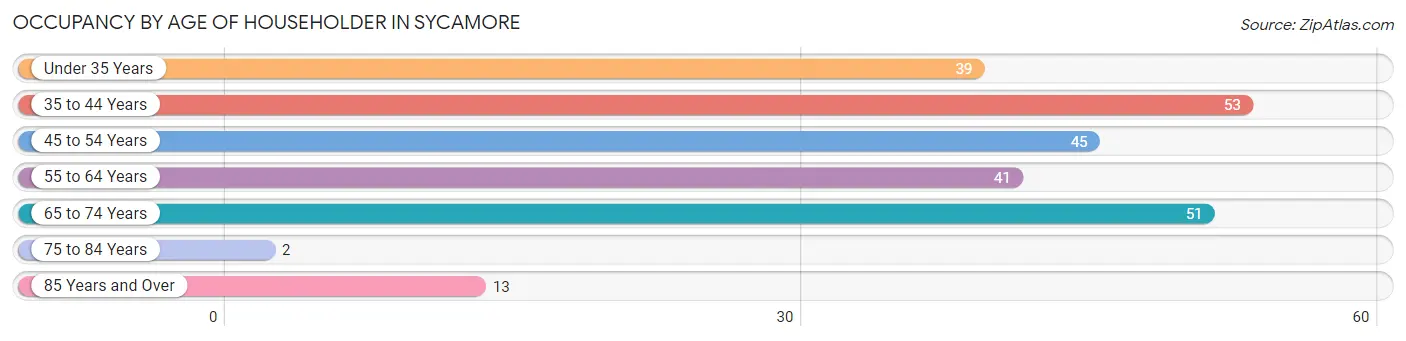
| Age Bracket | # Households | % Households |
| Under 35 Years | 39 | 16.0% |
| 35 to 44 Years | 53 | 21.7% |
| 45 to 54 Years | 45 | 18.4% |
| 55 to 64 Years | 41 | 16.8% |
| 65 to 74 Years | 51 | 20.9% |
| 75 to 84 Years | 2 | 0.8% |
| 85 Years and Over | 13 | 5.3% |
| Total | 244 | 100.0% |
Housing Finances in Sycamore
Median Income by Occupancy in Sycamore
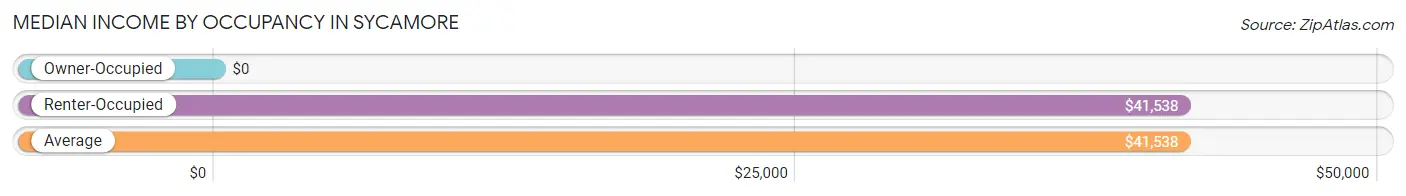
| Occupancy Type | # Households | Median Income |
| Owner-Occupied | 172 (70.5%) | $0 |
| Renter-Occupied | 72 (29.5%) | $41,538 |
| Average | 244 (100.0%) | $41,538 |
Occupancy by Householder Income Bracket in Sycamore
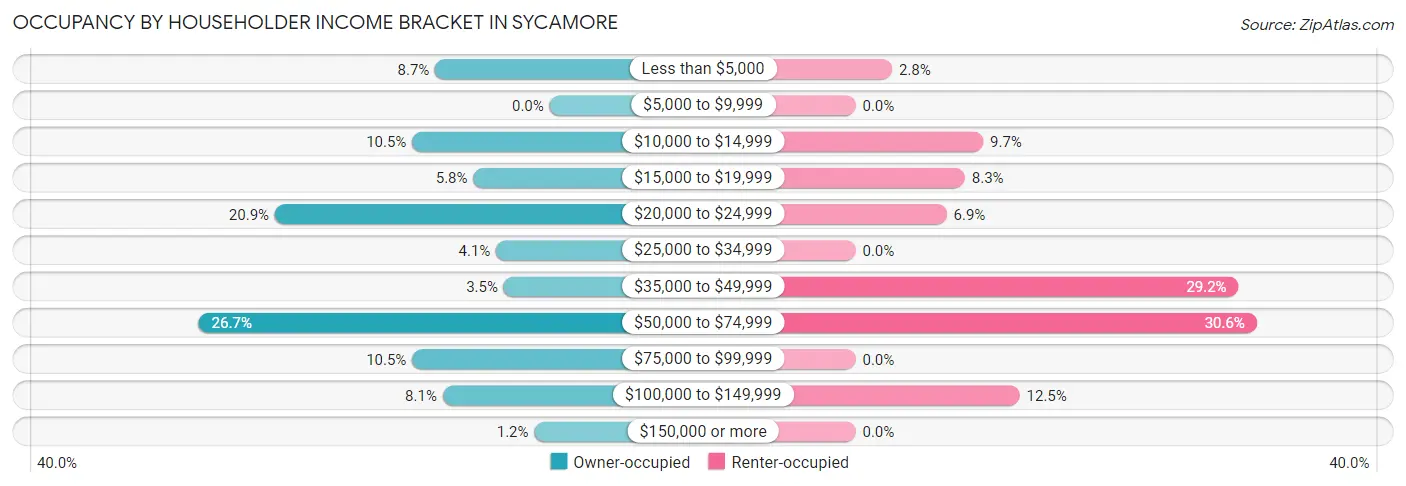
| Income Bracket | Owner-occupied | Renter-occupied |
| Less than $5,000 | 15 (8.7%) | 2 (2.8%) |
| $5,000 to $9,999 | 0 (0.0%) | 0 (0.0%) |
| $10,000 to $14,999 | 18 (10.5%) | 7 (9.7%) |
| $15,000 to $19,999 | 10 (5.8%) | 6 (8.3%) |
| $20,000 to $24,999 | 36 (20.9%) | 5 (6.9%) |
| $25,000 to $34,999 | 7 (4.1%) | 0 (0.0%) |
| $35,000 to $49,999 | 6 (3.5%) | 21 (29.2%) |
| $50,000 to $74,999 | 46 (26.7%) | 22 (30.6%) |
| $75,000 to $99,999 | 18 (10.5%) | 0 (0.0%) |
| $100,000 to $149,999 | 14 (8.1%) | 9 (12.5%) |
| $150,000 or more | 2 (1.2%) | 0 (0.0%) |
| Total | 172 (100.0%) | 72 (100.0%) |
Monthly Housing Cost Tiers in Sycamore
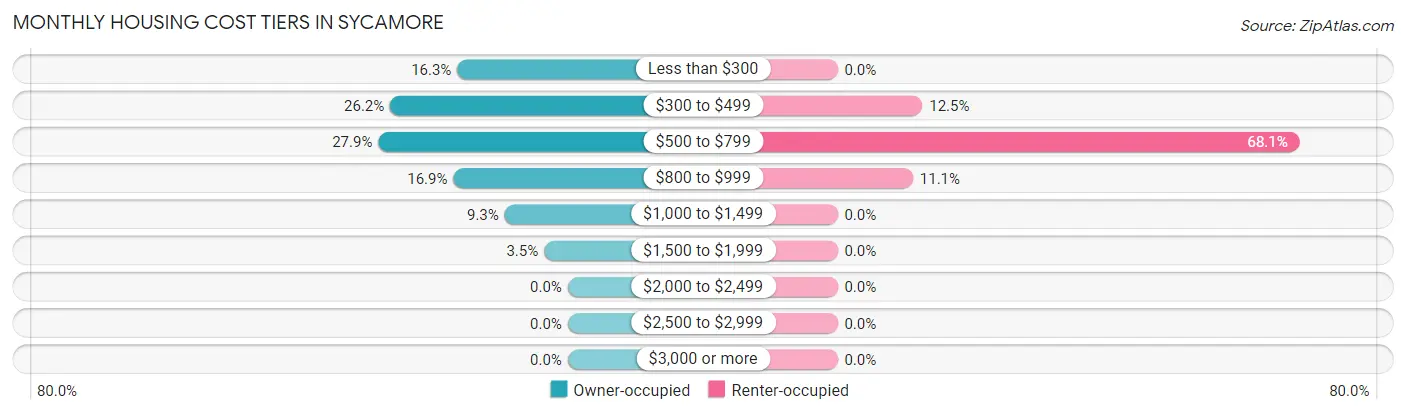
| Monthly Cost | Owner-occupied | Renter-occupied |
| Less than $300 | 28 (16.3%) | 0 (0.0%) |
| $300 to $499 | 45 (26.2%) | 9 (12.5%) |
| $500 to $799 | 48 (27.9%) | 49 (68.1%) |
| $800 to $999 | 29 (16.9%) | 8 (11.1%) |
| $1,000 to $1,499 | 16 (9.3%) | 0 (0.0%) |
| $1,500 to $1,999 | 6 (3.5%) | 0 (0.0%) |
| $2,000 to $2,499 | 0 (0.0%) | 0 (0.0%) |
| $2,500 to $2,999 | 0 (0.0%) | 0 (0.0%) |
| $3,000 or more | 0 (0.0%) | 0 (0.0%) |
| Total | 172 (100.0%) | 72 (100.0%) |
Physical Housing Characteristics in Sycamore
Housing Structures in Sycamore
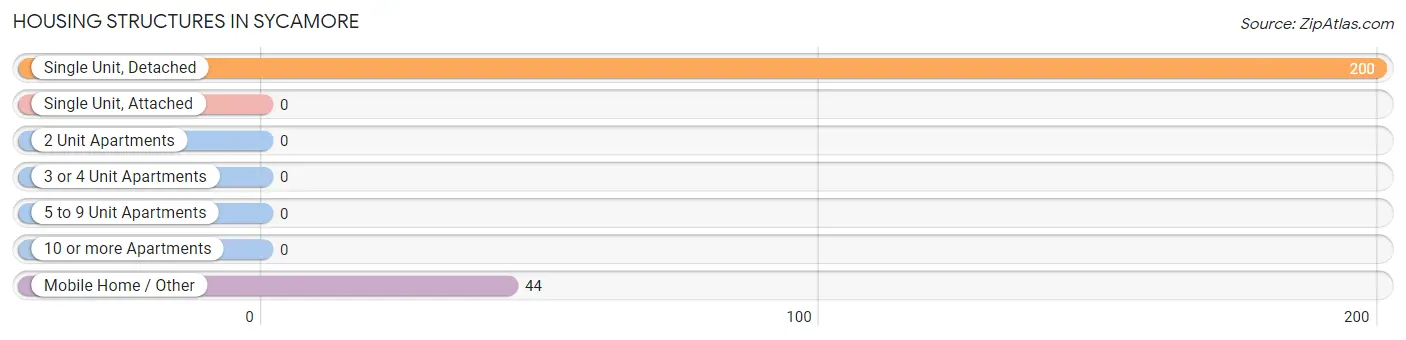
| Structure Type | # Housing Units | % Housing Units |
| Single Unit, Detached | 200 | 82.0% |
| Single Unit, Attached | 0 | 0.0% |
| 2 Unit Apartments | 0 | 0.0% |
| 3 or 4 Unit Apartments | 0 | 0.0% |
| 5 to 9 Unit Apartments | 0 | 0.0% |
| 10 or more Apartments | 0 | 0.0% |
| Mobile Home / Other | 44 | 18.0% |
| Total | 244 | 100.0% |
Housing Structures by Occupancy in Sycamore
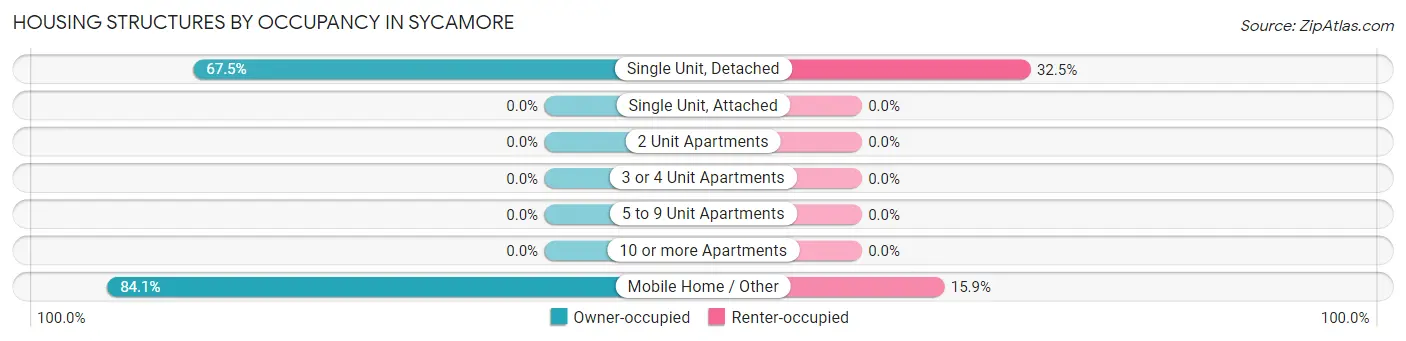
| Structure Type | Owner-occupied | Renter-occupied |
| Single Unit, Detached | 135 (67.5%) | 65 (32.5%) |
| Single Unit, Attached | 0 (0.0%) | 0 (0.0%) |
| 2 Unit Apartments | 0 (0.0%) | 0 (0.0%) |
| 3 or 4 Unit Apartments | 0 (0.0%) | 0 (0.0%) |
| 5 to 9 Unit Apartments | 0 (0.0%) | 0 (0.0%) |
| 10 or more Apartments | 0 (0.0%) | 0 (0.0%) |
| Mobile Home / Other | 37 (84.1%) | 7 (15.9%) |
| Total | 172 (70.5%) | 72 (29.5%) |
Housing Structures by Number of Rooms in Sycamore
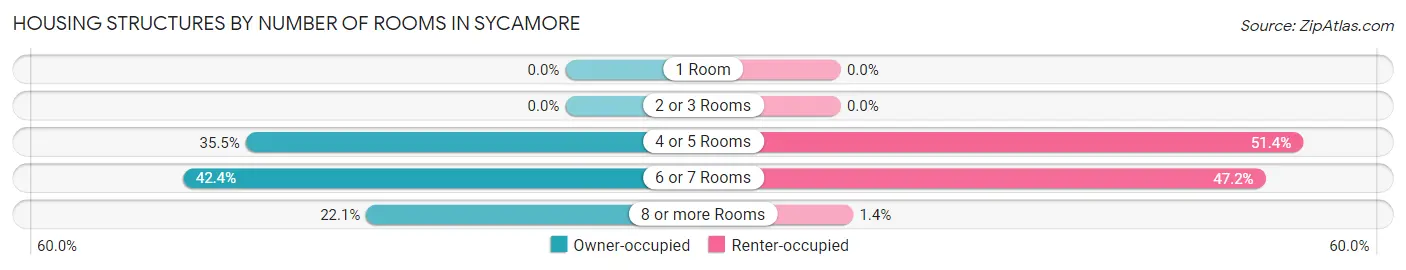
| Number of Rooms | Owner-occupied | Renter-occupied |
| 1 Room | 0 (0.0%) | 0 (0.0%) |
| 2 or 3 Rooms | 0 (0.0%) | 0 (0.0%) |
| 4 or 5 Rooms | 61 (35.5%) | 37 (51.4%) |
| 6 or 7 Rooms | 73 (42.4%) | 34 (47.2%) |
| 8 or more Rooms | 38 (22.1%) | 1 (1.4%) |
| Total | 172 (100.0%) | 72 (100.0%) |
Housing Structure by Heating Type in Sycamore
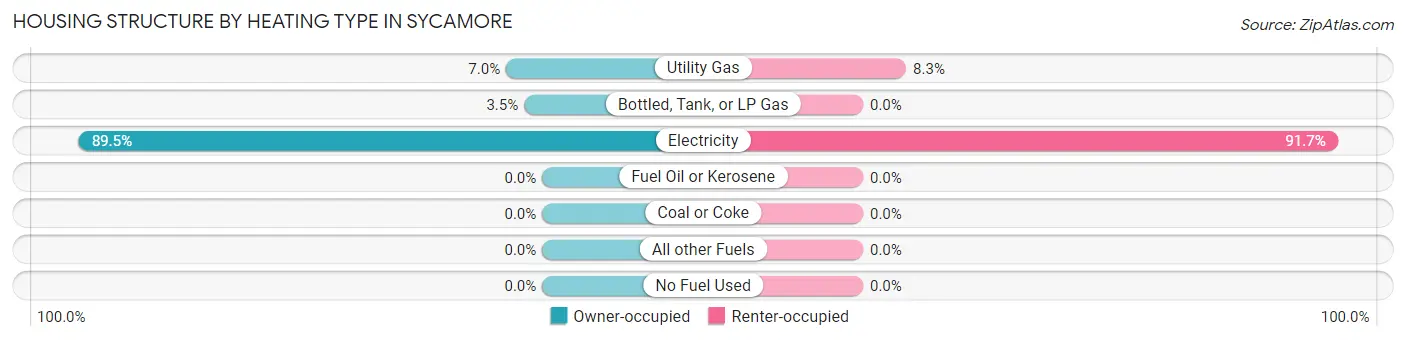
| Heating Type | Owner-occupied | Renter-occupied |
| Utility Gas | 12 (7.0%) | 6 (8.3%) |
| Bottled, Tank, or LP Gas | 6 (3.5%) | 0 (0.0%) |
| Electricity | 154 (89.5%) | 66 (91.7%) |
| Fuel Oil or Kerosene | 0 (0.0%) | 0 (0.0%) |
| Coal or Coke | 0 (0.0%) | 0 (0.0%) |
| All other Fuels | 0 (0.0%) | 0 (0.0%) |
| No Fuel Used | 0 (0.0%) | 0 (0.0%) |
| Total | 172 (100.0%) | 72 (100.0%) |
Household Vehicle Usage in Sycamore
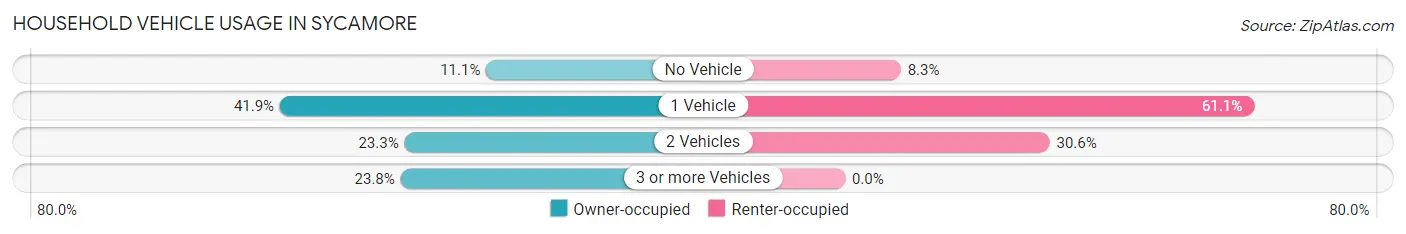
| Vehicles per Household | Owner-occupied | Renter-occupied |
| No Vehicle | 19 (11.1%) | 6 (8.3%) |
| 1 Vehicle | 72 (41.9%) | 44 (61.1%) |
| 2 Vehicles | 40 (23.3%) | 22 (30.6%) |
| 3 or more Vehicles | 41 (23.8%) | 0 (0.0%) |
| Total | 172 (100.0%) | 72 (100.0%) |
Real Estate & Mortgages in Sycamore
Real Estate and Mortgage Overview in Sycamore
| Characteristic | Without Mortgage | With Mortgage |
| Housing Units | 104 | 68 |
| Median Property Value | $63,300 | $76,700 |
| Median Household Income | - | - |
| Monthly Housing Costs | $378 | $0 |
| Real Estate Taxes | $722 | $4 |
Property Value by Mortgage Status in Sycamore
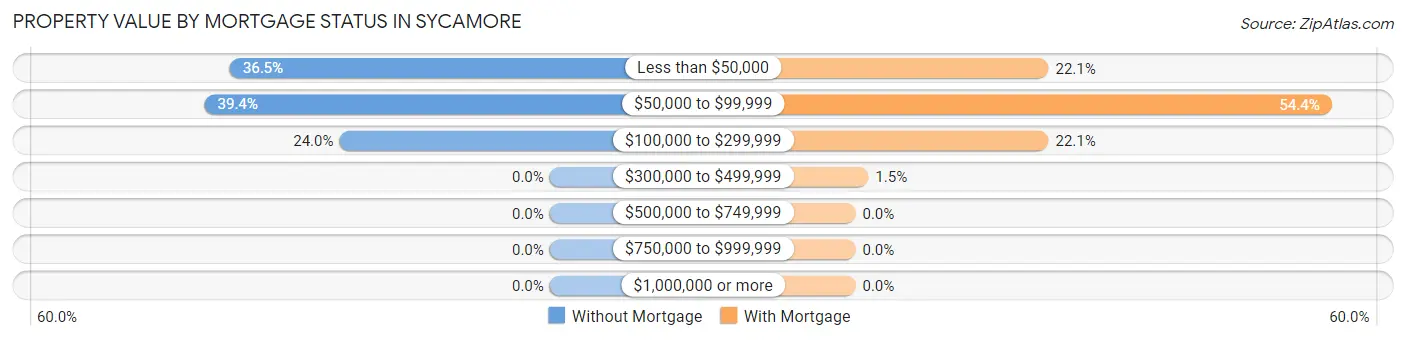
| Property Value | Without Mortgage | With Mortgage |
| Less than $50,000 | 38 (36.5%) | 15 (22.1%) |
| $50,000 to $99,999 | 41 (39.4%) | 37 (54.4%) |
| $100,000 to $299,999 | 25 (24.0%) | 15 (22.1%) |
| $300,000 to $499,999 | 0 (0.0%) | 1 (1.5%) |
| $500,000 to $749,999 | 0 (0.0%) | 0 (0.0%) |
| $750,000 to $999,999 | 0 (0.0%) | 0 (0.0%) |
| $1,000,000 or more | 0 (0.0%) | 0 (0.0%) |
| Total | 104 (100.0%) | 68 (100.0%) |
Household Income by Mortgage Status in Sycamore
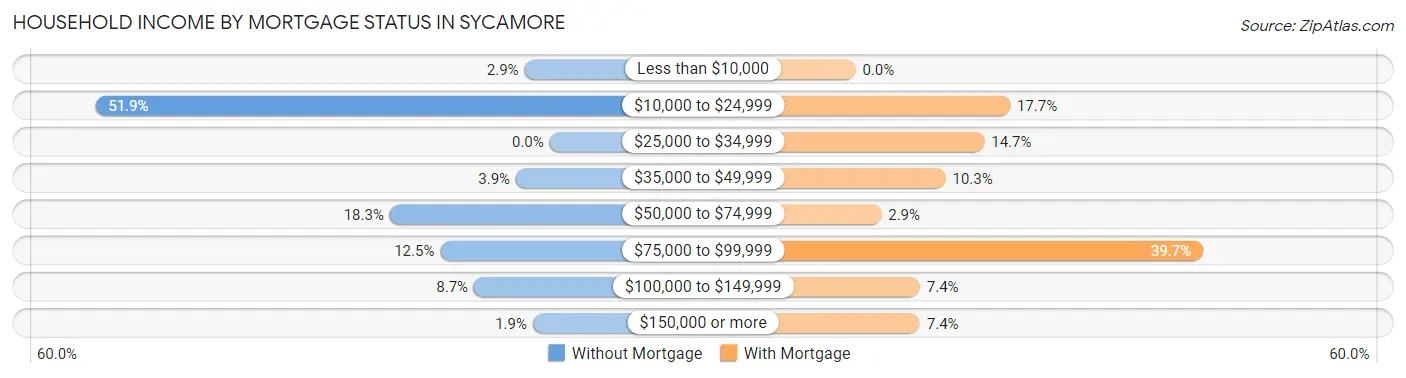
| Household Income | Without Mortgage | With Mortgage |
| Less than $10,000 | 3 (2.9%) | 0 (0.0%) |
| $10,000 to $24,999 | 54 (51.9%) | 12 (17.6%) |
| $25,000 to $34,999 | 0 (0.0%) | 10 (14.7%) |
| $35,000 to $49,999 | 4 (3.8%) | 7 (10.3%) |
| $50,000 to $74,999 | 19 (18.3%) | 2 (2.9%) |
| $75,000 to $99,999 | 13 (12.5%) | 27 (39.7%) |
| $100,000 to $149,999 | 9 (8.6%) | 5 (7.3%) |
| $150,000 or more | 2 (1.9%) | 5 (7.3%) |
| Total | 104 (100.0%) | 68 (100.0%) |
Property Value to Household Income Ratio in Sycamore
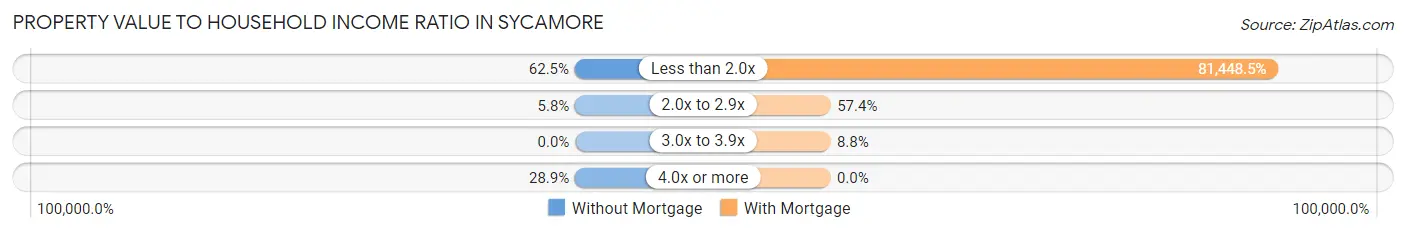
| Value-to-Income Ratio | Without Mortgage | With Mortgage |
| Less than 2.0x | 65 (62.5%) | 55,385 (81,448.5%) |
| 2.0x to 2.9x | 6 (5.8%) | 39 (57.4%) |
| 3.0x to 3.9x | 0 (0.0%) | 6 (8.8%) |
| 4.0x or more | 30 (28.8%) | 0 (0.0%) |
| Total | 104 (100.0%) | 68 (100.0%) |
Real Estate Taxes by Mortgage Status in Sycamore
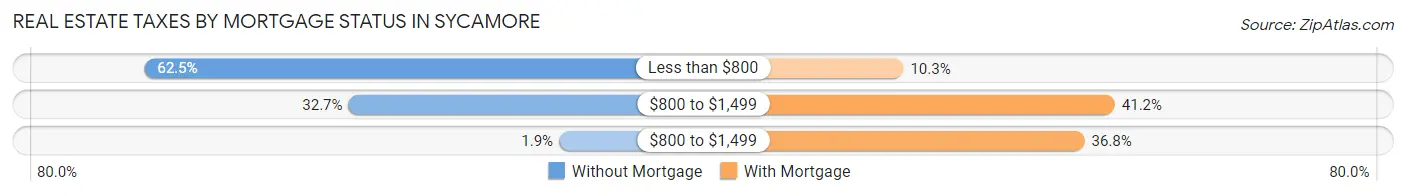
| Property Taxes | Without Mortgage | With Mortgage |
| Less than $800 | 65 (62.5%) | 7 (10.3%) |
| $800 to $1,499 | 34 (32.7%) | 28 (41.2%) |
| $800 to $1,499 | 2 (1.9%) | 25 (36.8%) |
| Total | 104 (100.0%) | 68 (100.0%) |
Health & Disability in Sycamore
Health Insurance Coverage by Age in Sycamore
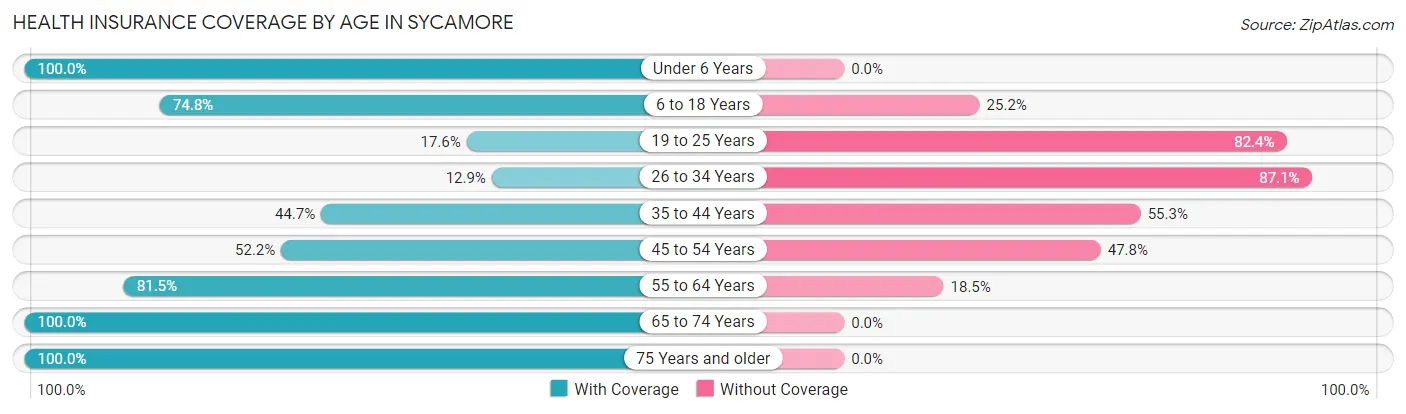
| Age Bracket | With Coverage | Without Coverage |
| Under 6 Years | 166 (100.0%) | 0 (0.0%) |
| 6 to 18 Years | 157 (74.8%) | 53 (25.2%) |
| 19 to 25 Years | 16 (17.6%) | 75 (82.4%) |
| 26 to 34 Years | 24 (12.9%) | 162 (87.1%) |
| 35 to 44 Years | 55 (44.7%) | 68 (55.3%) |
| 45 to 54 Years | 60 (52.2%) | 55 (47.8%) |
| 55 to 64 Years | 66 (81.5%) | 15 (18.5%) |
| 65 to 74 Years | 62 (100.0%) | 0 (0.0%) |
| 75 Years and older | 80 (100.0%) | 0 (0.0%) |
| Total | 686 (61.6%) | 428 (38.4%) |
Health Insurance Coverage by Citizenship Status in Sycamore
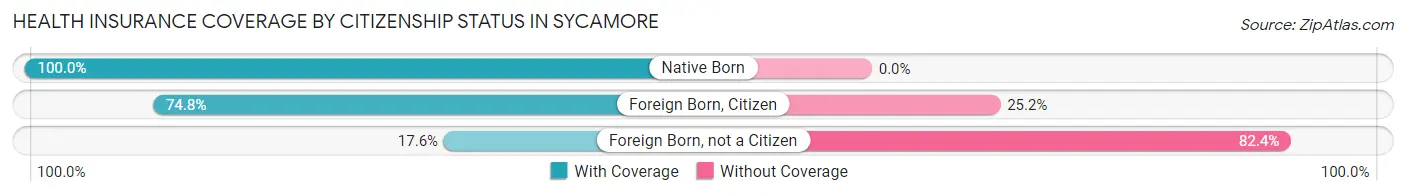
| Citizenship Status | With Coverage | Without Coverage |
| Native Born | 166 (100.0%) | 0 (0.0%) |
| Foreign Born, Citizen | 157 (74.8%) | 53 (25.2%) |
| Foreign Born, not a Citizen | 16 (17.6%) | 75 (82.4%) |
Health Insurance Coverage by Household Income in Sycamore
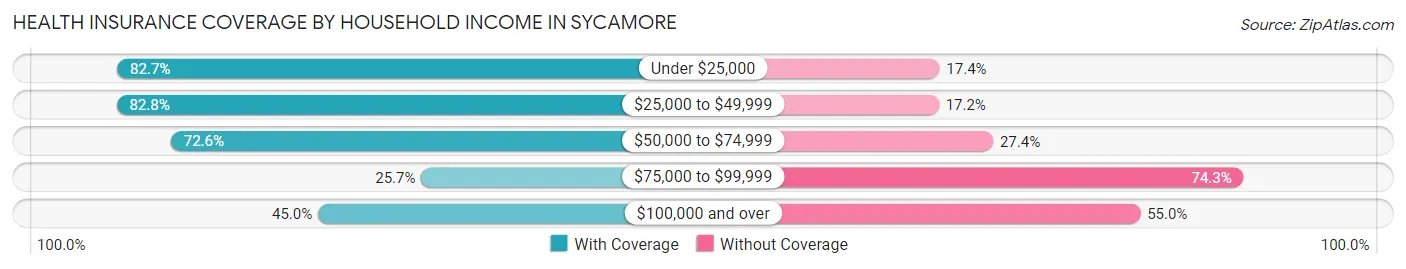
| Household Income | With Coverage | Without Coverage |
| Under $25,000 | 181 (82.7%) | 38 (17.3%) |
| $25,000 to $49,999 | 125 (82.8%) | 26 (17.2%) |
| $50,000 to $74,999 | 273 (72.6%) | 103 (27.4%) |
| $75,000 to $99,999 | 19 (25.7%) | 55 (74.3%) |
| $100,000 and over | 77 (45.0%) | 94 (55.0%) |
Public vs Private Health Insurance Coverage by Age in Sycamore
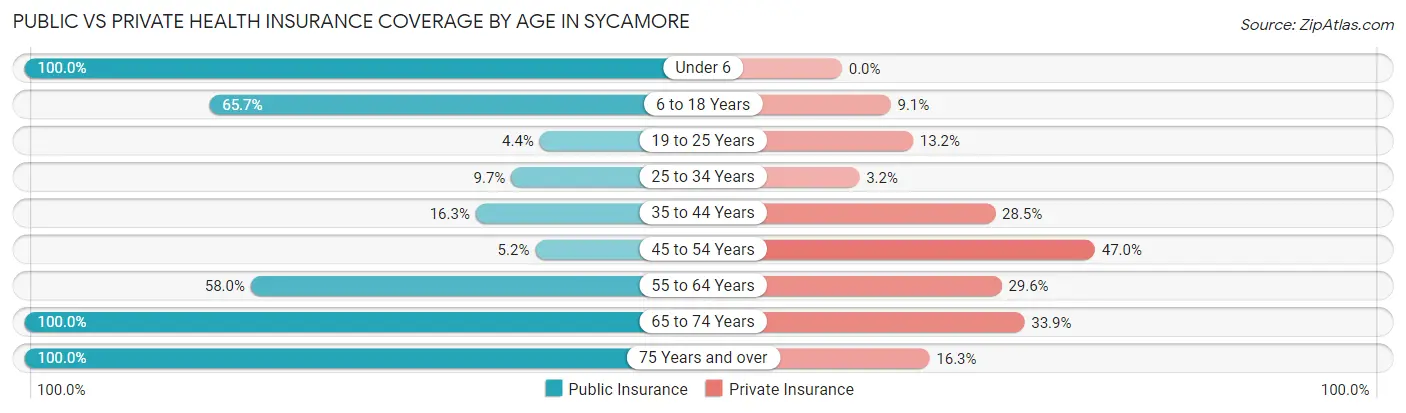
| Age Bracket | Public Insurance | Private Insurance |
| Under 6 | 166 (100.0%) | 0 (0.0%) |
| 6 to 18 Years | 138 (65.7%) | 19 (9.0%) |
| 19 to 25 Years | 4 (4.4%) | 12 (13.2%) |
| 25 to 34 Years | 18 (9.7%) | 6 (3.2%) |
| 35 to 44 Years | 20 (16.3%) | 35 (28.5%) |
| 45 to 54 Years | 6 (5.2%) | 54 (47.0%) |
| 55 to 64 Years | 47 (58.0%) | 24 (29.6%) |
| 65 to 74 Years | 62 (100.0%) | 21 (33.9%) |
| 75 Years and over | 80 (100.0%) | 13 (16.3%) |
| Total | 541 (48.6%) | 184 (16.5%) |
Disability Status by Sex by Age in Sycamore
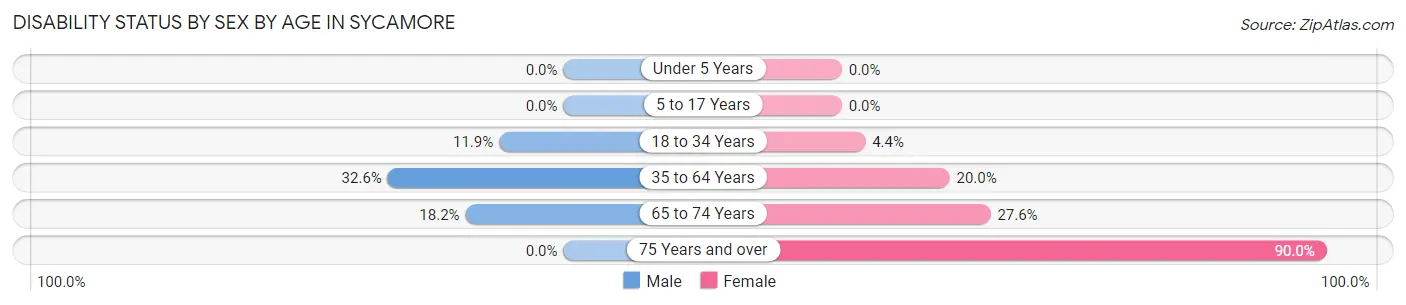
| Age Bracket | Male | Female |
| Under 5 Years | 0 (0.0%) | 0 (0.0%) |
| 5 to 17 Years | 0 (0.0%) | 0 (0.0%) |
| 18 to 34 Years | 26 (11.9%) | 3 (4.3%) |
| 35 to 64 Years | 60 (32.6%) | 27 (20.0%) |
| 65 to 74 Years | 6 (18.2%) | 8 (27.6%) |
| 75 Years and over | 0 (0.0%) | 72 (90.0%) |
Disability Class by Sex by Age in Sycamore
Disability Class: Hearing Difficulty
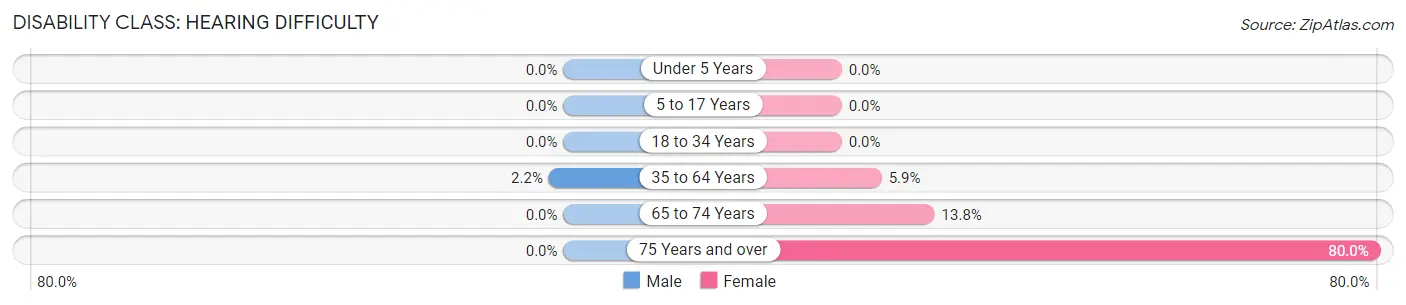
| Age Bracket | Male | Female |
| Under 5 Years | 0 (0.0%) | 0 (0.0%) |
| 5 to 17 Years | 0 (0.0%) | 0 (0.0%) |
| 18 to 34 Years | 0 (0.0%) | 0 (0.0%) |
| 35 to 64 Years | 4 (2.2%) | 8 (5.9%) |
| 65 to 74 Years | 0 (0.0%) | 4 (13.8%) |
| 75 Years and over | 0 (0.0%) | 64 (80.0%) |
Disability Class: Vision Difficulty
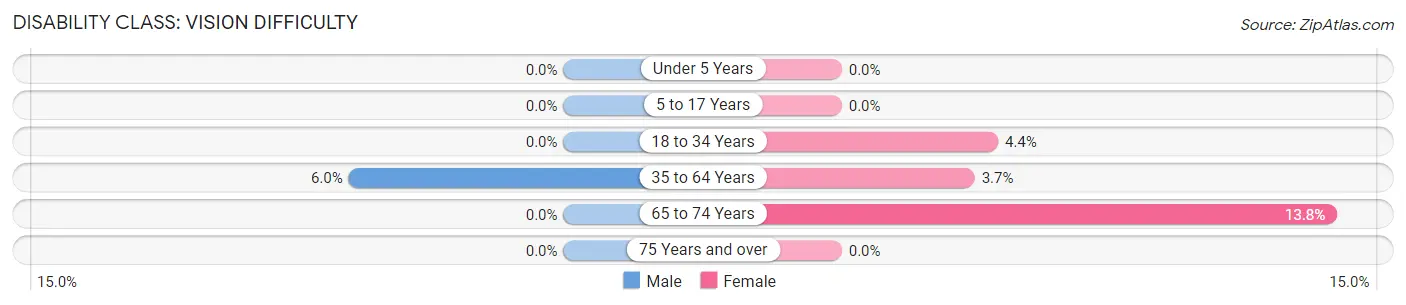
| Age Bracket | Male | Female |
| Under 5 Years | 0 (0.0%) | 0 (0.0%) |
| 5 to 17 Years | 0 (0.0%) | 0 (0.0%) |
| 18 to 34 Years | 0 (0.0%) | 3 (4.3%) |
| 35 to 64 Years | 11 (6.0%) | 5 (3.7%) |
| 65 to 74 Years | 0 (0.0%) | 4 (13.8%) |
| 75 Years and over | 0 (0.0%) | 0 (0.0%) |
Disability Class: Cognitive Difficulty
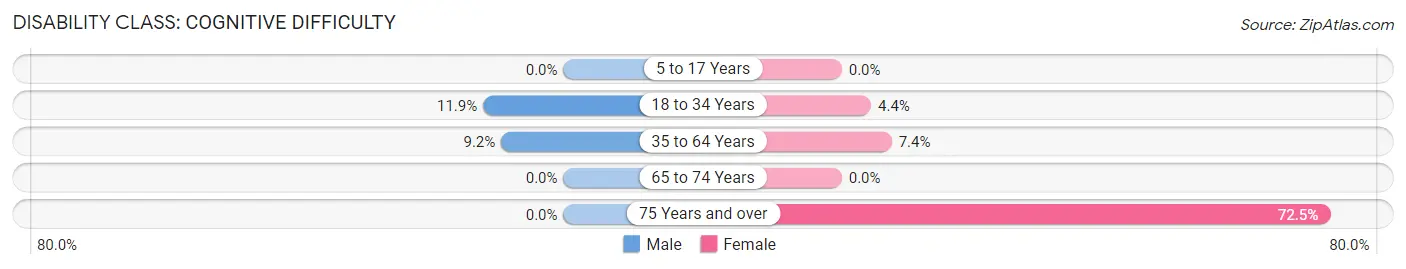
| Age Bracket | Male | Female |
| 5 to 17 Years | 0 (0.0%) | 0 (0.0%) |
| 18 to 34 Years | 26 (11.9%) | 3 (4.3%) |
| 35 to 64 Years | 17 (9.2%) | 10 (7.4%) |
| 65 to 74 Years | 0 (0.0%) | 0 (0.0%) |
| 75 Years and over | 0 (0.0%) | 58 (72.5%) |
Disability Class: Ambulatory Difficulty
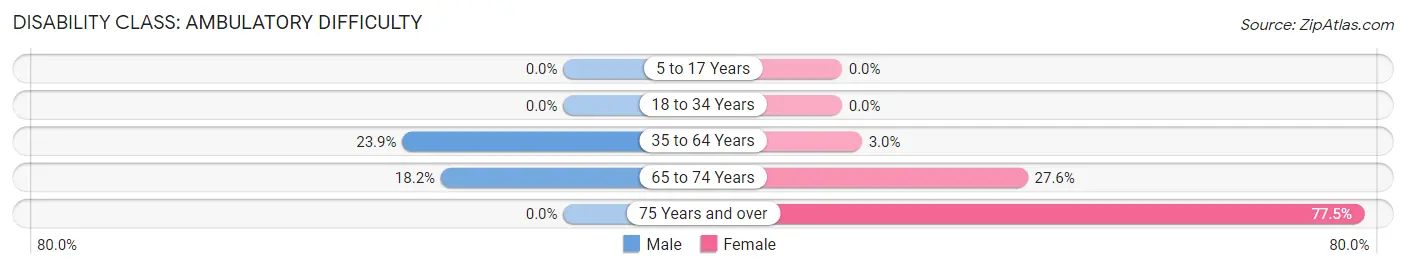
| Age Bracket | Male | Female |
| 5 to 17 Years | 0 (0.0%) | 0 (0.0%) |
| 18 to 34 Years | 0 (0.0%) | 0 (0.0%) |
| 35 to 64 Years | 44 (23.9%) | 4 (3.0%) |
| 65 to 74 Years | 6 (18.2%) | 8 (27.6%) |
| 75 Years and over | 0 (0.0%) | 62 (77.5%) |
Disability Class: Self-Care Difficulty
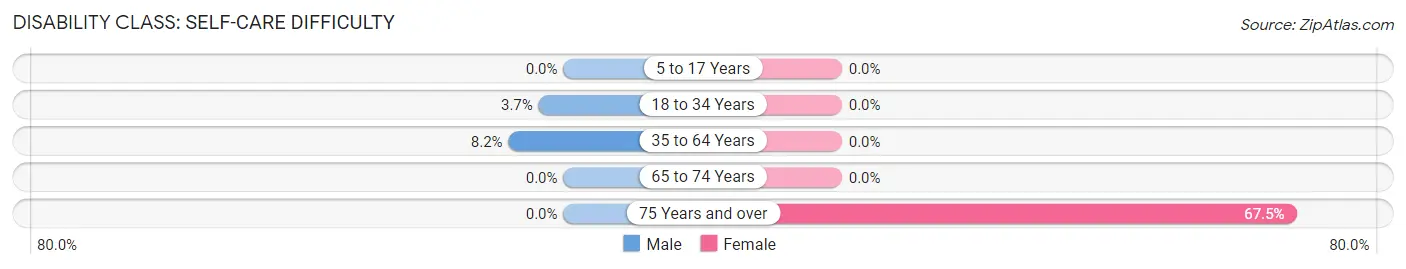
| Age Bracket | Male | Female |
| 5 to 17 Years | 0 (0.0%) | 0 (0.0%) |
| 18 to 34 Years | 8 (3.7%) | 0 (0.0%) |
| 35 to 64 Years | 15 (8.2%) | 0 (0.0%) |
| 65 to 74 Years | 0 (0.0%) | 0 (0.0%) |
| 75 Years and over | 0 (0.0%) | 54 (67.5%) |
Technology Access in Sycamore
Computing Device Access in Sycamore
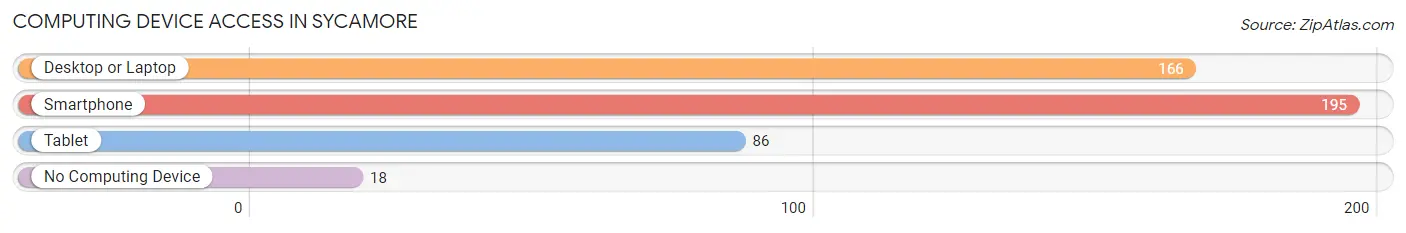
| Device Type | # Households | % Households |
| Desktop or Laptop | 166 | 68.0% |
| Smartphone | 195 | 79.9% |
| Tablet | 86 | 35.2% |
| No Computing Device | 18 | 7.4% |
| Total | 244 | 100.0% |
Internet Access in Sycamore
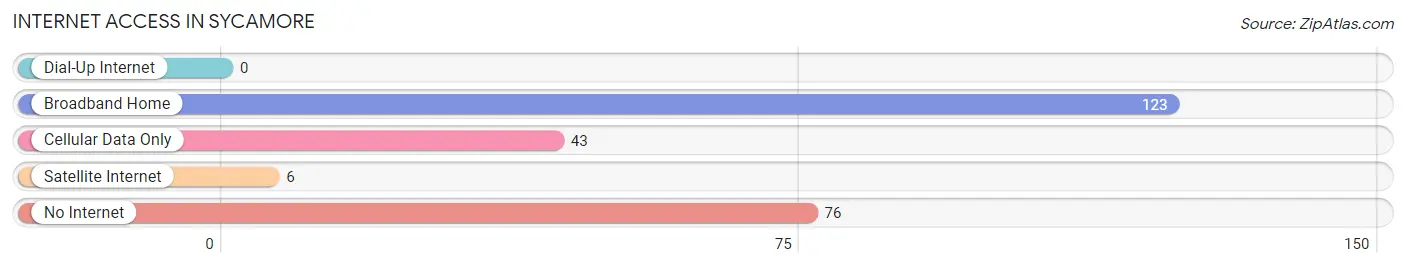
| Internet Type | # Households | % Households |
| Dial-Up Internet | 0 | 0.0% |
| Broadband Home | 123 | 50.4% |
| Cellular Data Only | 43 | 17.6% |
| Satellite Internet | 6 | 2.5% |
| No Internet | 76 | 31.1% |
| Total | 244 | 100.0% |
Sycamore Summary
Sycamore, Georgia is a small town located in the southwestern part of the state, in Turner County. It is situated about halfway between the cities of Albany and Macon, and is part of the Albany metropolitan area. The town was founded in 1854 and has a population of approximately 1,000 people.
History
Sycamore was founded in 1854 by a group of settlers from South Carolina. The town was named after the sycamore trees that grew in the area. The settlers were attracted to the area due to its fertile soil and abundant water supply. The town quickly grew and by the late 1800s, it had become a thriving agricultural center.
The town was also home to a number of businesses, including a cotton gin, a grist mill, and a sawmill. In the early 1900s, the town was home to a number of churches, schools, and other businesses.
In the 1950s, the town began to decline as the population shifted to larger cities. However, in recent years, the town has seen a resurgence in population and economic activity.
Geography
Sycamore is located in the southwestern part of Turner County, Georgia. It is situated about halfway between the cities of Albany and Macon. The town is located on the banks of the Flint River, which provides a source of water for the town.
The town is surrounded by rolling hills and is home to a number of parks and recreational areas. The town is also home to a number of historic sites, including the Sycamore Historic District, which is listed on the National Register of Historic Places.
Economy
Sycamore’s economy is largely based on agriculture. The town is home to a number of farms, which produce a variety of crops, including cotton, corn, soybeans, and peanuts. The town is also home to a number of businesses, including a lumber mill, a feed mill, and a number of retail stores.
Demographics
As of the 2010 census, the population of Sycamore was 1,000 people. The town is predominantly white, with a small African American population. The median household income is $30,000, and the median home value is $90,000.
Sycamore is a small town with a rich history and a bright future. The town is home to a number of businesses and is surrounded by beautiful scenery. The town is a great place to live and work, and is a great place to raise a family.
Common Questions
What is Per Capita Income in Sycamore?
Per Capita income in Sycamore is $15,904.
What is the Median Family Income in Sycamore?
Median Family Income in Sycamore is $50,583.
What is the Median Household income in Sycamore?
Median Household Income in Sycamore is $41,538.
What is Income or Wage Gap in Sycamore?
Income or Wage Gap in Sycamore is 20.4%.
Women in Sycamore earn 79.6 cents for every dollar earned by a man.
What is Inequality or Gini Index in Sycamore?
Inequality or Gini Index in Sycamore is 0.41.
What is the Total Population of Sycamore?
Total Population of Sycamore is 1,223.
What is the Total Male Population of Sycamore?
Total Male Population of Sycamore is 723.
What is the Total Female Population of Sycamore?
Total Female Population of Sycamore is 500.
What is the Ratio of Males per 100 Females in Sycamore?
There are 144.60 Males per 100 Females in Sycamore.
What is the Ratio of Females per 100 Males in Sycamore?
There are 69.16 Females per 100 Males in Sycamore.
What is the Median Population Age in Sycamore?
Median Population Age in Sycamore is 30.6 Years.
What is the Average Family Size in Sycamore
Average Family Size in Sycamore is 5.2 People.
What is the Average Household Size in Sycamore
Average Household Size in Sycamore is 4.1 People.
How Large is the Labor Force in Sycamore?
There are 420 People in the Labor Forcein in Sycamore.
What is the Percentage of People in the Labor Force in Sycamore?
45.4% of People are in the Labor Force in Sycamore.
What is the Unemployment Rate in Sycamore?
Unemployment Rate in Sycamore is 16.0%.