Cities with the Highest Percentage of Immigrants from Guatemala in Georgia
RELATED REPORTS & OPTIONS
Guatemala
Georgia
Compare Cities
Map of Cities with the Highest Percentage of Immigrants from Guatemala in Georgia
0.00%
20.00%
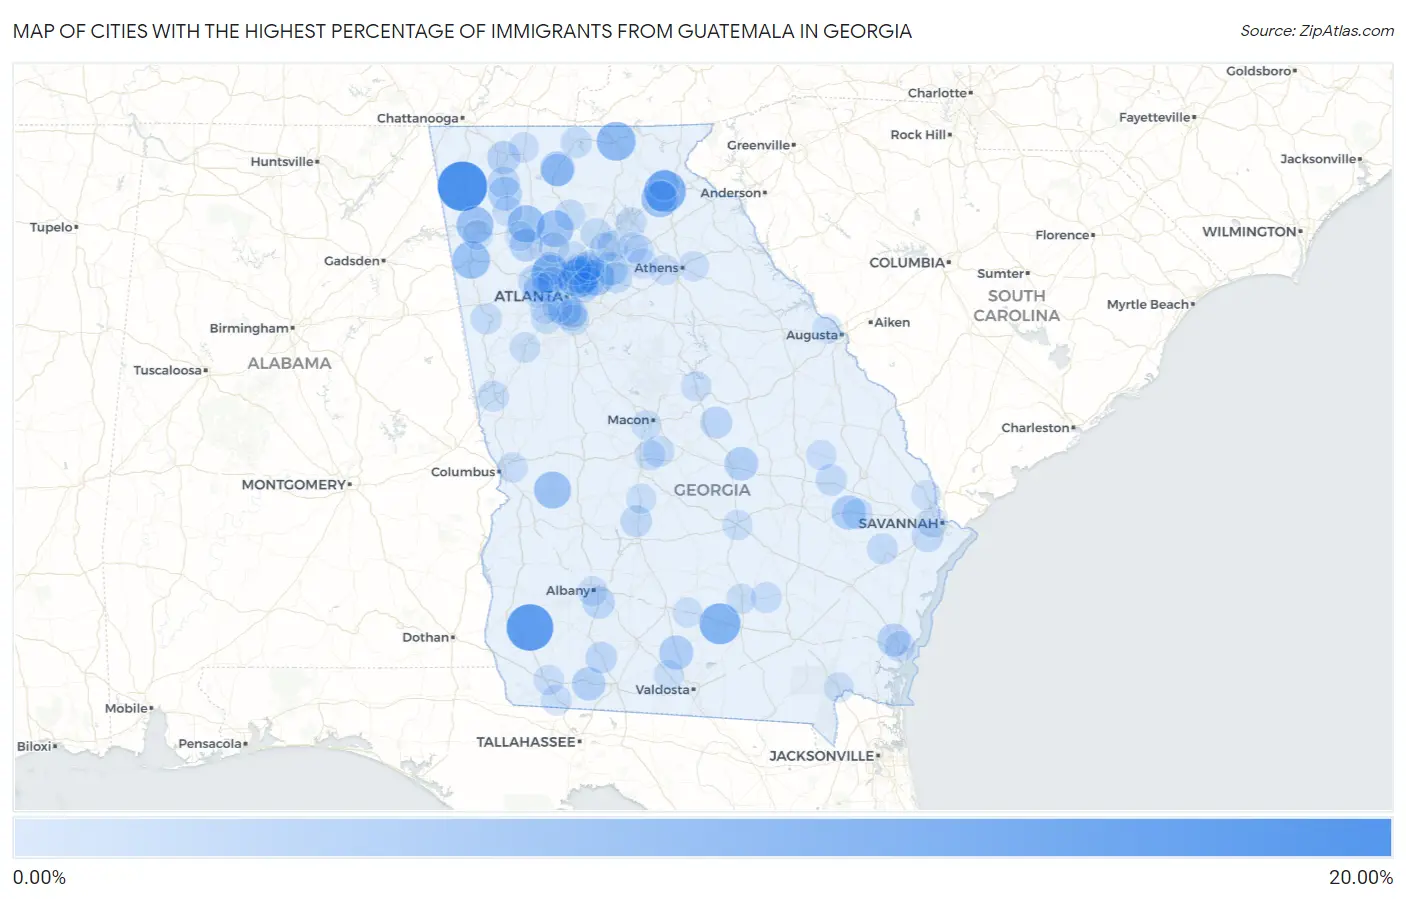
Cities with the Highest Percentage of Immigrants from Guatemala in Georgia
| City | Guatemala | vs State | vs National | |
| 1. | Trion | 16.37% | 0.37%(+16.0)#-1 | 0.32%(+16.0)#0 |
| 2. | Damascus | 13.90% | 0.37%(+13.5)#0 | 0.32%(+13.6)#1 |
| 3. | Cornelia | 9.66% | 0.37%(+9.29)#1 | 0.32%(+9.34)#2 |
| 4. | Willacoochee | 8.95% | 0.37%(+8.58)#2 | 0.32%(+8.64)#3 |
| 5. | Blairsville | 7.34% | 0.37%(+6.96)#3 | 0.32%(+7.02)#4 |
| 6. | Chamblee | 7.01% | 0.37%(+6.64)#127 | 0.32%(+6.70)#2,513 |
| 7. | Cedartown | 6.09% | 0.37%(+5.72)#128 | 0.32%(+5.77)#2,514 |
| 8. | Fair Oaks | 5.99% | 0.37%(+5.62)#129 | 0.32%(+5.67)#2,515 |
| 9. | Rome | 5.81% | 0.37%(+5.44)#130 | 0.32%(+5.49)#2,516 |
| 10. | Doraville | 5.78% | 0.37%(+5.41)#131 | 0.32%(+5.46)#2,517 |
| 11. | Alto | 5.72% | 0.37%(+5.35)#132 | 0.32%(+5.41)#2,518 |
| 12. | Buena Vista | 5.70% | 0.37%(+5.33)#133 | 0.32%(+5.38)#2,519 |
| 13. | White | 5.62% | 0.37%(+5.24)#134 | 0.32%(+5.30)#2,520 |
| 14. | Canton | 5.57% | 0.37%(+5.20)#135 | 0.32%(+5.26)#2,521 |
| 15. | Lilburn | 4.86% | 0.37%(+4.49)#136 | 0.32%(+4.55)#2,522 |
| 16. | Ellijay | 3.77% | 0.37%(+3.40)#137 | 0.32%(+3.45)#2,523 |
| 17. | Claxton | 3.42% | 0.37%(+3.05)#138 | 0.32%(+3.10)#2,524 |
| 18. | Adel | 3.30% | 0.37%(+2.93)#139 | 0.32%(+2.99)#2,525 |
| 19. | Calhoun | 3.10% | 0.37%(+2.73)#140 | 0.32%(+2.78)#2,526 |
| 20. | Hapeville | 3.06% | 0.37%(+2.69)#141 | 0.32%(+2.74)#2,527 |
| 21. | East Dublin | 2.94% | 0.37%(+2.57)#142 | 0.32%(+2.62)#2,528 |
| 22. | Marietta | 2.86% | 0.37%(+2.48)#143 | 0.32%(+2.54)#2,529 |
| 23. | Cairo | 2.78% | 0.37%(+2.41)#144 | 0.32%(+2.47)#2,530 |
| 24. | Lawrenceville | 2.70% | 0.37%(+2.33)#145 | 0.32%(+2.38)#2,531 |
| 25. | Emerson | 2.51% | 0.37%(+2.14)#146 | 0.32%(+2.19)#2,532 |
| 26. | Dalton | 2.51% | 0.37%(+2.13)#147 | 0.32%(+2.19)#2,533 |
| 27. | Dock Junction | 2.35% | 0.37%(+1.98)#148 | 0.32%(+2.03)#2,534 |
| 28. | East Ellijay | 2.08% | 0.37%(+1.70)#149 | 0.32%(+1.76)#2,535 |
| 29. | Putney | 1.82% | 0.37%(+1.45)#150 | 0.32%(+1.50)#2,536 |
| 30. | Toomsboro | 1.67% | 0.37%(+1.30)#151 | 0.32%(+1.36)#2,537 |
| 31. | Resaca | 1.61% | 0.37%(+1.24)#152 | 0.32%(+1.30)#2,538 |
| 32. | Meigs | 1.39% | 0.37%(+1.02)#153 | 0.32%(+1.07)#2,539 |
| 33. | Norcross | 1.30% | 0.37%(+0.928)#154 | 0.32%(+0.983)#2,540 |
| 34. | Vienna | 1.26% | 0.37%(+0.884)#155 | 0.32%(+0.939)#2,541 |
| 35. | Powder Springs | 1.23% | 0.37%(+0.856)#156 | 0.32%(+0.911)#2,542 |
| 36. | Georgetown | 1.22% | 0.37%(+0.852)#157 | 0.32%(+0.907)#2,543 |
| 37. | Metter | 1.13% | 0.37%(+0.759)#158 | 0.32%(+0.814)#2,544 |
| 38. | Grayson | 1.12% | 0.37%(+0.743)#159 | 0.32%(+0.798)#2,545 |
| 39. | Robins Afb | 0.91% | 0.37%(+0.539)#160 | 0.32%(+0.594)#2,546 |
| 40. | Carrollton | 0.91% | 0.37%(+0.532)#161 | 0.32%(+0.588)#2,825 |
| 41. | Cumming | 0.88% | 0.37%(+0.509)#162 | 0.32%(+0.564)#2,826 |
| 42. | Blue Ridge | 0.88% | 0.37%(+0.506)#163 | 0.32%(+0.561)#2,827 |
| 43. | Buford | 0.88% | 0.37%(+0.504)#164 | 0.32%(+0.559)#2,828 |
| 44. | Brookhaven | 0.87% | 0.37%(+0.496)#165 | 0.32%(+0.551)#2,829 |
| 45. | Demorest | 0.83% | 0.37%(+0.456)#166 | 0.32%(+0.511)#2,830 |
| 46. | Fort Stewart | 0.83% | 0.37%(+0.453)#167 | 0.32%(+0.508)#2,831 |
| 47. | Forest Park | 0.82% | 0.37%(+0.448)#168 | 0.32%(+0.503)#2,832 |
| 48. | Mableton | 0.81% | 0.37%(+0.441)#169 | 0.32%(+0.496)#2,833 |
| 49. | Daisy | 0.81% | 0.37%(+0.436)#170 | 0.32%(+0.491)#2,834 |
| 50. | Tucker | 0.78% | 0.37%(+0.403)#171 | 0.32%(+0.458)#2,835 |
| 51. | Webster County Unified Government | 0.72% | 0.37%(+0.349)#172 | 0.32%(+0.404)#2,836 |
| 52. | Ball Ground | 0.71% | 0.37%(+0.339)#173 | 0.32%(+0.395)#2,837 |
| 53. | Morrow | 0.67% | 0.37%(+0.298)#174 | 0.32%(+0.353)#2,838 |
| 54. | Peachtree Corners | 0.66% | 0.37%(+0.284)#175 | 0.32%(+0.339)#2,839 |
| 55. | Brunswick | 0.64% | 0.37%(+0.264)#176 | 0.32%(+0.319)#2,840 |
| 56. | Gainesville | 0.63% | 0.37%(+0.254)#177 | 0.32%(+0.309)#2,841 |
| 57. | Newnan | 0.60% | 0.37%(+0.225)#178 | 0.32%(+0.280)#2,842 |
| 58. | Nicholls | 0.59% | 0.37%(+0.215)#179 | 0.32%(+0.270)#2,843 |
| 59. | Smyrna | 0.58% | 0.37%(+0.211)#180 | 0.32%(+0.266)#2,844 |
| 60. | Attapulgus | 0.56% | 0.37%(+0.187)#181 | 0.32%(+0.242)#2,845 |
| 61. | Warner Robins | 0.55% | 0.37%(+0.177)#182 | 0.32%(+0.232)#2,846 |
| 62. | Lagrange | 0.51% | 0.37%(+0.137)#183 | 0.32%(+0.192)#2,975 |
| 63. | Dunwoody | 0.45% | 0.37%(+0.082)#184 | 0.32%(+0.137)#2,976 |
| 64. | Baldwin | 0.39% | 0.37%(+0.020)#185 | 0.32%(+0.075)#2,977 |
| 65. | Garden City | 0.39% | 0.37%(+0.014)#186 | 0.32%(+0.069)#2,978 |
| 66. | Eton | 0.38% | 0.37%(+0.008)#187 | 0.32%(+0.063)#2,979 |
| 67. | Mcrae Helena | 0.38% | 0.37%(+0.006)#188 | 0.32%(+0.061)#2,980 |
| 68. | Winder | 0.37% | 0.37%(+0.002)#189 | 0.32%(+0.057)#2,981 |
| 69. | Winterville | 0.37% | 0.37%(-0.003)#190 | 0.32%(+0.052)#2,982 |
| 70. | Bainbridge | 0.36% | 0.37%(-0.015)#191 | 0.32%(+0.041)#2,983 |
| 71. | Braselton | 0.35% | 0.37%(-0.025)#192 | 0.32%(+0.030)#2,984 |
| 72. | Clarkston | 0.33% | 0.37%(-0.043)#193 | 0.32%(+0.012)#2,985 |
| 73. | Twin City | 0.32% | 0.37%(-0.048)#194 | 0.32%(+0.007)#2,986 |
| 74. | Milledgeville | 0.32% | 0.37%(-0.050)#195 | 0.32%(+0.005)#2,987 |
| 75. | Conley | 0.32% | 0.37%(-0.050)#196 | 0.32%(+0.005)#2,988 |
| 76. | Bogart | 0.31% | 0.37%(-0.059)#197 | 0.32%(-0.004)#2,989 |
| 77. | Adairsville | 0.31% | 0.37%(-0.067)#198 | 0.32%(-0.012)#2,990 |
| 78. | Columbus | 0.26% | 0.37%(-0.110)#199 | 0.32%(-0.055)#2,991 |
| 79. | Unadilla | 0.26% | 0.37%(-0.112)#200 | 0.32%(-0.057)#2,992 |
| 80. | Lithia Springs | 0.26% | 0.37%(-0.117)#201 | 0.32%(-0.062)#2,993 |
| 81. | Douglas | 0.25% | 0.37%(-0.125)#202 | 0.32%(-0.070)#2,994 |
| 82. | Union City | 0.25% | 0.37%(-0.127)#203 | 0.32%(-0.072)#2,995 |
| 83. | Woodstock | 0.21% | 0.37%(-0.160)#204 | 0.32%(-0.104)#2,996 |
| 84. | Austell | 0.20% | 0.37%(-0.175)#205 | 0.32%(-0.120)#2,997 |
| 85. | Macon Bibb County | 0.17% | 0.37%(-0.199)#206 | 0.32%(-0.144)#2,998 |
| 86. | East Point | 0.17% | 0.37%(-0.200)#207 | 0.32%(-0.145)#2,999 |
| 87. | Morven | 0.17% | 0.37%(-0.202)#208 | 0.32%(-0.147)#3,000 |
| 88. | Albany | 0.17% | 0.37%(-0.203)#209 | 0.32%(-0.148)#3,001 |
| 89. | Athens-Clarke County Unified Government (Balance) | 0.17% | 0.37%(-0.204)#210 | 0.32%(-0.149)#3,002 |
| 90. | Roswell | 0.16% | 0.37%(-0.215)#211 | 0.32%(-0.160)#3,003 |
| 91. | Lindale | 0.15% | 0.37%(-0.220)#212 | 0.32%(-0.164)#3,004 |
| 92. | Sugar Hill | 0.13% | 0.37%(-0.241)#213 | 0.32%(-0.185)#3,005 |
| 93. | Cartersville | 0.13% | 0.37%(-0.243)#214 | 0.32%(-0.188)#3,006 |
| 94. | Hoschton | 0.13% | 0.37%(-0.244)#215 | 0.32%(-0.189)#3,007 |
| 95. | Berkeley Lake | 0.12% | 0.37%(-0.254)#216 | 0.32%(-0.199)#3,008 |
| 96. | Rincon | 0.10% | 0.37%(-0.272)#217 | 0.32%(-0.217)#3,009 |
| 97. | Folkston | 0.088% | 0.37%(-0.285)#218 | 0.32%(-0.230)#3,010 |
| 98. | Martinez | 0.086% | 0.37%(-0.287)#219 | 0.32%(-0.232)#3,011 |
| 99. | South Fulton | 0.084% | 0.37%(-0.288)#220 | 0.32%(-0.233)#3,012 |
| 100. | Enigma | 0.080% | 0.37%(-0.293)#221 | 0.32%(-0.238)#3,013 |
Common Questions
What are the Top 10 Cities with the Highest Percentage of Immigrants from Guatemala in Georgia?
Top 10 Cities with the Highest Percentage of Immigrants from Guatemala in Georgia are:
#1
16.37%
#2
13.90%
#3
9.66%
#4
8.95%
#5
7.34%
#6
7.01%
#7
6.09%
#8
5.99%
#9
5.81%
#10
5.78%
What city has the Highest Percentage of Immigrants from Guatemala in Georgia?
Trion has the Highest Percentage of Immigrants from Guatemala in Georgia with 16.37%.
What is the Percentage of Immigrants from Guatemala in the State of Georgia?
Percentage of Immigrants from Guatemala in Georgia is 0.37%.
What is the Percentage of Immigrants from Guatemala in the United States?
Percentage of Immigrants from Guatemala in the United States is 0.32%.