Zip Codes with the Highest Percentage of Population Employed in Food Preparation & Serving in Newnan, GA
RELATED REPORTS & OPTIONS
Food Preparation & Serving
Newnan
Compare Zip Codes
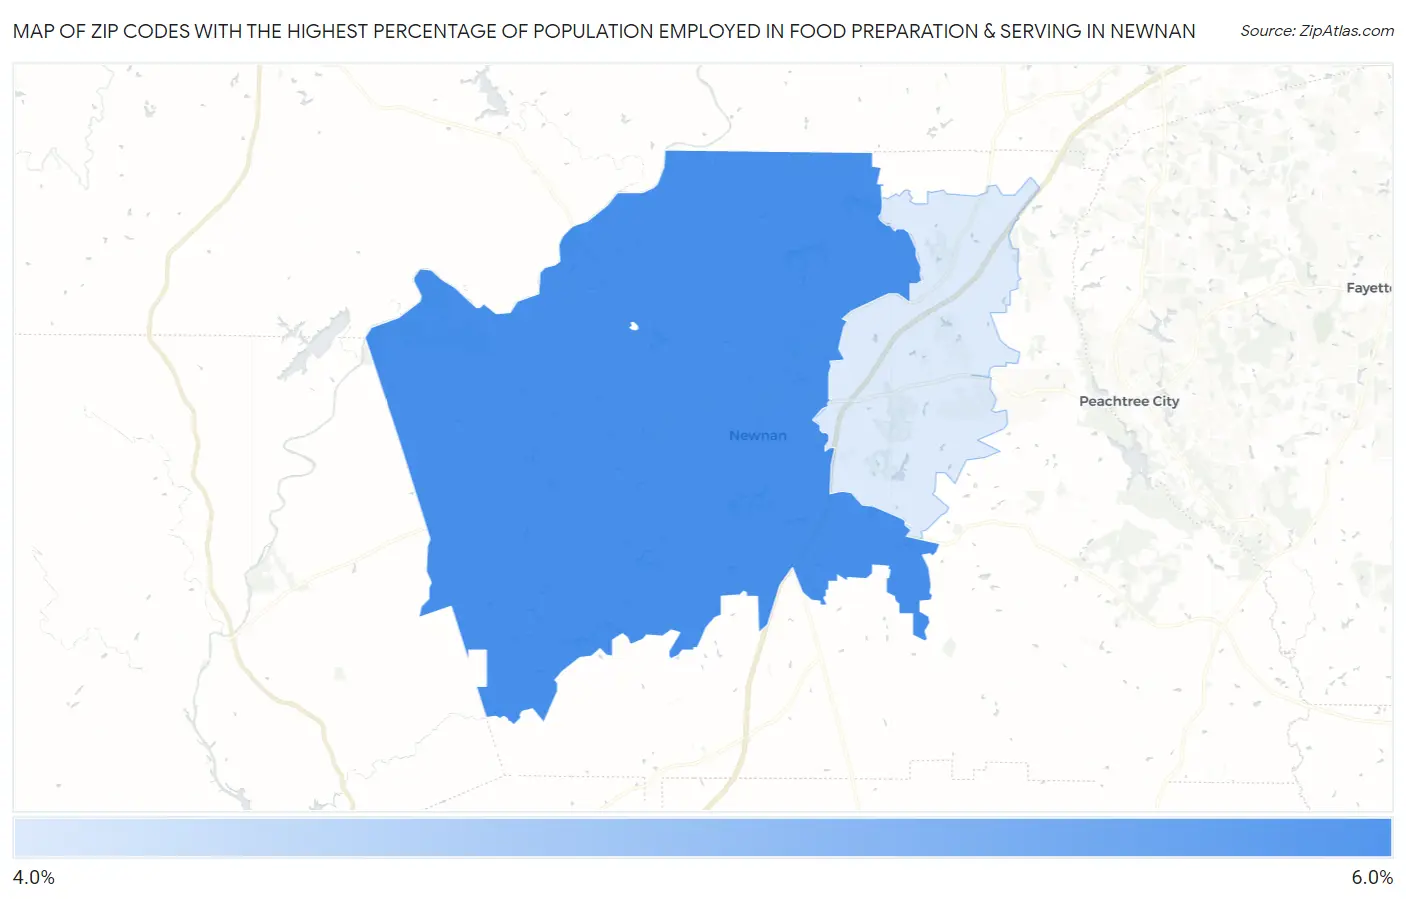
Map of Zip Codes with the Highest Percentage of Population Employed in Food Preparation & Serving in Newnan
4.6%
5.9%
Zip Codes with the Highest Percentage of Population Employed in Food Preparation & Serving in Newnan, GA
| Zip Code | % Employed | vs State | vs National | |
| 1. | 30263 | 5.9% | 5.1%(+0.726)#216 | 5.3%(+0.585)#9,781 |
| 2. | 30265 | 4.6% | 5.1%(-0.558)#343 | 5.3%(-0.699)#14,663 |
1
Common Questions
What are the Top Zip Codes with the Highest Percentage of Population Employed in Food Preparation & Serving in Newnan, GA?
Top Zip Codes with the Highest Percentage of Population Employed in Food Preparation & Serving in Newnan, GA are:
What zip code has the Highest Percentage of Population Employed in Food Preparation & Serving in Newnan, GA?
30263 has the Highest Percentage of Population Employed in Food Preparation & Serving in Newnan, GA with 5.9%.
What is the Percentage of Population Employed in Food Preparation & Serving in Newnan, GA?
Percentage of Population Employed in Food Preparation & Serving in Newnan is 4.7%.
What is the Percentage of Population Employed in Food Preparation & Serving in Georgia?
Percentage of Population Employed in Food Preparation & Serving in Georgia is 5.1%.
What is the Percentage of Population Employed in Food Preparation & Serving in the United States?
Percentage of Population Employed in Food Preparation & Serving in the United States is 5.3%.