Zip Codes with the Highest Percentage of Population Employed in Food Preparation & Serving in Jonesboro, GA
RELATED REPORTS & OPTIONS
Food Preparation & Serving
Jonesboro
Compare Zip Codes
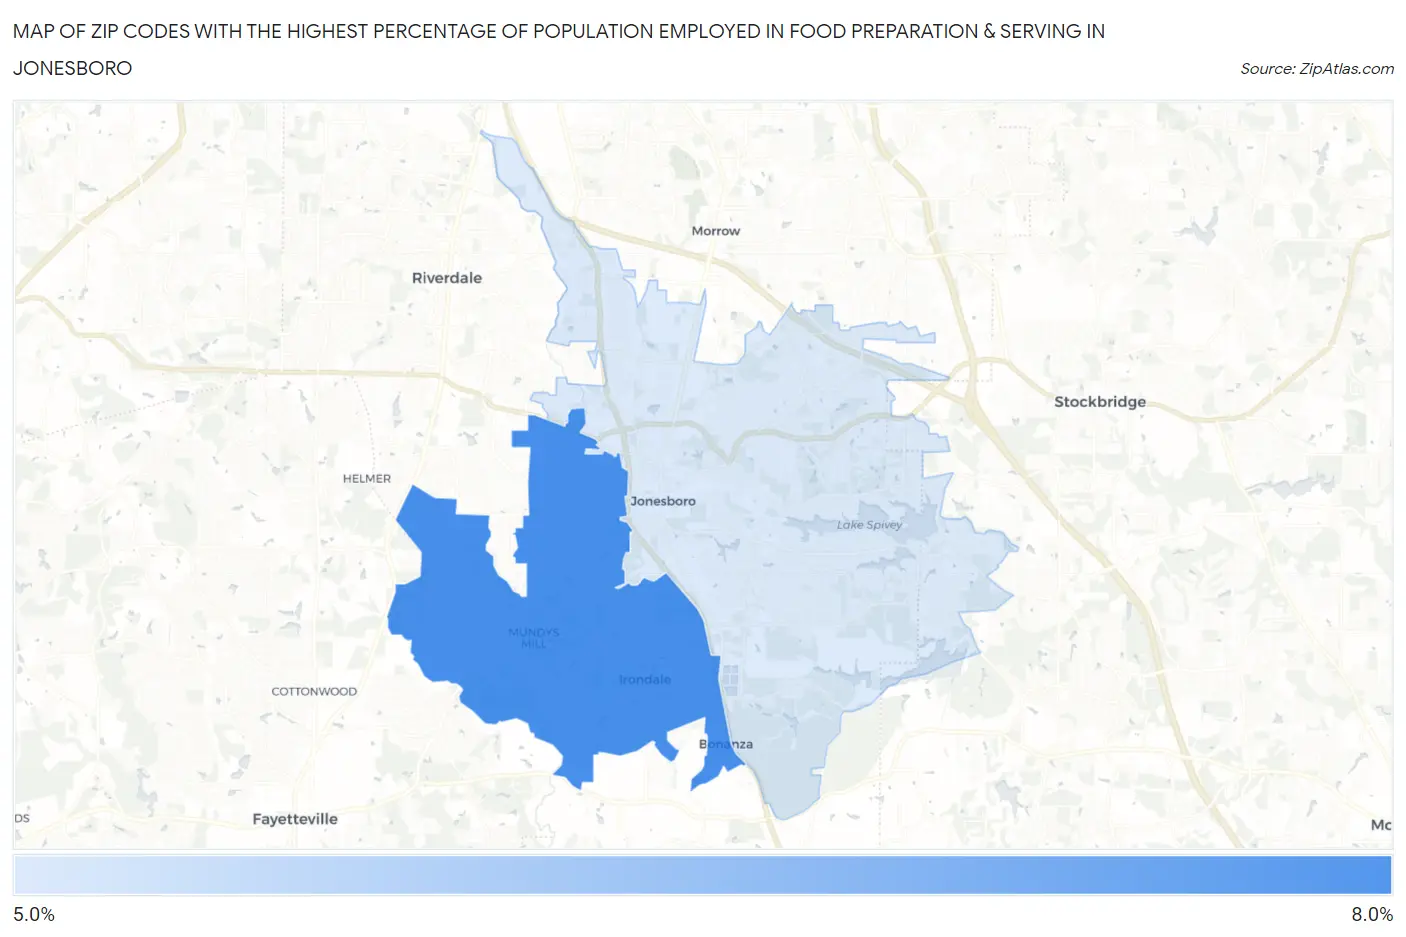
Map of Zip Codes with the Highest Percentage of Population Employed in Food Preparation & Serving in Jonesboro
5.7%
7.3%
Zip Codes with the Highest Percentage of Population Employed in Food Preparation & Serving in Jonesboro, GA
| Zip Code | % Employed | vs State | vs National | |
| 1. | 30238 | 7.3% | 5.1%(+2.12)#121 | 5.3%(+1.98)#5,989 |
| 2. | 30236 | 5.7% | 5.1%(+0.596)#234 | 5.3%(+0.455)#10,203 |
1
Common Questions
What are the Top Zip Codes with the Highest Percentage of Population Employed in Food Preparation & Serving in Jonesboro, GA?
Top Zip Codes with the Highest Percentage of Population Employed in Food Preparation & Serving in Jonesboro, GA are:
What zip code has the Highest Percentage of Population Employed in Food Preparation & Serving in Jonesboro, GA?
30238 has the Highest Percentage of Population Employed in Food Preparation & Serving in Jonesboro, GA with 7.3%.
What is the Percentage of Population Employed in Food Preparation & Serving in Jonesboro, GA?
Percentage of Population Employed in Food Preparation & Serving in Jonesboro is 9.6%.
What is the Percentage of Population Employed in Food Preparation & Serving in Georgia?
Percentage of Population Employed in Food Preparation & Serving in Georgia is 5.1%.
What is the Percentage of Population Employed in Food Preparation & Serving in the United States?
Percentage of Population Employed in Food Preparation & Serving in the United States is 5.3%.