Cherokee Self-Care Disability
COMPARE
Cherokee
Select to Compare
Self-Care Disability
Cherokee Self-Care Disability
2.9%
SELF-CARE DISABILITY
0.0/ 100
METRIC RATING
324th/ 347
METRIC RANK
Cherokee Self-Care Disability Correlation Chart
The statistical analysis conducted on geographies consisting of 492,732,584 people shows a mild positive correlation between the proportion of Cherokee and percentage of population with self-care disability in the United States with a correlation coefficient (R) of 0.358 and weighted average of 2.9%. On average, for every 1% (one percent) increase in Cherokee within a typical geography, there is an increase of 0.039% in percentage of population with self-care disability.
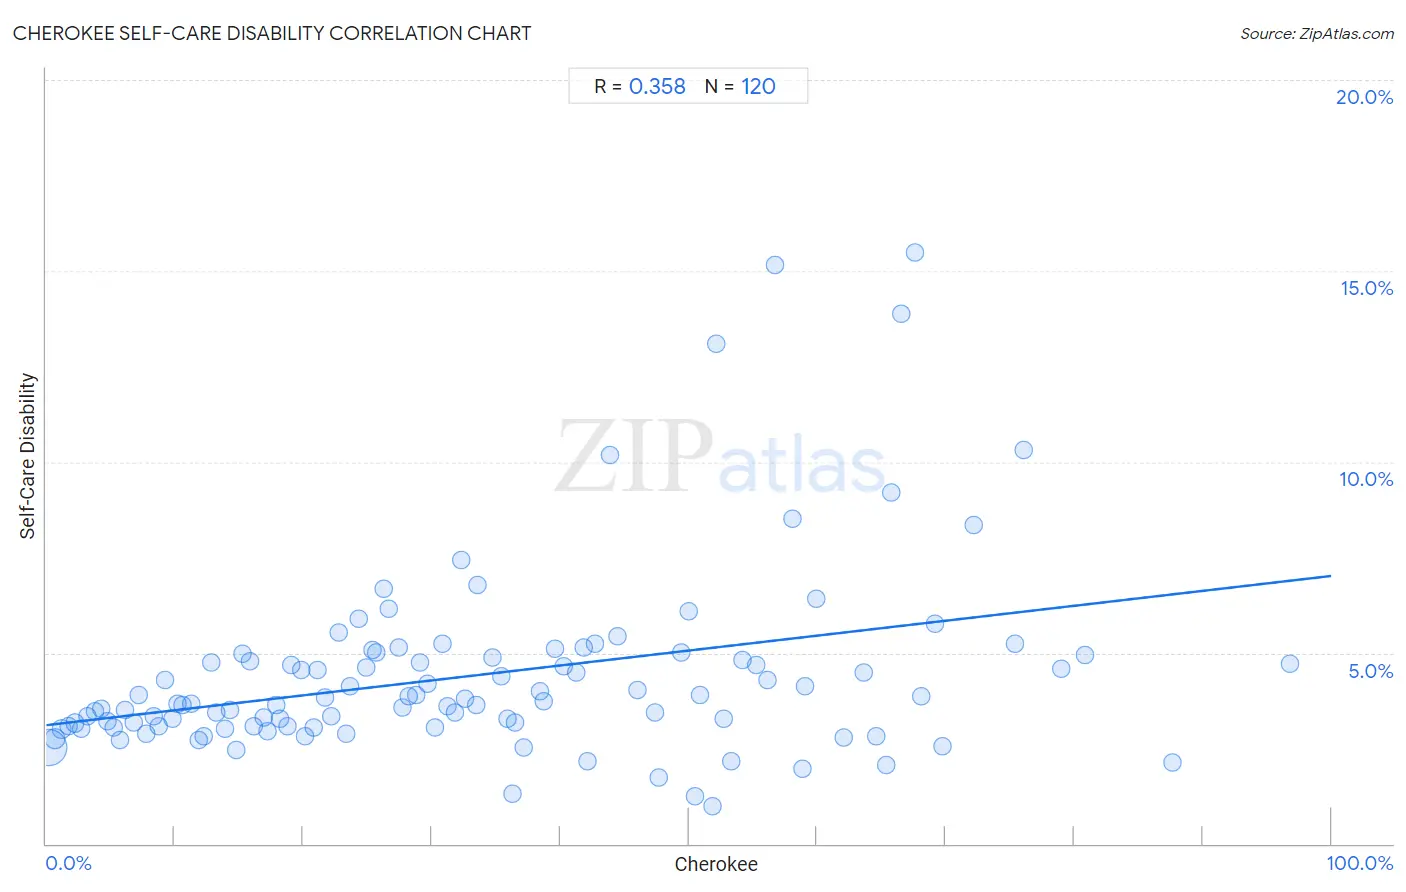
It is essential to understand that the correlation between the percentage of Cherokee and percentage of population with self-care disability does not imply a direct cause-and-effect relationship. It remains uncertain whether the presence of Cherokee influences an upward or downward trend in the level of percentage of population with self-care disability within an area, or if Cherokee simply ended up residing in those areas with higher or lower levels of percentage of population with self-care disability due to other factors.
Demographics Similar to Cherokee by Self-Care Disability
In terms of self-care disability, the demographic groups most similar to Cherokee are Seminole (2.9%, a difference of 0.10%), Comanche (2.9%, a difference of 0.22%), Immigrants from Uzbekistan (2.9%, a difference of 0.53%), Navajo (2.9%, a difference of 0.55%), and Chickasaw (2.9%, a difference of 0.70%).
| Demographics | Rating | Rank | Self-Care Disability |
| Immigrants from Dominica | 0.0 /100 | #317 | Tragic 2.8% |
| Assyrians/Chaldeans/Syriacs | 0.0 /100 | #318 | Tragic 2.8% |
| Spanish American Indians | 0.0 /100 | #319 | Tragic 2.9% |
| Chickasaw | 0.0 /100 | #320 | Tragic 2.9% |
| Navajo | 0.0 /100 | #321 | Tragic 2.9% |
| Comanche | 0.0 /100 | #322 | Tragic 2.9% |
| Seminole | 0.0 /100 | #323 | Tragic 2.9% |
| Cherokee | 0.0 /100 | #324 | Tragic 2.9% |
| Immigrants from Uzbekistan | 0.0 /100 | #325 | Tragic 2.9% |
| Paiute | 0.0 /100 | #326 | Tragic 2.9% |
| Blacks/African Americans | 0.0 /100 | #327 | Tragic 2.9% |
| Hopi | 0.0 /100 | #328 | Tragic 2.9% |
| Cajuns | 0.0 /100 | #329 | Tragic 2.9% |
| Nepalese | 0.0 /100 | #330 | Tragic 3.0% |
| Lumbee | 0.0 /100 | #331 | Tragic 3.0% |
Cherokee Self-Care Disability Correlation Summary
| Measurement | Cherokee Data | Self-Care Disability Data |
| Minimum | 0.20% | 0.97% |
| Maximum | 96.8% | 15.5% |
| Range | 96.6% | 14.5% |
| Mean | 33.6% | 4.4% |
| Median | 30.0% | 3.8% |
| Interquartile 25% (IQ1) | 15.0% | 3.1% |
| Interquartile 75% (IQ3) | 50.6% | 4.9% |
| Interquartile Range (IQR) | 35.6% | 1.8% |
| Standard Deviation (Sample) | 22.6% | 2.5% |
| Standard Deviation (Population) | 22.5% | 2.5% |
Correlation Details
| Cherokee Percentile | Sample Size | Self-Care Disability |
[ 0.0% - 0.5% ] 0.20% | 408,059,169 | 2.5% |
[ 0.5% - 1.0% ] 0.68% | 57,496,410 | 2.8% |
[ 1.0% - 1.5% ] 1.19% | 11,960,498 | 3.0% |
[ 1.5% - 2.0% ] 1.74% | 5,725,189 | 3.1% |
[ 2.0% - 2.5% ] 2.22% | 2,687,523 | 3.2% |
[ 2.5% - 3.0% ] 2.72% | 1,512,444 | 3.0% |
[ 3.0% - 3.5% ] 3.23% | 874,388 | 3.3% |
[ 3.5% - 4.0% ] 3.76% | 621,502 | 3.5% |
[ 4.0% - 4.5% ] 4.26% | 407,532 | 3.5% |
[ 4.5% - 5.0% ] 4.80% | 818,994 | 3.2% |
[ 5.0% - 5.5% ] 5.24% | 430,731 | 3.0% |
[ 5.5% - 6.0% ] 5.78% | 377,986 | 2.7% |
[ 6.0% - 6.5% ] 6.16% | 123,198 | 3.5% |
[ 6.5% - 7.0% ] 6.79% | 140,030 | 3.2% |
[ 7.0% - 7.5% ] 7.25% | 154,233 | 3.9% |
[ 7.5% - 8.0% ] 7.76% | 187,521 | 2.9% |
[ 8.0% - 8.5% ] 8.32% | 72,359 | 3.3% |
[ 8.5% - 9.0% ] 8.72% | 105,814 | 3.1% |
[ 9.0% - 9.5% ] 9.29% | 60,541 | 4.3% |
[ 9.5% - 10.0% ] 9.81% | 33,567 | 3.3% |
[ 10.0% - 10.5% ] 10.22% | 54,660 | 3.7% |
[ 10.5% - 11.0% ] 10.65% | 27,526 | 3.6% |
[ 11.0% - 11.5% ] 11.29% | 19,029 | 3.7% |
[ 11.5% - 12.0% ] 11.87% | 21,669 | 2.7% |
[ 12.0% - 12.5% ] 12.21% | 42,758 | 2.8% |
[ 12.5% - 13.0% ] 12.87% | 6,202 | 4.7% |
[ 13.0% - 13.5% ] 13.22% | 11,187 | 3.4% |
[ 13.5% - 14.0% ] 13.88% | 18,924 | 3.0% |
[ 14.0% - 14.5% ] 14.29% | 54,828 | 3.5% |
[ 14.5% - 15.0% ] 14.80% | 48,012 | 2.4% |
[ 15.0% - 15.5% ] 15.29% | 10,986 | 5.0% |
[ 15.5% - 16.0% ] 15.87% | 8,962 | 4.8% |
[ 16.0% - 16.5% ] 16.11% | 41,601 | 3.1% |
[ 16.5% - 17.0% ] 16.89% | 73,191 | 3.3% |
[ 17.0% - 17.5% ] 17.25% | 11,067 | 2.9% |
[ 17.5% - 18.0% ] 17.87% | 8,720 | 3.6% |
[ 18.0% - 18.5% ] 18.16% | 41,088 | 3.3% |
[ 18.5% - 19.0% ] 18.77% | 19,312 | 3.1% |
[ 19.0% - 19.5% ] 19.11% | 1,690 | 4.7% |
[ 19.5% - 20.0% ] 19.83% | 1,039 | 4.6% |
[ 20.0% - 20.5% ] 20.18% | 31,550 | 2.8% |
[ 20.5% - 21.0% ] 20.86% | 20,194 | 3.0% |
[ 21.0% - 21.5% ] 21.13% | 6,274 | 4.6% |
[ 21.5% - 22.0% ] 21.73% | 15,650 | 3.8% |
[ 22.0% - 22.5% ] 22.16% | 4,834 | 3.3% |
[ 22.5% - 23.0% ] 22.77% | 3,966 | 5.5% |
[ 23.0% - 23.5% ] 23.34% | 917 | 2.9% |
[ 23.5% - 24.0% ] 23.67% | 5,877 | 4.1% |
[ 24.0% - 24.5% ] 24.28% | 13,446 | 5.9% |
[ 24.5% - 25.0% ] 24.92% | 2,693 | 4.6% |
[ 25.0% - 25.5% ] 25.42% | 18,055 | 5.1% |
[ 25.5% - 26.0% ] 25.66% | 9,621 | 5.0% |
[ 26.0% - 26.5% ] 26.25% | 9,307 | 6.7% |
[ 26.5% - 27.0% ] 26.65% | 1,966 | 6.2% |
[ 27.0% - 27.5% ] 27.42% | 19,115 | 5.1% |
[ 27.5% - 28.0% ] 27.71% | 2,645 | 3.6% |
[ 28.0% - 28.5% ] 28.20% | 3,503 | 3.9% |
[ 28.5% - 29.0% ] 28.76% | 1,763 | 3.9% |
[ 29.0% - 29.5% ] 29.10% | 756 | 4.8% |
[ 29.5% - 30.0% ] 29.70% | 10,864 | 4.2% |
[ 30.0% - 30.5% ] 30.25% | 4,096 | 3.1% |
[ 30.5% - 31.0% ] 30.80% | 6,717 | 5.2% |
[ 31.0% - 31.5% ] 31.19% | 7,973 | 3.6% |
[ 31.5% - 32.0% ] 31.82% | 7,184 | 3.4% |
[ 32.0% - 32.5% ] 32.27% | 313 | 7.4% |
[ 32.5% - 33.0% ] 32.62% | 2,293 | 3.8% |
[ 33.0% - 33.5% ] 33.48% | 16,930 | 3.6% |
[ 33.5% - 34.0% ] 33.55% | 1,523 | 6.8% |
[ 34.5% - 35.0% ] 34.71% | 4,500 | 4.9% |
[ 35.0% - 35.5% ] 35.41% | 6,616 | 4.4% |
[ 35.5% - 36.0% ] 35.87% | 11,984 | 3.3% |
[ 36.0% - 36.5% ] 36.28% | 317 | 1.3% |
[ 36.5% - 37.0% ] 36.52% | 827 | 3.2% |
[ 37.0% - 37.5% ] 37.17% | 460 | 2.5% |
[ 38.0% - 38.5% ] 38.41% | 3,697 | 4.0% |
[ 38.5% - 39.0% ] 38.70% | 32,381 | 3.7% |
[ 39.5% - 40.0% ] 39.57% | 4,554 | 5.1% |
[ 40.0% - 40.5% ] 40.30% | 6,665 | 4.6% |
[ 41.0% - 41.5% ] 41.23% | 1,266 | 4.5% |
[ 41.5% - 42.0% ] 41.82% | 3,300 | 5.1% |
[ 42.0% - 42.5% ] 42.16% | 268 | 2.2% |
[ 42.5% - 43.0% ] 42.74% | 1,542 | 5.2% |
[ 43.5% - 44.0% ] 43.89% | 540 | 10.2% |
[ 44.0% - 44.5% ] 44.47% | 524 | 5.4% |
[ 46.0% - 46.5% ] 46.03% | 2,900 | 4.0% |
[ 47.0% - 47.5% ] 47.41% | 2,871 | 3.4% |
[ 47.5% - 48.0% ] 47.66% | 770 | 1.7% |
[ 49.0% - 49.5% ] 49.42% | 4,589 | 5.0% |
[ 50.0% - 50.5% ] 50.00% | 230 | 6.1% |
[ 50.0% - 50.5% ] 50.45% | 333 | 1.2% |
[ 50.5% - 51.0% ] 50.84% | 1,548 | 3.9% |
[ 51.5% - 52.0% ] 51.89% | 318 | 0.97% |
[ 52.0% - 52.5% ] 52.10% | 119 | 13.1% |
[ 52.5% - 53.0% ] 52.71% | 4,618 | 3.3% |
[ 53.0% - 53.5% ] 53.31% | 1,467 | 2.1% |
[ 54.0% - 54.5% ] 54.22% | 249 | 4.8% |
[ 55.0% - 55.5% ] 55.25% | 1,171 | 4.7% |
[ 56.0% - 56.5% ] 56.15% | 1,464 | 4.3% |
[ 56.5% - 57.0% ] 56.76% | 37 | 15.2% |
[ 58.0% - 58.5% ] 58.05% | 348 | 8.5% |
[ 58.5% - 59.0% ] 58.89% | 270 | 2.0% |
[ 59.0% - 59.5% ] 59.09% | 12,720 | 4.1% |
[ 59.5% - 60.0% ] 59.93% | 277 | 6.4% |
[ 62.0% - 62.5% ] 62.09% | 306 | 2.8% |
[ 63.5% - 64.0% ] 63.61% | 327 | 4.5% |
[ 64.5% - 65.0% ] 64.55% | 330 | 2.8% |
[ 65.0% - 65.5% ] 65.38% | 598 | 2.1% |
[ 65.5% - 66.0% ] 65.79% | 76 | 9.2% |
[ 66.5% - 67.0% ] 66.58% | 386 | 13.9% |
[ 67.5% - 68.0% ] 67.61% | 71 | 15.5% |
[ 68.0% - 68.5% ] 68.07% | 570 | 3.9% |
[ 69.0% - 69.5% ] 69.19% | 1,279 | 5.8% |
[ 69.5% - 70.0% ] 69.72% | 535 | 2.6% |
[ 72.0% - 72.5% ] 72.22% | 36 | 8.3% |
[ 75.0% - 75.5% ] 75.43% | 1,795 | 5.2% |
[ 76.0% - 76.5% ] 76.10% | 410 | 10.3% |
[ 79.0% - 79.5% ] 79.02% | 6,854 | 4.6% |
[ 80.5% - 81.0% ] 80.85% | 726 | 4.9% |
[ 87.5% - 88.0% ] 87.63% | 97 | 2.1% |
[ 96.5% - 97.0% ] 96.79% | 343 | 4.7% |