Iranian Self-Care Disability

COMPARE

Iranian
Race
Ancestry
AfghanAfricanAlaska NativeAlaskan AthabascanAlbanianAleutAlsatianAmericanApacheArabArapahoArgentineanArmenianAssyrian/Chaldean/SyriacAustralianAustrianBahamianBangladeshiBarbadianBasqueBelgianBelizeanBermudanBhutaneseBlackfeetBolivianBrazilianBritishBritish West IndianBulgarianBurmeseCajunCambodianCanadianCape VerdeanCarpatho RusynCelticCentral AmericanCentral American IndianCherokeeCheyenneChickasawChileanChineseChippewaChoctawColombianColvilleComancheCosta RicanCreeCreekCroatianCrowCubanCypriotCzechCzechoslovakianDanishDelawareDominicanDutchDutch West IndianEastern EuropeanEcuadorianEgyptianEnglishEstonianEthiopianEuropeanFijianFilipinoFinnishFrenchFrench American IndianFrench CanadianGermanGerman RussianGhanaianGreekGuamanian/ChamorroGuatemalanGuyaneseHaitianHmongHonduranHopiHoumaHungarianIcelanderIndian (Asian)IndonesianInupiatIranianIraqiIrishIroquoisIsraeliItalianJamaicanJapaneseJordanianKenyanKiowaKoreanLaotianLatvianLebaneseLiberianLithuanianLumbeeLuxembourgerMacedonianMalaysianMalteseMarshalleseMenomineeMexicanMexican American IndianMongolianMoroccanNative HawaiianNavajoNepaleseNew ZealanderNicaraguanNigerianNorthern EuropeanNorwegianOkinawanOsageOttawaPaiutePakistaniPalestinianPanamanianParaguayanPennsylvania GermanPeruvianPimaPolishPortuguesePotawatomiPuebloPuerto RicanPuget Sound SalishRomanianRussianSalvadoranSamoanScandinavianScotch-IrishScottishSeminoleSenegaleseSerbianShoshoneSierra LeoneanSiouxSlavicSlovakSloveneSomaliSouth AfricanSouth AmericanSouth American IndianSoviet UnionSpaniardSpanishSpanish AmericanSpanish American IndianSri LankanSubsaharan AfricanSudaneseSwedishSwissSyrianTaiwaneseThaiTlingit-HaidaTohono O'OdhamTonganTrinidadian and TobagonianTsimshianTurkishU.S. Virgin IslanderUgandanUkrainianUruguayanUteVenezuelanVietnameseWelshWest IndianYakamaYaquiYugoslavianYumanYup'ikZimbabwean
Immigration
NonimmigrantsImmigrantsAfghanistanAfricaAlbaniaArgentinaArmeniaAsiaAustraliaAustriaBahamasBangladeshBarbadosBelarusBelgiumBelizeBoliviaBosnia and HerzegovinaBrazilBulgariaBurma/MyanmarCabo VerdeCambodiaCameroonCanadaCaribbeanCentral AmericaChileChinaColombiaCongoCosta RicaCroatiaCubaCzechoslovakiaDenmarkDominicaDominican RepublicEastern AfricaEastern AsiaEastern EuropeEcuadorEgyptEl SalvadorEnglandEritreaEthiopiaEuropeFijiFranceGermanyGhanaGreeceGrenadaGuatemalaGuyanaHaitiHondurasHong KongHungaryIndiaIndonesiaIranIraqIrelandIsraelItalyJamaicaJapanJordanKazakhstanKenyaKoreaKuwaitLaosLatin AmericaLatviaLebanonLiberiaLithuaniaMalaysiaMexicoMicronesiaMiddle AfricaMoldovaMoroccoNepalNetherlandsNicaraguaNigeriaNorth AmericaNorth MacedoniaNorthern AfricaNorthern EuropeNorwayOceaniaPakistanPanamaPeruPhilippinesPolandPortugalRomaniaRussiaSaudi ArabiaScotlandSenegalSerbiaSierra LeoneSingaporeSomaliaSouth AfricaSouth AmericaSouth Central AsiaSouth Eastern AsiaSouthern EuropeSpainSri LankaSt. Vincent and the GrenadinesSudanSwedenSwitzerlandSyriaTaiwanThailandTrinidad and TobagoTurkeyUgandaUkraineUruguayUzbekistanVenezuelaVietnamWest IndiesWestern AfricaWestern AsiaWestern EuropeYemenZaireZimbabweAzores
Select to Compare
Race
Ancestry
AfghanAfricanAlaska NativeAlaskan AthabascanAlbanianAleutAlsatianAmericanApacheArabArapahoArgentineanArmenianAssyrian/Chaldean/SyriacAustralianAustrianBahamianBangladeshiBarbadianBasqueBelgianBelizeanBermudanBhutaneseBlackfeetBolivianBrazilianBritishBritish West IndianBulgarianBurmeseCajunCambodianCanadianCape VerdeanCarpatho RusynCelticCentral AmericanCentral American IndianCherokeeCheyenneChickasawChileanChineseChippewaChoctawColombianColvilleComancheCosta RicanCreeCreekCroatianCrowCubanCypriotCzechCzechoslovakianDanishDelawareDominicanDutchDutch West IndianEastern EuropeanEcuadorianEgyptianEnglishEstonianEthiopianEuropeanFijianFilipinoFinnishFrenchFrench American IndianFrench CanadianGermanGerman RussianGhanaianGreekGuamanian/ChamorroGuatemalanGuyaneseHaitianHmongHonduranHopiHoumaHungarianIcelanderIndian (Asian)IndonesianInupiatIraqiIrishIroquoisIsraeliItalianJamaicanJapaneseJordanianKenyanKiowaKoreanLaotianLatvianLebaneseLiberianLithuanianLumbeeLuxembourgerMacedonianMalaysianMalteseMarshalleseMenomineeMexicanMexican American IndianMongolianMoroccanNative HawaiianNavajoNepaleseNew ZealanderNicaraguanNigerianNorthern EuropeanNorwegianOkinawanOsageOttawaPaiutePakistaniPalestinianPanamanianParaguayanPennsylvania GermanPeruvianPimaPolishPortuguesePotawatomiPuebloPuerto RicanPuget Sound SalishRomanianRussianSalvadoranSamoanScandinavianScotch-IrishScottishSeminoleSenegaleseSerbianShoshoneSierra LeoneanSiouxSlavicSlovakSloveneSomaliSouth AfricanSouth AmericanSouth American IndianSoviet UnionSpaniardSpanishSpanish AmericanSpanish American IndianSri LankanSubsaharan AfricanSudaneseSwedishSwissSyrianTaiwaneseThaiTlingit-HaidaTohono O'OdhamTonganTrinidadian and TobagonianTsimshianTurkishU.S. Virgin IslanderUgandanUkrainianUruguayanUteVenezuelanVietnameseWelshWest IndianYakamaYaquiYugoslavianYumanYup'ikZimbabwean
Immigration
NonimmigrantsImmigrantsAfghanistanAfricaAlbaniaArgentinaArmeniaAsiaAustraliaAustriaBahamasBangladeshBarbadosBelarusBelgiumBelizeBoliviaBosnia and HerzegovinaBrazilBulgariaBurma/MyanmarCabo VerdeCambodiaCameroonCanadaCaribbeanCentral AmericaChileChinaColombiaCongoCosta RicaCroatiaCubaCzechoslovakiaDenmarkDominicaDominican RepublicEastern AfricaEastern AsiaEastern EuropeEcuadorEgyptEl SalvadorEnglandEritreaEthiopiaEuropeFijiFranceGermanyGhanaGreeceGrenadaGuatemalaGuyanaHaitiHondurasHong KongHungaryIndiaIndonesiaIranIraqIrelandIsraelItalyJamaicaJapanJordanKazakhstanKenyaKoreaKuwaitLaosLatin AmericaLatviaLebanonLiberiaLithuaniaMalaysiaMexicoMicronesiaMiddle AfricaMoldovaMoroccoNepalNetherlandsNicaraguaNigeriaNorth AmericaNorth MacedoniaNorthern AfricaNorthern EuropeNorwayOceaniaPakistanPanamaPeruPhilippinesPolandPortugalRomaniaRussiaSaudi ArabiaScotlandSenegalSerbiaSierra LeoneSingaporeSomaliaSouth AfricaSouth AmericaSouth Central AsiaSouth Eastern AsiaSouthern EuropeSpainSri LankaSt. Vincent and the GrenadinesSudanSwedenSwitzerlandSyriaTaiwanThailandTrinidad and TobagoTurkeyUgandaUkraineUruguayUzbekistanVenezuelaVietnamWest IndiesWestern AfricaWestern AsiaWestern EuropeYemenZaireZimbabweAzores
Self-Care Disability
Income
Poverty
Unemployment
Labor Participation
Family Structure
Vehicle Availability
Education Level
Disability

Iranian Self-Care Disability
Exceptional

2.3%
SELF-CARE DISABILITY
99.8/ 100
METRIC RATING
40th/ 347
METRIC RANK

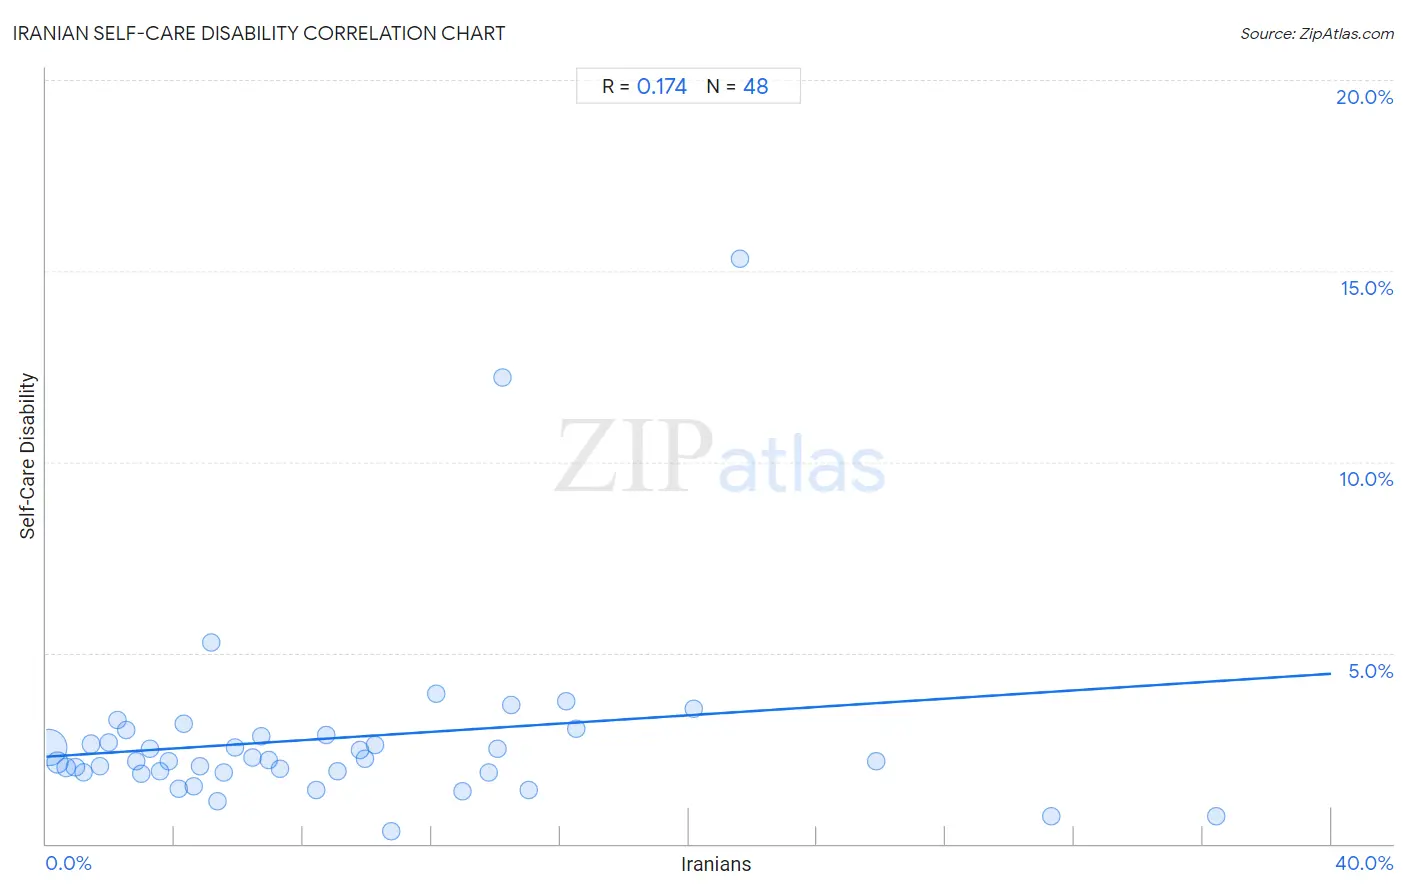
Iranian Self-Care Disability Correlation Chart

The statistical analysis conducted on geographies consisting of 316,529,942 people shows a poor positive correlation between the proportion of Iranians and percentage of population with self-care disability in the United States with a correlation coefficient (R) of 0.174 and weighted average of 2.3%. On average, for every 1% (one percent) increase in Iranians within a typical geography, there is an increase of 0.054% in percentage of population with self-care disability.
Iranian Self-Care Disability
It is essential to understand that the correlation between the percentage of Iranians and percentage of population with self-care disability does not imply a direct cause-and-effect relationship. It remains uncertain whether the presence of Iranians influences an upward or downward trend in the level of percentage of population with self-care disability within an area, or if Iranians simply ended up residing in those areas with higher or lower levels of percentage of population with self-care disability due to other factors.

Demographics Similar to Iranians by Self-Care Disability

In terms of self-care disability, the demographic groups most similar to Iranians are Immigrants from Bulgaria (2.3%, a difference of 0.040%), Immigrants from Sudan (2.3%, a difference of 0.070%), Immigrants from Eastern Africa (2.3%, a difference of 0.15%), Immigrants from Uganda (2.3%, a difference of 0.17%), and Immigrants from Pakistan (2.3%, a difference of 0.21%).
DemographicsRating | RankSelf-Care Disability
Immigrants from Korea
99.9
/100
|
#33
Exceptional
2.3%
Immigrants from Turkey
99.9
/100
|
#34
Exceptional
2.3%
Immigrants from Australia
99.9
/100
|
#35
Exceptional
2.3%
Immigrants from Lithuania
99.9
/100
|
#36
Exceptional
2.3%
Immigrants from Sweden
99.9
/100
|
#37
Exceptional
2.3%
Immigrants from Eastern Africa
99.9
/100
|
#38
Exceptional
2.3%
Immigrants from Bulgaria
99.8
/100
|
#39
Exceptional
2.3%
Iranians
99.8
/100
|
#40
Exceptional
2.3%
Immigrants from Sudan
99.8
/100
|
#41
Exceptional
2.3%
Immigrants from Uganda
99.8
/100
|
#42
Exceptional
2.3%
Immigrants from Pakistan
99.8
/100
|
#43
Exceptional
2.3%
Immigrants from South Africa
99.8
/100
|
#44
Exceptional
2.3%
Norwegians
99.8
/100
|
#45
Exceptional
2.3%
Czechs
99.8
/100
|
#46
Exceptional
2.3%
Jordanians
99.7
/100
|
#47
Exceptional
2.3%

Iranian Self-Care Disability Correlation Summary

MeasurementIranian DataSelf-Care Disability Data
Minimum0.097%0.34%
Maximum36.4%15.3%
Range36.3%15.0%
Mean8.9%2.8%
Median6.6%2.2%
Interquartile 25% (IQ1)3.1%1.9%
Interquartile 75% (IQ3)13.4%2.8%
Interquartile Range (IQR)10.3%0.97%
Standard Deviation (Sample)8.0%2.5%
Standard Deviation (Population)7.9%2.5%

Correlation Details

Iranian PercentileSample SizeSelf-Care Disability
[
0.0%
-
0.5%
]
0.097%
228,705,5932.5%
[
0.0%
-
0.5%
]
0.36%
45,744,8482.1%
[
0.5%
-
1.0%
]
0.63%
16,941,1122.0%
[
0.5%
-
1.0%
]
0.91%
7,318,9322.0%
[
1.0%
-
1.5%
]
1.17%
4,462,2231.9%
[
1.0%
-
1.5%
]
1.39%
6,256,2452.6%
[
1.5%
-
2.0%
]
1.69%
1,876,8892.0%
[
1.5%
-
2.0%
]
1.93%
912,4992.6%
[
2.0%
-
2.5%
]
2.20%
716,1983.2%
[
2.0%
-
2.5%
]
2.47%
554,8533.0%
[
2.5%
-
3.0%
]
2.79%
547,7112.2%
[
2.5%
-
3.0%
]
2.95%
244,6121.8%
[
3.0%
-
3.5%
]
3.22%
272,3072.5%
[
3.5%
-
4.0%
]
3.53%
597,8771.9%
[
3.5%
-
4.0%
]
3.82%
257,3492.2%
[
4.0%
-
4.5%
]
4.13%
73,4511.4%
[
4.0%
-
4.5%
]
4.29%
94,0153.1%
[
4.5%
-
5.0%
]
4.59%
80,2831.5%
[
4.5%
-
5.0%
]
4.77%
175,4492.0%
[
5.0%
-
5.5%
]
5.12%
6,0925.3%
[
5.0%
-
5.5%
]
5.34%
13,1751.1%
[
5.5%
-
6.0%
]
5.54%
23,9871.9%
[
5.5%
-
6.0%
]
5.89%
82,1172.5%
[
6.0%
-
6.5%
]
6.44%
70,1312.2%
[
6.5%
-
7.0%
]
6.68%
69,2782.8%
[
6.5%
-
7.0%
]
6.94%
35,3332.2%
[
7.0%
-
7.5%
]
7.27%
26,3182.0%
[
8.0%
-
8.5%
]
8.41%
52,7411.4%
[
8.5%
-
9.0%
]
8.72%
64,4852.8%
[
9.0%
-
9.5%
]
9.06%
50,3921.9%
[
9.5%
-
10.0%
]
9.77%
37,7052.5%
[
9.5%
-
10.0%
]
9.92%
23,1062.2%
[
10.0%
-
10.5%
]
10.23%
5772.6%
[
10.5%
-
11.0%
]
10.72%
9,1690.34%
[
12.0%
-
12.5%
]
12.13%
5,5893.9%
[
12.5%
-
13.0%
]
12.98%
7,8681.4%
[
13.5%
-
14.0%
]
13.77%
1,4451.9%
[
14.0%
-
14.5%
]
14.05%
10,8812.5%
[
14.0%
-
14.5%
]
14.21%
36612.2%
[
14.0%
-
14.5%
]
14.47%
9,6993.6%
[
15.0%
-
15.5%
]
15.02%
11,0601.4%
[
16.0%
-
16.5%
]
16.20%
16,6523.7%
[
16.5%
-
17.0%
]
16.51%
32,9633.0%
[
20.0%
-
20.5%
]
20.15%
19,1803.5%
[
21.5%
-
22.0%
]
21.60%
1,13915.3%
[
25.5%
-
26.0%
]
25.85%
1,3502.2%
[
31.0%
-
31.5%
]
31.30%
9,1050.73%
[
36.0%
-
36.5%
]
36.42%
5,5930.72%