Immigrants from North Macedonia Self-Care Disability
COMPARE
Immigrants from North Macedonia
Select to Compare
Self-Care Disability
Immigrants from North Macedonia Self-Care Disability
2.4%
SELF-CARE DISABILITY
93.1/ 100
METRIC RATING
114th/ 347
METRIC RANK
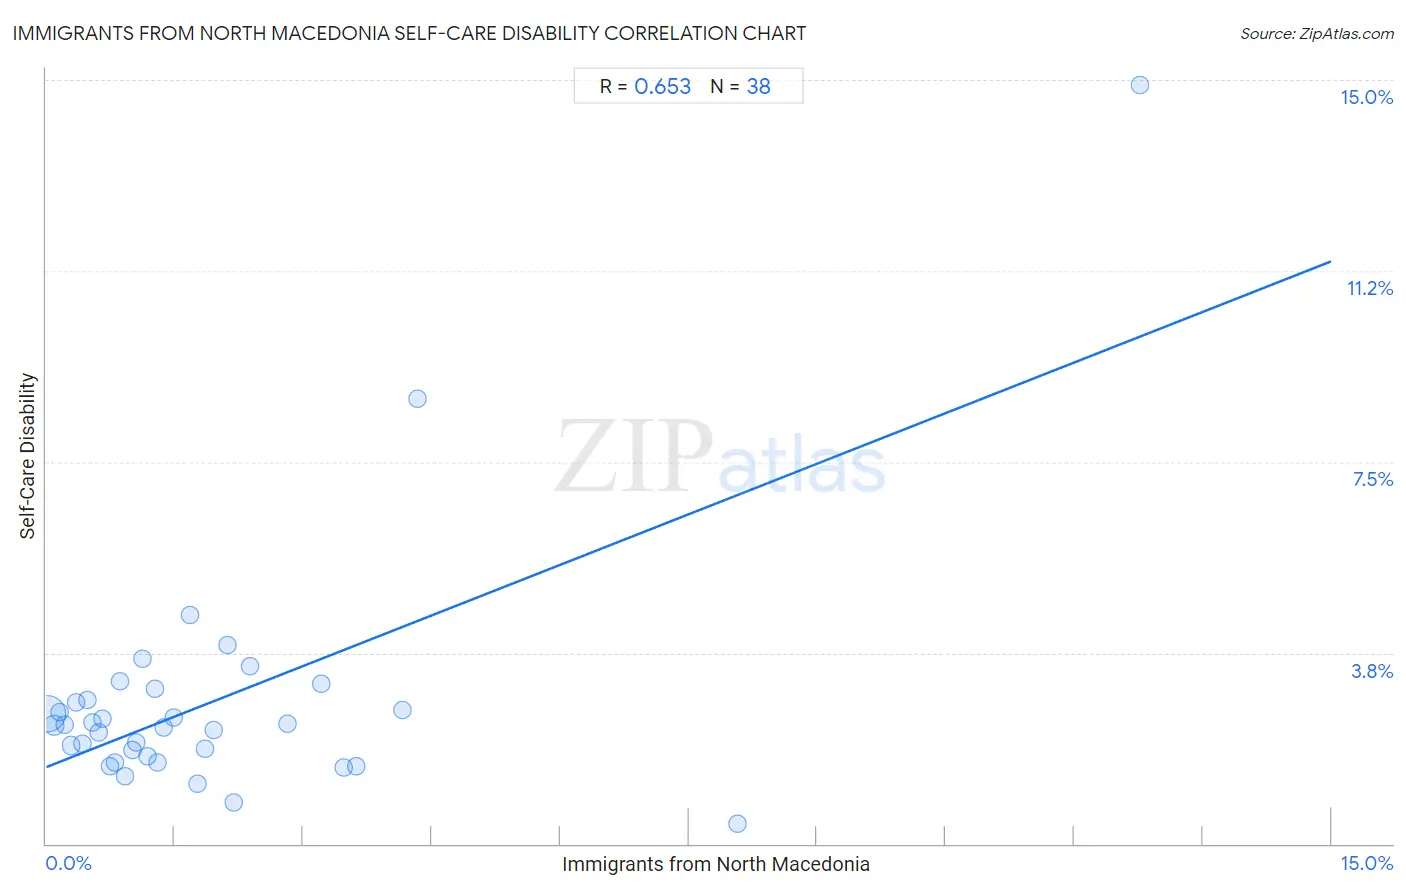
Immigrants from North Macedonia Self-Care Disability Correlation Chart
The statistical analysis conducted on geographies consisting of 74,312,524 people shows a significant positive correlation between the proportion of Immigrants from North Macedonia and percentage of population with self-care disability in the United States with a correlation coefficient (R) of 0.653 and weighted average of 2.4%. On average, for every 1% (one percent) increase in Immigrants from North Macedonia within a typical geography, there is an increase of 0.66% in percentage of population with self-care disability.
It is essential to understand that the correlation between the percentage of Immigrants from North Macedonia and percentage of population with self-care disability does not imply a direct cause-and-effect relationship. It remains uncertain whether the presence of Immigrants from North Macedonia influences an upward or downward trend in the level of percentage of population with self-care disability within an area, or if Immigrants from North Macedonia simply ended up residing in those areas with higher or lower levels of percentage of population with self-care disability due to other factors.
Demographics Similar to Immigrants from North Macedonia by Self-Care Disability
In terms of self-care disability, the demographic groups most similar to Immigrants from North Macedonia are South American (2.4%, a difference of 0.0%), Immigrants from Hong Kong (2.4%, a difference of 0.0%), Northern European (2.4%, a difference of 0.050%), Scandinavian (2.4%, a difference of 0.070%), and Serbian (2.4%, a difference of 0.090%).
| Demographics | Rating | Rank | Self-Care Disability |
| British | 94.3 /100 | #107 | Exceptional 2.4% |
| Greeks | 94.1 /100 | #108 | Exceptional 2.4% |
| Slovenes | 94.1 /100 | #109 | Exceptional 2.4% |
| Immigrants from Africa | 93.7 /100 | #110 | Exceptional 2.4% |
| Serbians | 93.6 /100 | #111 | Exceptional 2.4% |
| Scandinavians | 93.5 /100 | #112 | Exceptional 2.4% |
| South Americans | 93.2 /100 | #113 | Exceptional 2.4% |
| Immigrants from North Macedonia | 93.1 /100 | #114 | Exceptional 2.4% |
| Immigrants from Hong Kong | 93.1 /100 | #115 | Exceptional 2.4% |
| Northern Europeans | 92.9 /100 | #116 | Exceptional 2.4% |
| Taiwanese | 92.5 /100 | #117 | Exceptional 2.4% |
| Immigrants from Canada | 92.0 /100 | #118 | Exceptional 2.4% |
| Immigrants from Sierra Leone | 91.8 /100 | #119 | Exceptional 2.4% |
| Uruguayans | 91.5 /100 | #120 | Exceptional 2.4% |
| Peruvians | 91.3 /100 | #121 | Exceptional 2.4% |
Immigrants from North Macedonia Self-Care Disability Correlation Summary
| Measurement | Immigrants from North Macedonia Data | Self-Care Disability Data |
| Minimum | 0.019% | 0.40% |
| Maximum | 12.8% | 14.9% |
| Range | 12.7% | 14.5% |
| Mean | 1.9% | 2.8% |
| Median | 1.2% | 2.3% |
| Interquartile 25% (IQ1) | 0.61% | 1.7% |
| Interquartile 75% (IQ3) | 2.2% | 2.8% |
| Interquartile Range (IQR) | 1.6% | 1.1% |
| Standard Deviation (Sample) | 2.4% | 2.4% |
| Standard Deviation (Population) | 2.4% | 2.4% |
Correlation Details
| Immigrants from North Macedonia Percentile | Sample Size | Self-Care Disability |
[ 0.0% - 0.5% ] 0.019% | 59,714,262 | 2.6% |
[ 0.0% - 0.5% ] 0.093% | 6,293,283 | 2.3% |
[ 0.0% - 0.5% ] 0.16% | 2,698,993 | 2.6% |
[ 0.0% - 0.5% ] 0.22% | 1,844,254 | 2.3% |
[ 0.0% - 0.5% ] 0.28% | 906,815 | 1.9% |
[ 0.0% - 0.5% ] 0.35% | 644,564 | 2.8% |
[ 0.0% - 0.5% ] 0.42% | 283,412 | 2.0% |
[ 0.0% - 0.5% ] 0.48% | 373,308 | 2.8% |
[ 0.5% - 1.0% ] 0.53% | 256,128 | 2.4% |
[ 0.5% - 1.0% ] 0.61% | 240,335 | 2.2% |
[ 0.5% - 1.0% ] 0.66% | 210,737 | 2.5% |
[ 0.5% - 1.0% ] 0.74% | 96,678 | 1.5% |
[ 0.5% - 1.0% ] 0.80% | 153,210 | 1.6% |
[ 0.5% - 1.0% ] 0.86% | 25,288 | 3.2% |
[ 0.5% - 1.0% ] 0.92% | 12,823 | 1.3% |
[ 1.0% - 1.5% ] 1.01% | 32,851 | 1.8% |
[ 1.0% - 1.5% ] 1.04% | 13,882 | 2.0% |
[ 1.0% - 1.5% ] 1.12% | 52,033 | 3.6% |
[ 1.0% - 1.5% ] 1.18% | 61,648 | 1.7% |
[ 1.0% - 1.5% ] 1.26% | 34,750 | 3.0% |
[ 1.0% - 1.5% ] 1.30% | 20,434 | 1.6% |
[ 1.0% - 1.5% ] 1.37% | 82,208 | 2.3% |
[ 1.0% - 1.5% ] 1.48% | 43,304 | 2.5% |
[ 1.5% - 2.0% ] 1.68% | 3,035 | 4.5% |
[ 1.5% - 2.0% ] 1.76% | 16,751 | 1.2% |
[ 1.5% - 2.0% ] 1.85% | 42,522 | 1.9% |
[ 1.5% - 2.0% ] 1.95% | 26,003 | 2.2% |
[ 2.0% - 2.5% ] 2.12% | 16,842 | 3.9% |
[ 2.0% - 2.5% ] 2.19% | 4,439 | 0.81% |
[ 2.0% - 2.5% ] 2.38% | 3,781 | 3.5% |
[ 2.5% - 3.0% ] 2.82% | 64,944 | 2.4% |
[ 3.0% - 3.5% ] 3.22% | 10,942 | 3.2% |
[ 3.0% - 3.5% ] 3.47% | 2,999 | 1.5% |
[ 3.5% - 4.0% ] 3.61% | 21,806 | 1.5% |
[ 4.0% - 4.5% ] 4.16% | 409 | 2.6% |
[ 4.0% - 4.5% ] 4.33% | 1,409 | 8.7% |
[ 8.0% - 8.5% ] 8.07% | 1,301 | 0.40% |
[ 12.5% - 13.0% ] 12.77% | 141 | 14.9% |