Immigrants from Russia Self-Care Disability
COMPARE
Immigrants from Russia
Select to Compare
Self-Care Disability
Immigrants from Russia Self-Care Disability
2.5%
SELF-CARE DISABILITY
11.0/ 100
METRIC RATING
205th/ 347
METRIC RANK
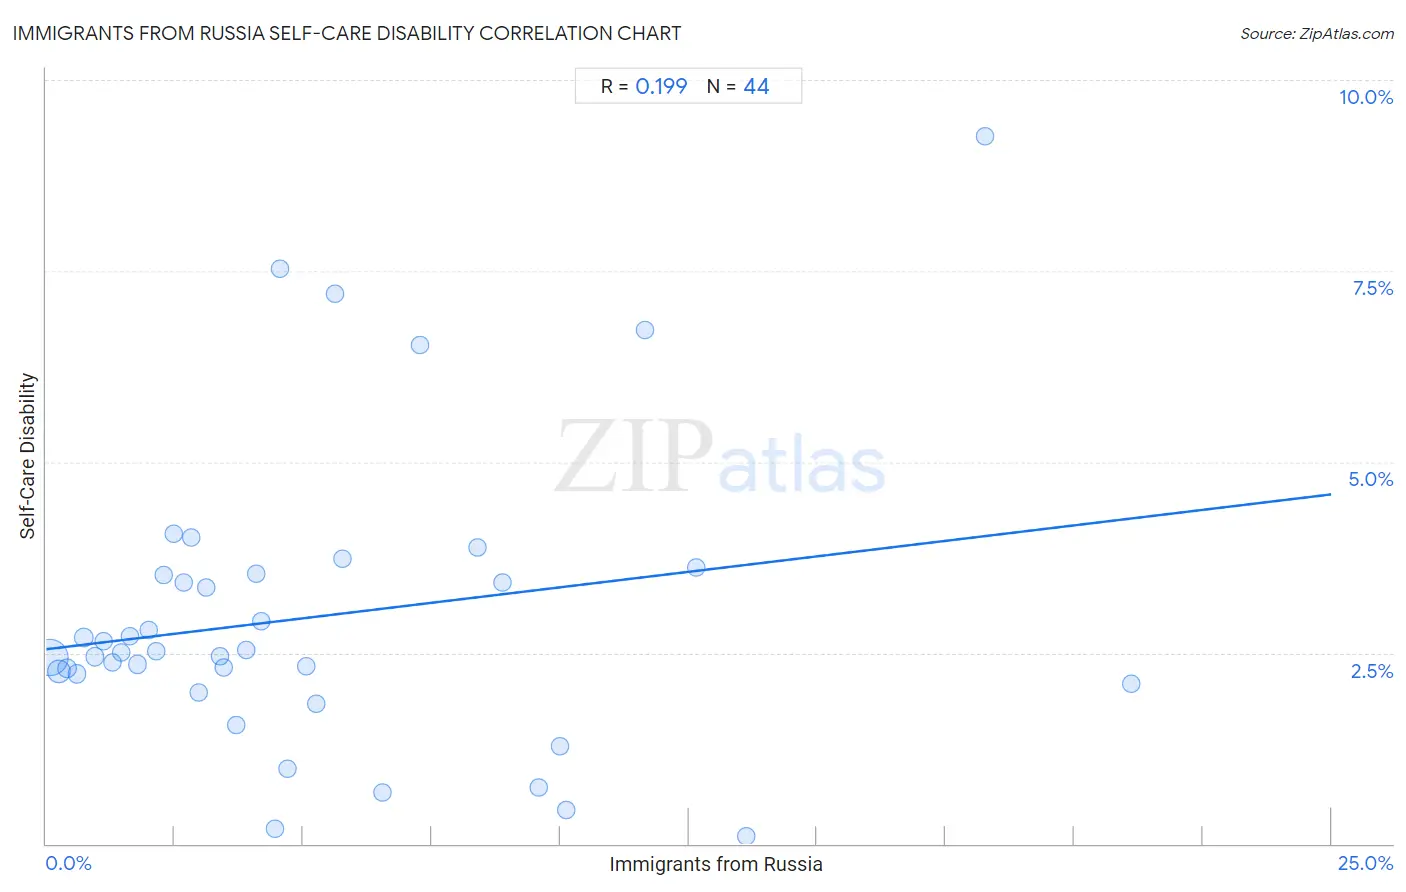
Immigrants from Russia Self-Care Disability Correlation Chart
The statistical analysis conducted on geographies consisting of 347,529,839 people shows a poor positive correlation between the proportion of Immigrants from Russia and percentage of population with self-care disability in the United States with a correlation coefficient (R) of 0.199 and weighted average of 2.5%. On average, for every 1% (one percent) increase in Immigrants from Russia within a typical geography, there is an increase of 0.081% in percentage of population with self-care disability.
It is essential to understand that the correlation between the percentage of Immigrants from Russia and percentage of population with self-care disability does not imply a direct cause-and-effect relationship. It remains uncertain whether the presence of Immigrants from Russia influences an upward or downward trend in the level of percentage of population with self-care disability within an area, or if Immigrants from Russia simply ended up residing in those areas with higher or lower levels of percentage of population with self-care disability due to other factors.
Demographics Similar to Immigrants from Russia by Self-Care Disability
In terms of self-care disability, the demographic groups most similar to Immigrants from Russia are Alaskan Athabascan (2.5%, a difference of 0.080%), Immigrants from Bahamas (2.5%, a difference of 0.10%), French (2.5%, a difference of 0.14%), Immigrants from Lebanon (2.5%, a difference of 0.15%), and Slovak (2.5%, a difference of 0.18%).
| Demographics | Rating | Rank | Self-Care Disability |
| Immigrants | 15.0 /100 | #198 | Poor 2.5% |
| Immigrants from Ghana | 14.7 /100 | #199 | Poor 2.5% |
| Immigrants from Western Africa | 13.3 /100 | #200 | Poor 2.5% |
| Immigrants from South Eastern Asia | 12.9 /100 | #201 | Poor 2.5% |
| Slovaks | 12.6 /100 | #202 | Poor 2.5% |
| Immigrants from Lebanon | 12.4 /100 | #203 | Poor 2.5% |
| Immigrants from Bahamas | 11.9 /100 | #204 | Poor 2.5% |
| Immigrants from Russia | 11.0 /100 | #205 | Poor 2.5% |
| Alaskan Athabascans | 10.4 /100 | #206 | Poor 2.5% |
| French | 9.9 /100 | #207 | Tragic 2.5% |
| Central Americans | 8.7 /100 | #208 | Tragic 2.5% |
| Malaysians | 7.7 /100 | #209 | Tragic 2.5% |
| Panamanians | 6.4 /100 | #210 | Tragic 2.5% |
| Native Hawaiians | 5.1 /100 | #211 | Tragic 2.6% |
| Samoans | 5.1 /100 | #212 | Tragic 2.6% |
Immigrants from Russia Self-Care Disability Correlation Summary
| Measurement | Immigrants from Russia Data | Self-Care Disability Data |
| Minimum | 0.071% | 0.094% |
| Maximum | 21.1% | 9.3% |
| Range | 21.0% | 9.2% |
| Mean | 5.2% | 3.0% |
| Median | 3.8% | 2.5% |
| Interquartile 25% (IQ1) | 1.9% | 2.2% |
| Interquartile 75% (IQ3) | 6.9% | 3.5% |
| Interquartile Range (IQR) | 5.0% | 1.4% |
| Standard Deviation (Sample) | 4.7% | 1.9% |
| Standard Deviation (Population) | 4.7% | 1.9% |
Correlation Details
| Immigrants from Russia Percentile | Sample Size | Self-Care Disability |
[ 0.0% - 0.5% ] 0.071% | 227,421,596 | 2.4% |
[ 0.0% - 0.5% ] 0.24% | 56,800,919 | 2.3% |
[ 0.0% - 0.5% ] 0.40% | 25,611,427 | 2.3% |
[ 0.5% - 1.0% ] 0.60% | 12,681,835 | 2.2% |
[ 0.5% - 1.0% ] 0.73% | 14,332,181 | 2.7% |
[ 0.5% - 1.0% ] 0.94% | 3,294,869 | 2.4% |
[ 1.0% - 1.5% ] 1.12% | 1,861,513 | 2.7% |
[ 1.0% - 1.5% ] 1.28% | 1,515,230 | 2.4% |
[ 1.0% - 1.5% ] 1.45% | 1,153,842 | 2.5% |
[ 1.5% - 2.0% ] 1.62% | 725,458 | 2.7% |
[ 1.5% - 2.0% ] 1.78% | 284,365 | 2.3% |
[ 1.5% - 2.0% ] 1.99% | 231,507 | 2.8% |
[ 2.0% - 2.5% ] 2.13% | 271,781 | 2.5% |
[ 2.0% - 2.5% ] 2.30% | 147,434 | 3.5% |
[ 2.0% - 2.5% ] 2.49% | 118,011 | 4.1% |
[ 2.5% - 3.0% ] 2.66% | 179,329 | 3.4% |
[ 2.5% - 3.0% ] 2.81% | 257,944 | 4.0% |
[ 2.5% - 3.0% ] 2.97% | 132,951 | 2.0% |
[ 3.0% - 3.5% ] 3.12% | 128,125 | 3.4% |
[ 3.0% - 3.5% ] 3.37% | 10,258 | 2.5% |
[ 3.0% - 3.5% ] 3.46% | 52,191 | 2.3% |
[ 3.5% - 4.0% ] 3.69% | 7,448 | 1.5% |
[ 3.5% - 4.0% ] 3.89% | 4,905 | 2.5% |
[ 4.0% - 4.5% ] 4.08% | 21,112 | 3.5% |
[ 4.0% - 4.5% ] 4.19% | 20,071 | 2.9% |
[ 4.0% - 4.5% ] 4.44% | 2,768 | 0.20% |
[ 4.5% - 5.0% ] 4.54% | 1,321 | 7.5% |
[ 4.5% - 5.0% ] 4.68% | 1,751 | 0.98% |
[ 5.0% - 5.5% ] 5.06% | 8,707 | 2.3% |
[ 5.0% - 5.5% ] 5.25% | 23,264 | 1.8% |
[ 5.5% - 6.0% ] 5.61% | 713 | 7.2% |
[ 5.5% - 6.0% ] 5.77% | 81,109 | 3.7% |
[ 6.5% - 7.0% ] 6.53% | 1,990 | 0.67% |
[ 7.0% - 7.5% ] 7.28% | 47,893 | 6.5% |
[ 8.0% - 8.5% ] 8.39% | 155 | 3.9% |
[ 8.5% - 9.0% ] 8.89% | 2,194 | 3.4% |
[ 9.5% - 10.0% ] 9.59% | 1,523 | 0.74% |
[ 10.0% - 10.5% ] 10.00% | 80 | 1.3% |
[ 10.0% - 10.5% ] 10.13% | 3,338 | 0.45% |
[ 11.5% - 12.0% ] 11.66% | 83,069 | 6.7% |
[ 12.5% - 13.0% ] 12.64% | 1,543 | 3.6% |
[ 13.5% - 14.0% ] 13.61% | 1,102 | 0.094% |
[ 18.0% - 18.5% ] 18.25% | 126 | 9.3% |
[ 21.0% - 21.5% ] 21.10% | 891 | 2.1% |