Macedonian Self-Care Disability
COMPARE
Macedonian
Select to Compare
Self-Care Disability
Macedonian Self-Care Disability
2.4%
SELF-CARE DISABILITY
96.9/ 100
METRIC RATING
94th/ 347
METRIC RANK
Macedonian Self-Care Disability Correlation Chart
The statistical analysis conducted on geographies consisting of 132,583,440 people shows a weak negative correlation between the proportion of Macedonians and percentage of population with self-care disability in the United States with a correlation coefficient (R) of -0.286 and weighted average of 2.4%. On average, for every 1% (one percent) increase in Macedonians within a typical geography, there is a decrease of 0.13% in percentage of population with self-care disability.
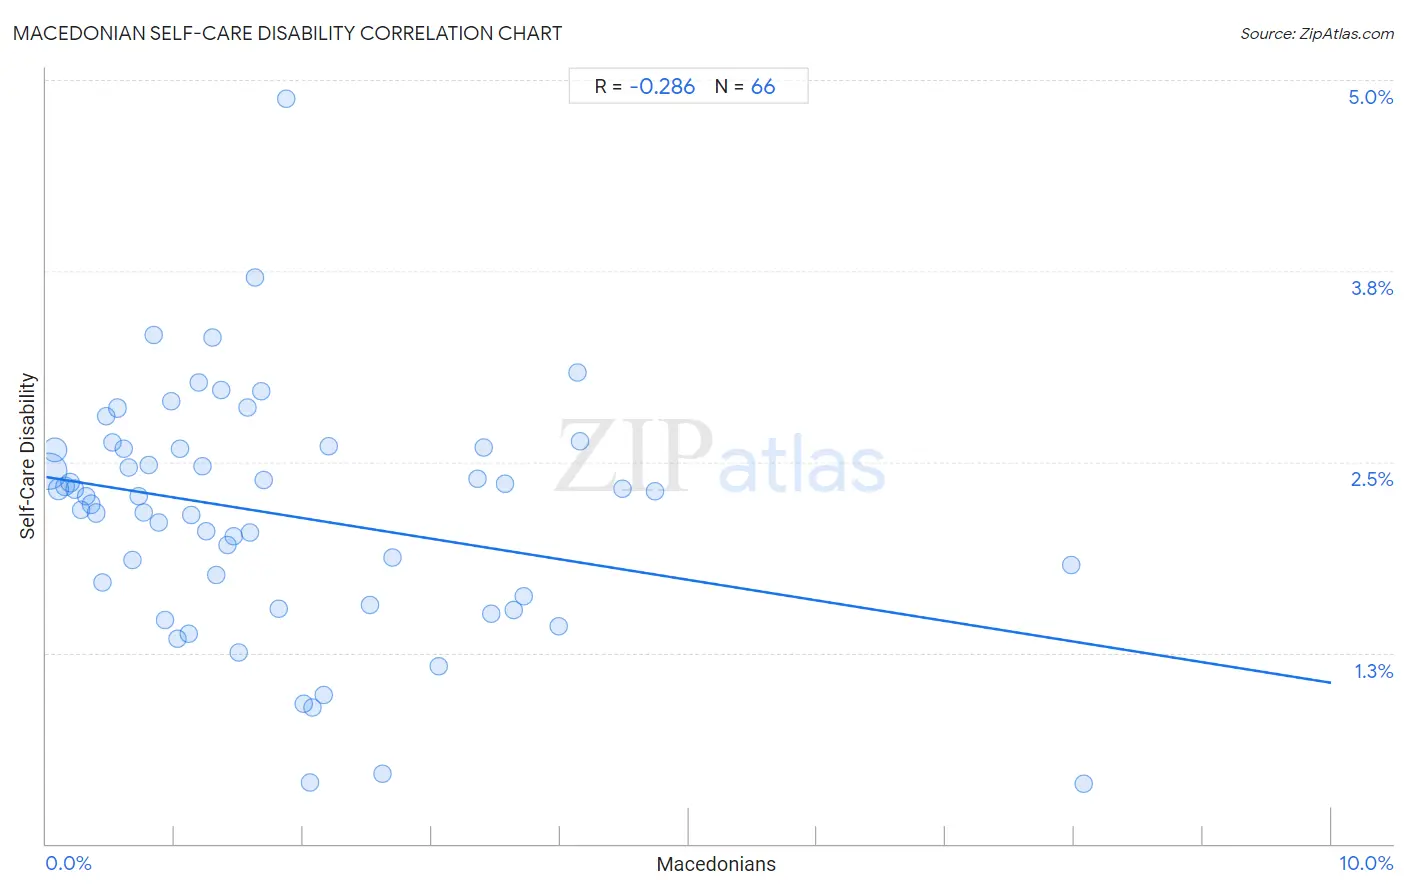
It is essential to understand that the correlation between the percentage of Macedonians and percentage of population with self-care disability does not imply a direct cause-and-effect relationship. It remains uncertain whether the presence of Macedonians influences an upward or downward trend in the level of percentage of population with self-care disability within an area, or if Macedonians simply ended up residing in those areas with higher or lower levels of percentage of population with self-care disability due to other factors.
Demographics Similar to Macedonians by Self-Care Disability
In terms of self-care disability, the demographic groups most similar to Macedonians are Immigrants from Asia (2.4%, a difference of 0.010%), Immigrants from Latvia (2.4%, a difference of 0.040%), Immigrants from Chile (2.4%, a difference of 0.070%), Swiss (2.4%, a difference of 0.11%), and Immigrants from Poland (2.4%, a difference of 0.20%).
| Demographics | Rating | Rank | Self-Care Disability |
| Sierra Leoneans | 98.0 /100 | #87 | Exceptional 2.4% |
| Lithuanians | 98.0 /100 | #88 | Exceptional 2.4% |
| Immigrants from Congo | 98.0 /100 | #89 | Exceptional 2.4% |
| Immigrants from Czechoslovakia | 97.7 /100 | #90 | Exceptional 2.4% |
| Immigrants from Jordan | 97.7 /100 | #91 | Exceptional 2.4% |
| Icelanders | 97.4 /100 | #92 | Exceptional 2.4% |
| Immigrants from Latvia | 97.0 /100 | #93 | Exceptional 2.4% |
| Macedonians | 96.9 /100 | #94 | Exceptional 2.4% |
| Immigrants from Asia | 96.9 /100 | #95 | Exceptional 2.4% |
| Immigrants from Chile | 96.7 /100 | #96 | Exceptional 2.4% |
| Swiss | 96.6 /100 | #97 | Exceptional 2.4% |
| Immigrants from Poland | 96.4 /100 | #98 | Exceptional 2.4% |
| Immigrants from Israel | 96.1 /100 | #99 | Exceptional 2.4% |
| Europeans | 95.8 /100 | #100 | Exceptional 2.4% |
| Immigrants from Scotland | 95.7 /100 | #101 | Exceptional 2.4% |
Macedonian Self-Care Disability Correlation Summary
| Measurement | Macedonian Data | Self-Care Disability Data |
| Minimum | 0.016% | 0.40% |
| Maximum | 8.1% | 4.9% |
| Range | 8.1% | 4.5% |
| Mean | 1.8% | 2.2% |
| Median | 1.3% | 2.3% |
| Interquartile 25% (IQ1) | 0.67% | 1.6% |
| Interquartile 75% (IQ3) | 2.5% | 2.6% |
| Interquartile Range (IQR) | 1.9% | 0.97% |
| Standard Deviation (Sample) | 1.7% | 0.78% |
| Standard Deviation (Population) | 1.6% | 0.78% |
Correlation Details
| Macedonian Percentile | Sample Size | Self-Care Disability |
[ 0.0% - 0.5% ] 0.016% | 75,267,436 | 2.4% |
[ 0.0% - 0.5% ] 0.065% | 26,215,094 | 2.6% |
[ 0.0% - 0.5% ] 0.098% | 11,876,509 | 2.3% |
[ 0.0% - 0.5% ] 0.14% | 4,486,284 | 2.3% |
[ 0.0% - 0.5% ] 0.18% | 4,063,121 | 2.4% |
[ 0.0% - 0.5% ] 0.22% | 2,075,410 | 2.3% |
[ 0.0% - 0.5% ] 0.27% | 1,372,668 | 2.2% |
[ 0.0% - 0.5% ] 0.31% | 735,327 | 2.3% |
[ 0.0% - 0.5% ] 0.35% | 996,988 | 2.2% |
[ 0.0% - 0.5% ] 0.39% | 960,676 | 2.2% |
[ 0.0% - 0.5% ] 0.43% | 364,376 | 1.7% |
[ 0.0% - 0.5% ] 0.47% | 389,295 | 2.8% |
[ 0.5% - 1.0% ] 0.51% | 438,912 | 2.6% |
[ 0.5% - 1.0% ] 0.56% | 315,771 | 2.9% |
[ 0.5% - 1.0% ] 0.60% | 324,329 | 2.6% |
[ 0.5% - 1.0% ] 0.64% | 181,308 | 2.5% |
[ 0.5% - 1.0% ] 0.67% | 224,835 | 1.9% |
[ 0.5% - 1.0% ] 0.72% | 235,931 | 2.3% |
[ 0.5% - 1.0% ] 0.76% | 255,661 | 2.2% |
[ 0.5% - 1.0% ] 0.79% | 168,940 | 2.5% |
[ 0.5% - 1.0% ] 0.84% | 255,027 | 3.3% |
[ 0.5% - 1.0% ] 0.88% | 103,785 | 2.1% |
[ 0.5% - 1.0% ] 0.93% | 60,671 | 1.5% |
[ 0.5% - 1.0% ] 0.97% | 42,014 | 2.9% |
[ 1.0% - 1.5% ] 1.02% | 25,017 | 1.3% |
[ 1.0% - 1.5% ] 1.04% | 143,414 | 2.6% |
[ 1.0% - 1.5% ] 1.11% | 34,403 | 1.4% |
[ 1.0% - 1.5% ] 1.12% | 47,066 | 2.2% |
[ 1.0% - 1.5% ] 1.19% | 72,719 | 3.0% |
[ 1.0% - 1.5% ] 1.22% | 123,838 | 2.5% |
[ 1.0% - 1.5% ] 1.24% | 81,951 | 2.0% |
[ 1.0% - 1.5% ] 1.29% | 41,610 | 3.3% |
[ 1.0% - 1.5% ] 1.32% | 4,151 | 1.8% |
[ 1.0% - 1.5% ] 1.37% | 62,047 | 3.0% |
[ 1.0% - 1.5% ] 1.42% | 13,778 | 2.0% |
[ 1.0% - 1.5% ] 1.46% | 54,704 | 2.0% |
[ 1.0% - 1.5% ] 1.50% | 14,072 | 1.3% |
[ 1.5% - 2.0% ] 1.56% | 11,197 | 2.9% |
[ 1.5% - 2.0% ] 1.59% | 119,716 | 2.0% |
[ 1.5% - 2.0% ] 1.63% | 24,333 | 3.7% |
[ 1.5% - 2.0% ] 1.67% | 1,017 | 3.0% |
[ 1.5% - 2.0% ] 1.69% | 7,219 | 2.4% |
[ 1.5% - 2.0% ] 1.81% | 39,823 | 1.5% |
[ 1.5% - 2.0% ] 1.87% | 7,763 | 4.9% |
[ 2.0% - 2.5% ] 2.00% | 950 | 0.92% |
[ 2.0% - 2.5% ] 2.05% | 536 | 0.40% |
[ 2.0% - 2.5% ] 2.07% | 19,956 | 0.89% |
[ 2.0% - 2.5% ] 2.16% | 2,958 | 0.98% |
[ 2.0% - 2.5% ] 2.20% | 4,137 | 2.6% |
[ 2.5% - 3.0% ] 2.52% | 32,193 | 1.6% |
[ 2.5% - 3.0% ] 2.62% | 458 | 0.46% |
[ 2.5% - 3.0% ] 2.69% | 42,522 | 1.9% |
[ 3.0% - 3.5% ] 3.06% | 7,329 | 1.2% |
[ 3.0% - 3.5% ] 3.36% | 5,118 | 2.4% |
[ 3.0% - 3.5% ] 3.41% | 323 | 2.6% |
[ 3.0% - 3.5% ] 3.47% | 2,999 | 1.5% |
[ 3.5% - 4.0% ] 3.57% | 64,944 | 2.4% |
[ 3.5% - 4.0% ] 3.64% | 21,806 | 1.5% |
[ 3.5% - 4.0% ] 3.72% | 6,322 | 1.6% |
[ 3.5% - 4.0% ] 3.99% | 4,993 | 1.4% |
[ 4.0% - 4.5% ] 4.14% | 266 | 3.1% |
[ 4.0% - 4.5% ] 4.16% | 409 | 2.6% |
[ 4.0% - 4.5% ] 4.49% | 2,363 | 2.3% |
[ 4.5% - 5.0% ] 4.74% | 20,310 | 2.3% |
[ 7.5% - 8.0% ] 7.97% | 1,041 | 1.8% |
[ 8.0% - 8.5% ] 8.07% | 1,301 | 0.40% |