Paiute Self-Care Disability
COMPARE
Paiute
Select to Compare
Self-Care Disability
Paiute Self-Care Disability
2.9%
SELF-CARE DISABILITY
0.0/ 100
METRIC RATING
326th/ 347
METRIC RANK
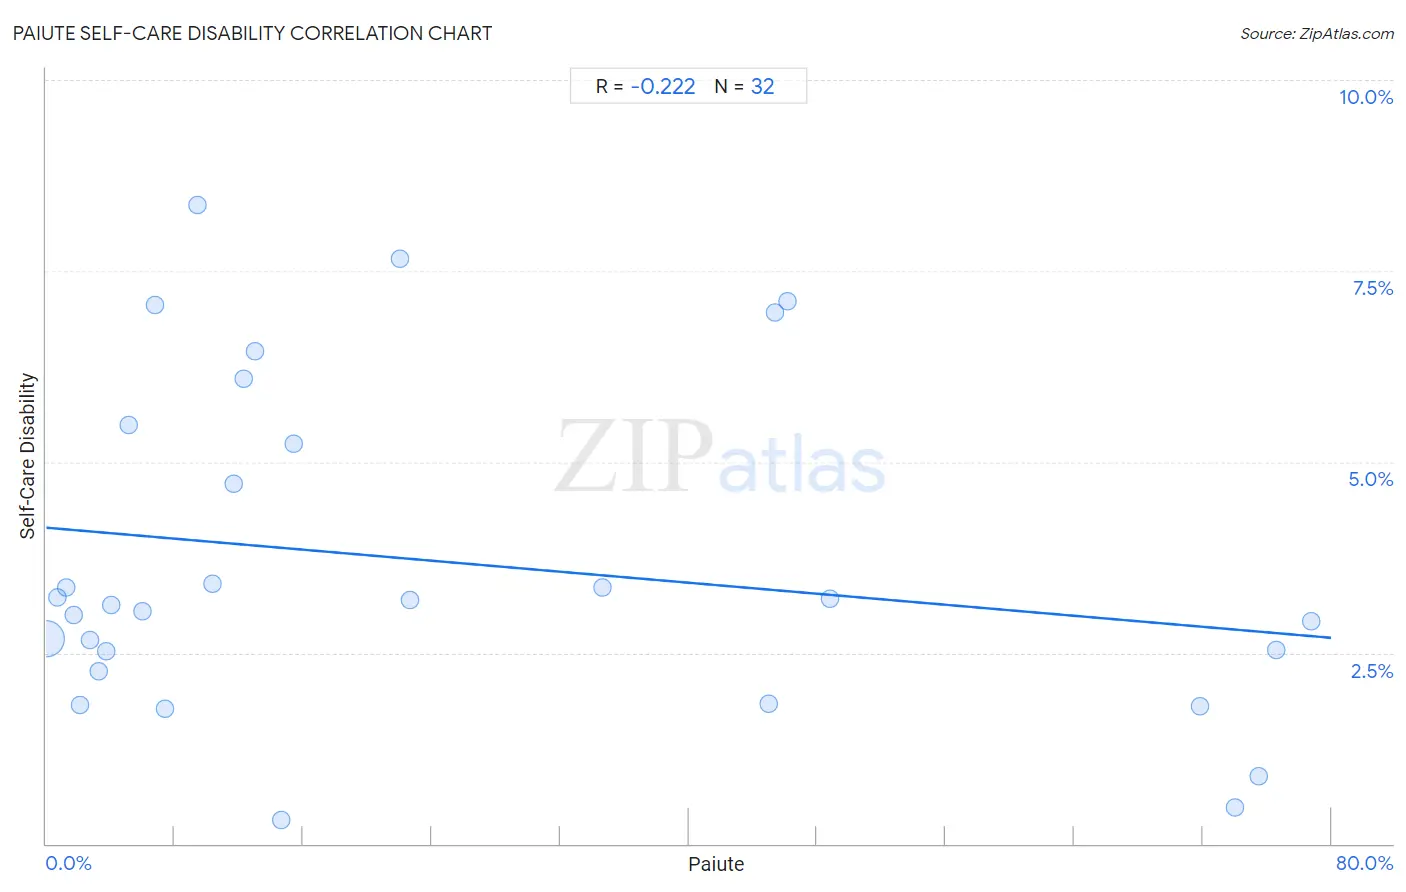
Paiute Self-Care Disability Correlation Chart
The statistical analysis conducted on geographies consisting of 58,381,143 people shows a weak negative correlation between the proportion of Paiute and percentage of population with self-care disability in the United States with a correlation coefficient (R) of -0.222 and weighted average of 2.9%. On average, for every 1% (one percent) increase in Paiute within a typical geography, there is a decrease of 0.018% in percentage of population with self-care disability.
It is essential to understand that the correlation between the percentage of Paiute and percentage of population with self-care disability does not imply a direct cause-and-effect relationship. It remains uncertain whether the presence of Paiute influences an upward or downward trend in the level of percentage of population with self-care disability within an area, or if Paiute simply ended up residing in those areas with higher or lower levels of percentage of population with self-care disability due to other factors.
Demographics Similar to Paiute by Self-Care Disability
In terms of self-care disability, the demographic groups most similar to Paiute are Black/African American (2.9%, a difference of 0.070%), Hopi (2.9%, a difference of 0.45%), Cajun (2.9%, a difference of 0.67%), Immigrants from Uzbekistan (2.9%, a difference of 0.94%), and Nepalese (3.0%, a difference of 1.4%).
| Demographics | Rating | Rank | Self-Care Disability |
| Spanish American Indians | 0.0 /100 | #319 | Tragic 2.9% |
| Chickasaw | 0.0 /100 | #320 | Tragic 2.9% |
| Navajo | 0.0 /100 | #321 | Tragic 2.9% |
| Comanche | 0.0 /100 | #322 | Tragic 2.9% |
| Seminole | 0.0 /100 | #323 | Tragic 2.9% |
| Cherokee | 0.0 /100 | #324 | Tragic 2.9% |
| Immigrants from Uzbekistan | 0.0 /100 | #325 | Tragic 2.9% |
| Paiute | 0.0 /100 | #326 | Tragic 2.9% |
| Blacks/African Americans | 0.0 /100 | #327 | Tragic 2.9% |
| Hopi | 0.0 /100 | #328 | Tragic 2.9% |
| Cajuns | 0.0 /100 | #329 | Tragic 2.9% |
| Nepalese | 0.0 /100 | #330 | Tragic 3.0% |
| Lumbee | 0.0 /100 | #331 | Tragic 3.0% |
| Kiowa | 0.0 /100 | #332 | Tragic 3.0% |
| Dutch West Indians | 0.0 /100 | #333 | Tragic 3.0% |
Paiute Self-Care Disability Correlation Summary
| Measurement | Paiute Data | Self-Care Disability Data |
| Minimum | 0.030% | 0.31% |
| Maximum | 78.7% | 8.4% |
| Range | 78.7% | 8.1% |
| Mean | 24.2% | 3.7% |
| Median | 12.0% | 3.2% |
| Interquartile 25% (IQ1) | 3.9% | 2.4% |
| Interquartile 75% (IQ3) | 45.2% | 5.4% |
| Interquartile Range (IQR) | 41.3% | 3.0% |
| Standard Deviation (Sample) | 26.5% | 2.2% |
| Standard Deviation (Population) | 26.1% | 2.1% |
Correlation Details
| Paiute Percentile | Sample Size | Self-Care Disability |
[ 0.0% - 0.5% ] 0.030% | 57,640,444 | 2.7% |
[ 0.5% - 1.0% ] 0.68% | 495,055 | 3.2% |
[ 1.0% - 1.5% ] 1.21% | 144,382 | 3.4% |
[ 1.5% - 2.0% ] 1.75% | 29,125 | 3.0% |
[ 2.0% - 2.5% ] 2.12% | 8,780 | 1.8% |
[ 2.5% - 3.0% ] 2.74% | 9,328 | 2.7% |
[ 3.0% - 3.5% ] 3.28% | 579 | 2.3% |
[ 3.5% - 4.0% ] 3.76% | 1,916 | 2.5% |
[ 4.0% - 4.5% ] 4.04% | 15,901 | 3.1% |
[ 5.0% - 5.5% ] 5.11% | 5,992 | 5.5% |
[ 6.0% - 6.5% ] 6.02% | 3,108 | 3.0% |
[ 6.5% - 7.0% ] 6.80% | 8,472 | 7.1% |
[ 7.0% - 7.5% ] 7.39% | 1,705 | 1.8% |
[ 9.0% - 9.5% ] 9.38% | 1,886 | 8.4% |
[ 10.0% - 10.5% ] 10.35% | 3,034 | 3.4% |
[ 11.5% - 12.0% ] 11.70% | 778 | 4.7% |
[ 12.0% - 12.5% ] 12.31% | 1,649 | 6.1% |
[ 12.5% - 13.0% ] 12.99% | 1,563 | 6.4% |
[ 14.5% - 15.0% ] 14.63% | 1,032 | 0.31% |
[ 15.0% - 15.5% ] 15.43% | 363 | 5.2% |
[ 22.0% - 22.5% ] 22.05% | 254 | 7.7% |
[ 22.5% - 23.0% ] 22.68% | 313 | 3.2% |
[ 34.5% - 35.0% ] 34.61% | 393 | 3.4% |
[ 44.5% - 45.0% ] 44.98% | 887 | 1.8% |
[ 45.0% - 45.5% ] 45.35% | 172 | 7.0% |
[ 46.0% - 46.5% ] 46.15% | 169 | 7.1% |
[ 48.5% - 49.0% ] 48.76% | 1,007 | 3.2% |
[ 71.5% - 72.0% ] 71.85% | 135 | 1.8% |
[ 73.5% - 74.0% ] 74.00% | 896 | 0.48% |
[ 75.0% - 75.5% ] 75.46% | 1,084 | 0.89% |
[ 76.5% - 77.0% ] 76.59% | 393 | 2.5% |
[ 78.5% - 79.0% ] 78.74% | 348 | 2.9% |