Immigrants from Venezuela Self-Care Disability
COMPARE
Immigrants from Venezuela
Select to Compare
Self-Care Disability
Immigrants from Venezuela Self-Care Disability
2.2%
SELF-CARE DISABILITY
100.0/ 100
METRIC RATING
22nd/ 347
METRIC RANK
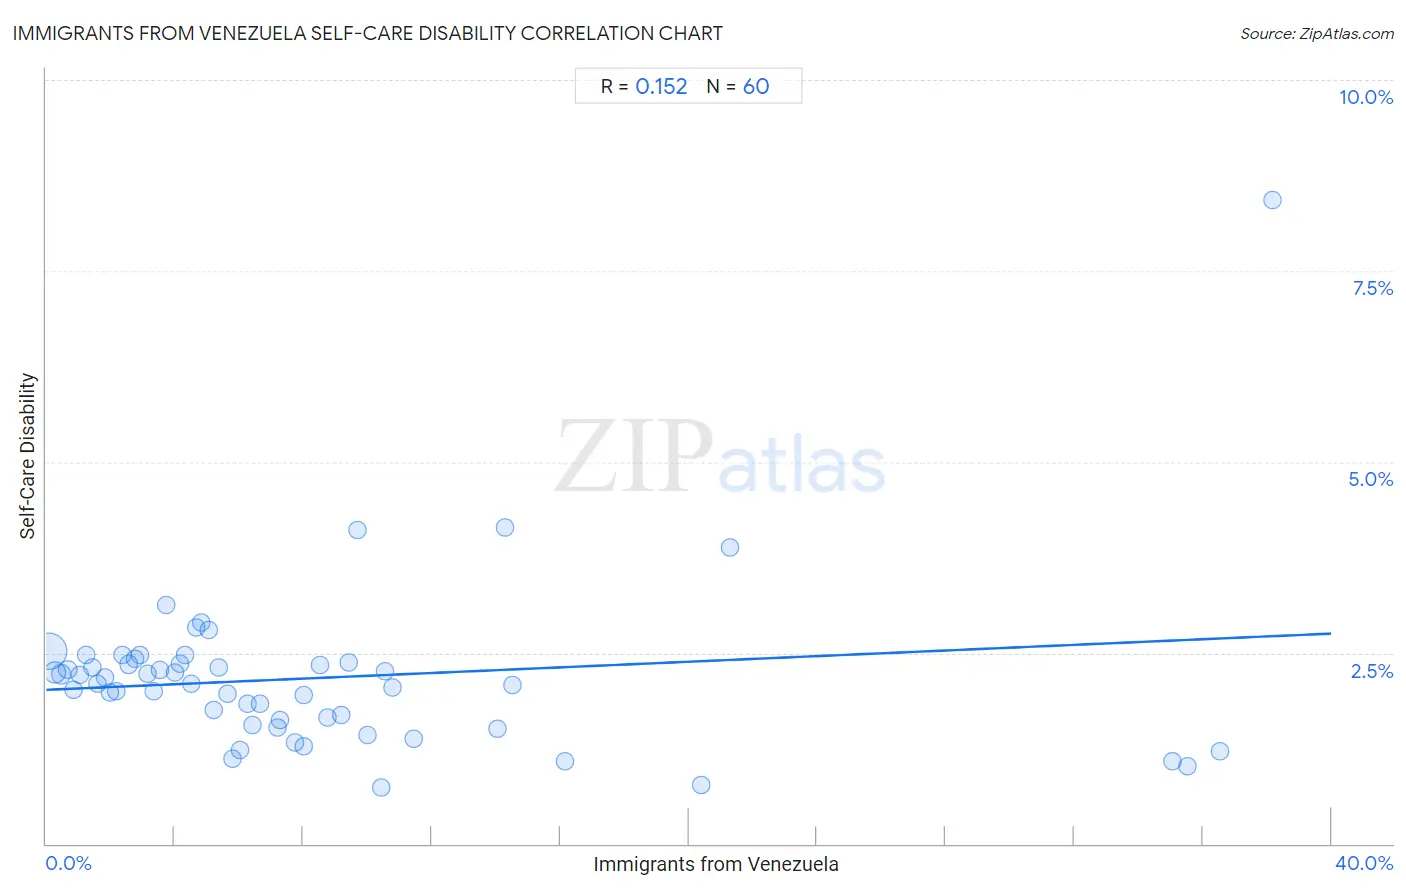
Immigrants from Venezuela Self-Care Disability Correlation Chart
The statistical analysis conducted on geographies consisting of 287,724,504 people shows a poor positive correlation between the proportion of Immigrants from Venezuela and percentage of population with self-care disability in the United States with a correlation coefficient (R) of 0.152 and weighted average of 2.2%. On average, for every 1% (one percent) increase in Immigrants from Venezuela within a typical geography, there is an increase of 0.018% in percentage of population with self-care disability.
It is essential to understand that the correlation between the percentage of Immigrants from Venezuela and percentage of population with self-care disability does not imply a direct cause-and-effect relationship. It remains uncertain whether the presence of Immigrants from Venezuela influences an upward or downward trend in the level of percentage of population with self-care disability within an area, or if Immigrants from Venezuela simply ended up residing in those areas with higher or lower levels of percentage of population with self-care disability due to other factors.
Demographics Similar to Immigrants from Venezuela by Self-Care Disability
In terms of self-care disability, the demographic groups most similar to Immigrants from Venezuela are Bulgarian (2.2%, a difference of 0.040%), Cambodian (2.2%, a difference of 0.21%), Tongan (2.2%, a difference of 0.29%), Immigrants from Eritrea (2.2%, a difference of 0.36%), and Cypriot (2.2%, a difference of 0.52%).
| Demographics | Rating | Rank | Self-Care Disability |
| Okinawans | 100.0 /100 | #15 | Exceptional 2.2% |
| Immigrants from Kuwait | 100.0 /100 | #16 | Exceptional 2.2% |
| Immigrants from Saudi Arabia | 100.0 /100 | #17 | Exceptional 2.2% |
| Immigrants from Taiwan | 100.0 /100 | #18 | Exceptional 2.2% |
| Immigrants from Eritrea | 100.0 /100 | #19 | Exceptional 2.2% |
| Tongans | 100.0 /100 | #20 | Exceptional 2.2% |
| Bulgarians | 100.0 /100 | #21 | Exceptional 2.2% |
| Immigrants from Venezuela | 100.0 /100 | #22 | Exceptional 2.2% |
| Cambodians | 100.0 /100 | #23 | Exceptional 2.2% |
| Cypriots | 100.0 /100 | #24 | Exceptional 2.2% |
| Turks | 100.0 /100 | #25 | Exceptional 2.2% |
| Immigrants from Sri Lanka | 99.9 /100 | #26 | Exceptional 2.2% |
| Venezuelans | 99.9 /100 | #27 | Exceptional 2.2% |
| Inupiat | 99.9 /100 | #28 | Exceptional 2.2% |
| Immigrants from Zimbabwe | 99.9 /100 | #29 | Exceptional 2.3% |
Immigrants from Venezuela Self-Care Disability Correlation Summary
| Measurement | Immigrants from Venezuela Data | Self-Care Disability Data |
| Minimum | 0.077% | 0.74% |
| Maximum | 38.2% | 8.4% |
| Range | 38.1% | 7.7% |
| Mean | 8.3% | 2.2% |
| Median | 5.7% | 2.1% |
| Interquartile 25% (IQ1) | 2.9% | 1.6% |
| Interquartile 75% (IQ3) | 9.9% | 2.4% |
| Interquartile Range (IQR) | 7.0% | 0.78% |
| Standard Deviation (Sample) | 8.9% | 1.1% |
| Standard Deviation (Population) | 8.8% | 1.1% |
Correlation Details
| Immigrants from Venezuela Percentile | Sample Size | Self-Care Disability |
[ 0.0% - 0.5% ] 0.077% | 198,513,013 | 2.5% |
[ 0.0% - 0.5% ] 0.27% | 40,756,635 | 2.2% |
[ 0.0% - 0.5% ] 0.46% | 16,493,245 | 2.2% |
[ 0.5% - 1.0% ] 0.67% | 9,327,334 | 2.3% |
[ 0.5% - 1.0% ] 0.85% | 4,949,874 | 2.0% |
[ 1.0% - 1.5% ] 1.03% | 2,695,417 | 2.2% |
[ 1.0% - 1.5% ] 1.24% | 2,632,393 | 2.5% |
[ 1.0% - 1.5% ] 1.43% | 1,751,462 | 2.3% |
[ 1.5% - 2.0% ] 1.61% | 1,066,257 | 2.1% |
[ 1.5% - 2.0% ] 1.84% | 693,224 | 2.2% |
[ 1.5% - 2.0% ] 2.00% | 1,553,954 | 2.0% |
[ 2.0% - 2.5% ] 2.18% | 302,819 | 2.0% |
[ 2.0% - 2.5% ] 2.36% | 748,420 | 2.5% |
[ 2.5% - 3.0% ] 2.56% | 528,750 | 2.3% |
[ 2.5% - 3.0% ] 2.77% | 320,338 | 2.4% |
[ 2.5% - 3.0% ] 2.94% | 250,067 | 2.5% |
[ 3.0% - 3.5% ] 3.14% | 366,617 | 2.2% |
[ 3.0% - 3.5% ] 3.33% | 430,339 | 2.0% |
[ 3.5% - 4.0% ] 3.55% | 655,448 | 2.3% |
[ 3.5% - 4.0% ] 3.72% | 594,852 | 3.1% |
[ 3.5% - 4.0% ] 3.99% | 94,079 | 2.2% |
[ 4.0% - 4.5% ] 4.15% | 434,328 | 2.4% |
[ 4.0% - 4.5% ] 4.30% | 352,083 | 2.5% |
[ 4.5% - 5.0% ] 4.52% | 196,179 | 2.1% |
[ 4.5% - 5.0% ] 4.68% | 133,624 | 2.8% |
[ 4.5% - 5.0% ] 4.82% | 240,211 | 2.9% |
[ 5.0% - 5.5% ] 5.05% | 119,732 | 2.8% |
[ 5.0% - 5.5% ] 5.22% | 50,037 | 1.8% |
[ 5.0% - 5.5% ] 5.36% | 95,081 | 2.3% |
[ 5.5% - 6.0% ] 5.65% | 146,976 | 2.0% |
[ 5.5% - 6.0% ] 5.81% | 15,184 | 1.1% |
[ 6.0% - 6.5% ] 6.02% | 240,424 | 1.2% |
[ 6.0% - 6.5% ] 6.26% | 22,202 | 1.8% |
[ 6.0% - 6.5% ] 6.41% | 79,823 | 1.6% |
[ 6.5% - 7.0% ] 6.65% | 27,228 | 1.8% |
[ 7.0% - 7.5% ] 7.19% | 56,589 | 1.5% |
[ 7.0% - 7.5% ] 7.27% | 25,283 | 1.6% |
[ 7.5% - 8.0% ] 7.72% | 22,475 | 1.3% |
[ 8.0% - 8.5% ] 8.00% | 19,895 | 1.3% |
[ 8.0% - 8.5% ] 8.02% | 212 | 2.0% |
[ 8.5% - 9.0% ] 8.53% | 49,068 | 2.3% |
[ 8.5% - 9.0% ] 8.74% | 49,888 | 1.7% |
[ 9.0% - 9.5% ] 9.16% | 14,557 | 1.7% |
[ 9.0% - 9.5% ] 9.43% | 2,419 | 2.4% |
[ 9.5% - 10.0% ] 9.70% | 78,478 | 4.1% |
[ 10.0% - 10.5% ] 10.01% | 23,734 | 1.4% |
[ 10.0% - 10.5% ] 10.44% | 22,540 | 0.74% |
[ 10.5% - 11.0% ] 10.53% | 66,299 | 2.3% |
[ 10.5% - 11.0% ] 10.78% | 57,066 | 2.0% |
[ 11.0% - 11.5% ] 11.46% | 20,034 | 1.4% |
[ 14.0% - 14.5% ] 14.06% | 68,029 | 1.5% |
[ 14.0% - 14.5% ] 14.26% | 54,464 | 4.1% |
[ 14.5% - 15.0% ] 14.53% | 57,878 | 2.1% |
[ 16.0% - 16.5% ] 16.13% | 11,809 | 1.1% |
[ 20.0% - 20.5% ] 20.40% | 5,843 | 0.77% |
[ 21.0% - 21.5% ] 21.29% | 155 | 3.9% |
[ 35.0% - 35.5% ] 35.06% | 64,751 | 1.1% |
[ 35.5% - 36.0% ] 35.53% | 74,891 | 1.0% |
[ 36.5% - 37.0% ] 36.55% | 249 | 1.2% |
[ 38.0% - 38.5% ] 38.15% | 249 | 8.4% |