Immigrants from Northern Africa Self-Care Disability
COMPARE
Immigrants from Northern Africa
Select to Compare
Self-Care Disability
Immigrants from Northern Africa Self-Care Disability
2.3%
SELF-CARE DISABILITY
98.2/ 100
METRIC RATING
86th/ 347
METRIC RANK
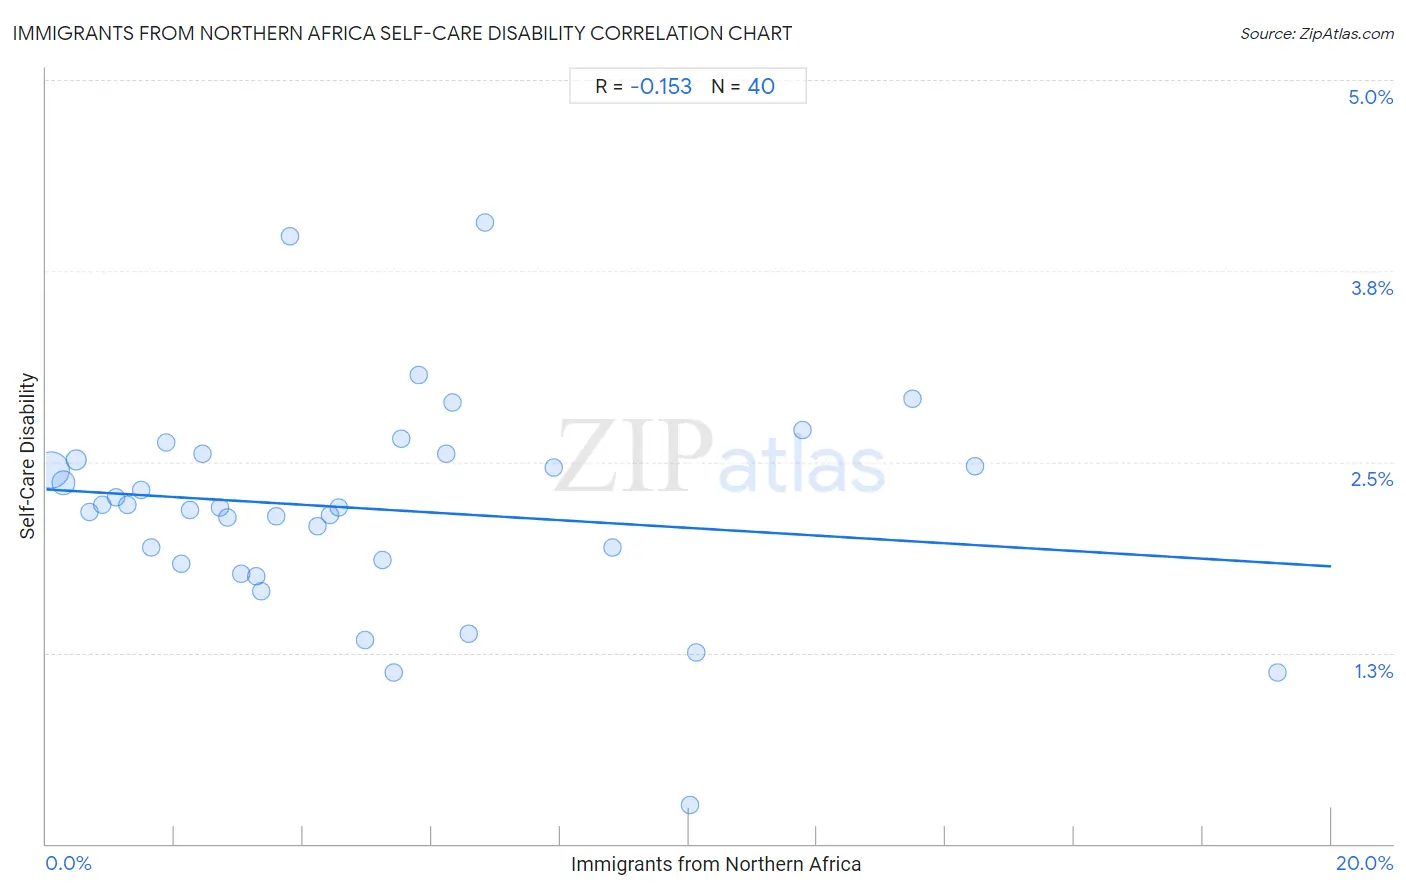
Immigrants from Northern Africa Self-Care Disability Correlation Chart
The statistical analysis conducted on geographies consisting of 320,985,414 people shows a poor negative correlation between the proportion of Immigrants from Northern Africa and percentage of population with self-care disability in the United States with a correlation coefficient (R) of -0.153 and weighted average of 2.3%. On average, for every 1% (one percent) increase in Immigrants from Northern Africa within a typical geography, there is a decrease of 0.025% in percentage of population with self-care disability.
It is essential to understand that the correlation between the percentage of Immigrants from Northern Africa and percentage of population with self-care disability does not imply a direct cause-and-effect relationship. It remains uncertain whether the presence of Immigrants from Northern Africa influences an upward or downward trend in the level of percentage of population with self-care disability within an area, or if Immigrants from Northern Africa simply ended up residing in those areas with higher or lower levels of percentage of population with self-care disability due to other factors.
Demographics Similar to Immigrants from Northern Africa by Self-Care Disability
In terms of self-care disability, the demographic groups most similar to Immigrants from Northern Africa are Estonian (2.3%, a difference of 0.020%), Sierra Leonean (2.4%, a difference of 0.14%), Lithuanian (2.4%, a difference of 0.14%), Immigrants from Congo (2.4%, a difference of 0.19%), and Immigrants from Czechoslovakia (2.4%, a difference of 0.33%).
| Demographics | Rating | Rank | Self-Care Disability |
| Immigrants from Kenya | 99.0 /100 | #79 | Exceptional 2.3% |
| Chileans | 98.8 /100 | #80 | Exceptional 2.3% |
| Ugandans | 98.8 /100 | #81 | Exceptional 2.3% |
| Immigrants from Denmark | 98.8 /100 | #82 | Exceptional 2.3% |
| Indians (Asian) | 98.7 /100 | #83 | Exceptional 2.3% |
| Immigrants from Spain | 98.7 /100 | #84 | Exceptional 2.3% |
| Estonians | 98.3 /100 | #85 | Exceptional 2.3% |
| Immigrants from Northern Africa | 98.2 /100 | #86 | Exceptional 2.3% |
| Sierra Leoneans | 98.0 /100 | #87 | Exceptional 2.4% |
| Lithuanians | 98.0 /100 | #88 | Exceptional 2.4% |
| Immigrants from Congo | 98.0 /100 | #89 | Exceptional 2.4% |
| Immigrants from Czechoslovakia | 97.7 /100 | #90 | Exceptional 2.4% |
| Immigrants from Jordan | 97.7 /100 | #91 | Exceptional 2.4% |
| Icelanders | 97.4 /100 | #92 | Exceptional 2.4% |
| Immigrants from Latvia | 97.0 /100 | #93 | Exceptional 2.4% |
Immigrants from Northern Africa Self-Care Disability Correlation Summary
| Measurement | Immigrants from Northern Africa Data | Self-Care Disability Data |
| Minimum | 0.085% | 0.26% |
| Maximum | 19.2% | 4.1% |
| Range | 19.1% | 3.8% |
| Mean | 5.0% | 2.2% |
| Median | 4.0% | 2.2% |
| Interquartile 25% (IQ1) | 2.0% | 1.8% |
| Interquartile 75% (IQ3) | 6.4% | 2.5% |
| Interquartile Range (IQR) | 4.5% | 0.68% |
| Standard Deviation (Sample) | 4.3% | 0.70% |
| Standard Deviation (Population) | 4.2% | 0.69% |
Correlation Details
| Immigrants from Northern Africa Percentile | Sample Size | Self-Care Disability |
[ 0.0% - 0.5% ] 0.085% | 203,308,420 | 2.5% |
[ 0.0% - 0.5% ] 0.27% | 61,361,203 | 2.4% |
[ 0.0% - 0.5% ] 0.46% | 28,696,036 | 2.5% |
[ 0.5% - 1.0% ] 0.68% | 10,883,711 | 2.2% |
[ 0.5% - 1.0% ] 0.88% | 5,054,101 | 2.2% |
[ 1.0% - 1.5% ] 1.09% | 4,022,531 | 2.3% |
[ 1.0% - 1.5% ] 1.26% | 2,386,267 | 2.2% |
[ 1.0% - 1.5% ] 1.48% | 1,354,069 | 2.3% |
[ 1.5% - 2.0% ] 1.64% | 826,502 | 1.9% |
[ 1.5% - 2.0% ] 1.86% | 918,446 | 2.6% |
[ 2.0% - 2.5% ] 2.09% | 220,919 | 1.8% |
[ 2.0% - 2.5% ] 2.24% | 439,114 | 2.2% |
[ 2.0% - 2.5% ] 2.43% | 162,812 | 2.6% |
[ 2.5% - 3.0% ] 2.70% | 187,097 | 2.2% |
[ 2.5% - 3.0% ] 2.81% | 389,068 | 2.1% |
[ 3.0% - 3.5% ] 3.04% | 58,492 | 1.8% |
[ 3.0% - 3.5% ] 3.27% | 58,808 | 1.7% |
[ 3.0% - 3.5% ] 3.35% | 14,102 | 1.6% |
[ 3.5% - 4.0% ] 3.58% | 24,995 | 2.1% |
[ 3.5% - 4.0% ] 3.80% | 21,420 | 4.0% |
[ 4.0% - 4.5% ] 4.22% | 46,787 | 2.1% |
[ 4.0% - 4.5% ] 4.41% | 12,424 | 2.2% |
[ 4.5% - 5.0% ] 4.56% | 33,627 | 2.2% |
[ 4.5% - 5.0% ] 4.96% | 46,339 | 1.3% |
[ 5.0% - 5.5% ] 5.24% | 223,532 | 1.9% |
[ 5.0% - 5.5% ] 5.41% | 3,162 | 1.1% |
[ 5.5% - 6.0% ] 5.53% | 51,695 | 2.7% |
[ 5.5% - 6.0% ] 5.81% | 2,566 | 3.1% |
[ 6.0% - 6.5% ] 6.22% | 8,815 | 2.6% |
[ 6.0% - 6.5% ] 6.32% | 140,994 | 2.9% |
[ 6.5% - 7.0% ] 6.58% | 5,000 | 1.4% |
[ 6.5% - 7.0% ] 6.82% | 1,363 | 4.1% |
[ 7.5% - 8.0% ] 7.90% | 6,938 | 2.5% |
[ 8.5% - 9.0% ] 8.81% | 1,339 | 1.9% |
[ 10.0% - 10.5% ] 10.02% | 5,751 | 0.26% |
[ 10.0% - 10.5% ] 10.12% | 1,206 | 1.3% |
[ 11.5% - 12.0% ] 11.78% | 3,056 | 2.7% |
[ 13.0% - 13.5% ] 13.49% | 1,394 | 2.9% |
[ 14.0% - 14.5% ] 14.46% | 332 | 2.5% |
[ 19.0% - 19.5% ] 19.16% | 981 | 1.1% |