Immigrants from Bulgaria Self-Care Disability

COMPARE

Immigrants from Bulgaria
Race
Ancestry
AfghanAfricanAlaska NativeAlaskan AthabascanAlbanianAleutAlsatianAmericanApacheArabArapahoArgentineanArmenianAssyrian/Chaldean/SyriacAustralianAustrianBahamianBangladeshiBarbadianBasqueBelgianBelizeanBermudanBhutaneseBlackfeetBolivianBrazilianBritishBritish West IndianBulgarianBurmeseCajunCambodianCanadianCape VerdeanCarpatho RusynCelticCentral AmericanCentral American IndianCherokeeCheyenneChickasawChileanChineseChippewaChoctawColombianColvilleComancheCosta RicanCreeCreekCroatianCrowCubanCypriotCzechCzechoslovakianDanishDelawareDominicanDutchDutch West IndianEastern EuropeanEcuadorianEgyptianEnglishEstonianEthiopianEuropeanFijianFilipinoFinnishFrenchFrench American IndianFrench CanadianGermanGerman RussianGhanaianGreekGuamanian/ChamorroGuatemalanGuyaneseHaitianHmongHonduranHopiHoumaHungarianIcelanderIndian (Asian)IndonesianInupiatIranianIraqiIrishIroquoisIsraeliItalianJamaicanJapaneseJordanianKenyanKiowaKoreanLaotianLatvianLebaneseLiberianLithuanianLumbeeLuxembourgerMacedonianMalaysianMalteseMarshalleseMenomineeMexicanMexican American IndianMongolianMoroccanNative HawaiianNavajoNepaleseNew ZealanderNicaraguanNigerianNorthern EuropeanNorwegianOkinawanOsageOttawaPaiutePakistaniPalestinianPanamanianParaguayanPennsylvania GermanPeruvianPimaPolishPortuguesePotawatomiPuebloPuerto RicanPuget Sound SalishRomanianRussianSalvadoranSamoanScandinavianScotch-IrishScottishSeminoleSenegaleseSerbianShoshoneSierra LeoneanSiouxSlavicSlovakSloveneSomaliSouth AfricanSouth AmericanSouth American IndianSoviet UnionSpaniardSpanishSpanish AmericanSpanish American IndianSri LankanSubsaharan AfricanSudaneseSwedishSwissSyrianTaiwaneseThaiTlingit-HaidaTohono O'OdhamTonganTrinidadian and TobagonianTsimshianTurkishU.S. Virgin IslanderUgandanUkrainianUruguayanUteVenezuelanVietnameseWelshWest IndianYakamaYaquiYugoslavianYumanYup'ikZimbabwean
Immigration
NonimmigrantsImmigrantsAfghanistanAfricaAlbaniaArgentinaArmeniaAsiaAustraliaAustriaBahamasBangladeshBarbadosBelarusBelgiumBelizeBoliviaBosnia and HerzegovinaBrazilBulgariaBurma/MyanmarCabo VerdeCambodiaCameroonCanadaCaribbeanCentral AmericaChileChinaColombiaCongoCosta RicaCroatiaCubaCzechoslovakiaDenmarkDominicaDominican RepublicEastern AfricaEastern AsiaEastern EuropeEcuadorEgyptEl SalvadorEnglandEritreaEthiopiaEuropeFijiFranceGermanyGhanaGreeceGrenadaGuatemalaGuyanaHaitiHondurasHong KongHungaryIndiaIndonesiaIranIraqIrelandIsraelItalyJamaicaJapanJordanKazakhstanKenyaKoreaKuwaitLaosLatin AmericaLatviaLebanonLiberiaLithuaniaMalaysiaMexicoMicronesiaMiddle AfricaMoldovaMoroccoNepalNetherlandsNicaraguaNigeriaNorth AmericaNorth MacedoniaNorthern AfricaNorthern EuropeNorwayOceaniaPakistanPanamaPeruPhilippinesPolandPortugalRomaniaRussiaSaudi ArabiaScotlandSenegalSerbiaSierra LeoneSingaporeSomaliaSouth AfricaSouth AmericaSouth Central AsiaSouth Eastern AsiaSouthern EuropeSpainSri LankaSt. Vincent and the GrenadinesSudanSwedenSwitzerlandSyriaTaiwanThailandTrinidad and TobagoTurkeyUgandaUkraineUruguayUzbekistanVenezuelaVietnamWest IndiesWestern AfricaWestern AsiaWestern EuropeYemenZaireZimbabweAzores
Select to Compare
Race
Ancestry
AfghanAfricanAlaska NativeAlaskan AthabascanAlbanianAleutAlsatianAmericanApacheArabArapahoArgentineanArmenianAssyrian/Chaldean/SyriacAustralianAustrianBahamianBangladeshiBarbadianBasqueBelgianBelizeanBermudanBhutaneseBlackfeetBolivianBrazilianBritishBritish West IndianBulgarianBurmeseCajunCambodianCanadianCape VerdeanCarpatho RusynCelticCentral AmericanCentral American IndianCherokeeCheyenneChickasawChileanChineseChippewaChoctawColombianColvilleComancheCosta RicanCreeCreekCroatianCrowCubanCypriotCzechCzechoslovakianDanishDelawareDominicanDutchDutch West IndianEastern EuropeanEcuadorianEgyptianEnglishEstonianEthiopianEuropeanFijianFilipinoFinnishFrenchFrench American IndianFrench CanadianGermanGerman RussianGhanaianGreekGuamanian/ChamorroGuatemalanGuyaneseHaitianHmongHonduranHopiHoumaHungarianIcelanderIndian (Asian)IndonesianInupiatIranianIraqiIrishIroquoisIsraeliItalianJamaicanJapaneseJordanianKenyanKiowaKoreanLaotianLatvianLebaneseLiberianLithuanianLumbeeLuxembourgerMacedonianMalaysianMalteseMarshalleseMenomineeMexicanMexican American IndianMongolianMoroccanNative HawaiianNavajoNepaleseNew ZealanderNicaraguanNigerianNorthern EuropeanNorwegianOkinawanOsageOttawaPaiutePakistaniPalestinianPanamanianParaguayanPennsylvania GermanPeruvianPimaPolishPortuguesePotawatomiPuebloPuerto RicanPuget Sound SalishRomanianRussianSalvadoranSamoanScandinavianScotch-IrishScottishSeminoleSenegaleseSerbianShoshoneSierra LeoneanSiouxSlavicSlovakSloveneSomaliSouth AfricanSouth AmericanSouth American IndianSoviet UnionSpaniardSpanishSpanish AmericanSpanish American IndianSri LankanSubsaharan AfricanSudaneseSwedishSwissSyrianTaiwaneseThaiTlingit-HaidaTohono O'OdhamTonganTrinidadian and TobagonianTsimshianTurkishU.S. Virgin IslanderUgandanUkrainianUruguayanUteVenezuelanVietnameseWelshWest IndianYakamaYaquiYugoslavianYumanYup'ikZimbabwean
Immigration
NonimmigrantsImmigrantsAfghanistanAfricaAlbaniaArgentinaArmeniaAsiaAustraliaAustriaBahamasBangladeshBarbadosBelarusBelgiumBelizeBoliviaBosnia and HerzegovinaBrazilBurma/MyanmarCabo VerdeCambodiaCameroonCanadaCaribbeanCentral AmericaChileChinaColombiaCongoCosta RicaCroatiaCubaCzechoslovakiaDenmarkDominicaDominican RepublicEastern AfricaEastern AsiaEastern EuropeEcuadorEgyptEl SalvadorEnglandEritreaEthiopiaEuropeFijiFranceGermanyGhanaGreeceGrenadaGuatemalaGuyanaHaitiHondurasHong KongHungaryIndiaIndonesiaIranIraqIrelandIsraelItalyJamaicaJapanJordanKazakhstanKenyaKoreaKuwaitLaosLatin AmericaLatviaLebanonLiberiaLithuaniaMalaysiaMexicoMicronesiaMiddle AfricaMoldovaMoroccoNepalNetherlandsNicaraguaNigeriaNorth AmericaNorth MacedoniaNorthern AfricaNorthern EuropeNorwayOceaniaPakistanPanamaPeruPhilippinesPolandPortugalRomaniaRussiaSaudi ArabiaScotlandSenegalSerbiaSierra LeoneSingaporeSomaliaSouth AfricaSouth AmericaSouth Central AsiaSouth Eastern AsiaSouthern EuropeSpainSri LankaSt. Vincent and the GrenadinesSudanSwedenSwitzerlandSyriaTaiwanThailandTrinidad and TobagoTurkeyUgandaUkraineUruguayUzbekistanVenezuelaVietnamWest IndiesWestern AfricaWestern AsiaWestern EuropeYemenZaireZimbabweAzores
Self-Care Disability
Income
Poverty
Unemployment
Labor Participation
Family Structure
Vehicle Availability
Education Level
Disability

Immigrants from Bulgaria Self-Care Disability
Exceptional

2.3%
SELF-CARE DISABILITY
99.8/ 100
METRIC RATING
39th/ 347
METRIC RANK

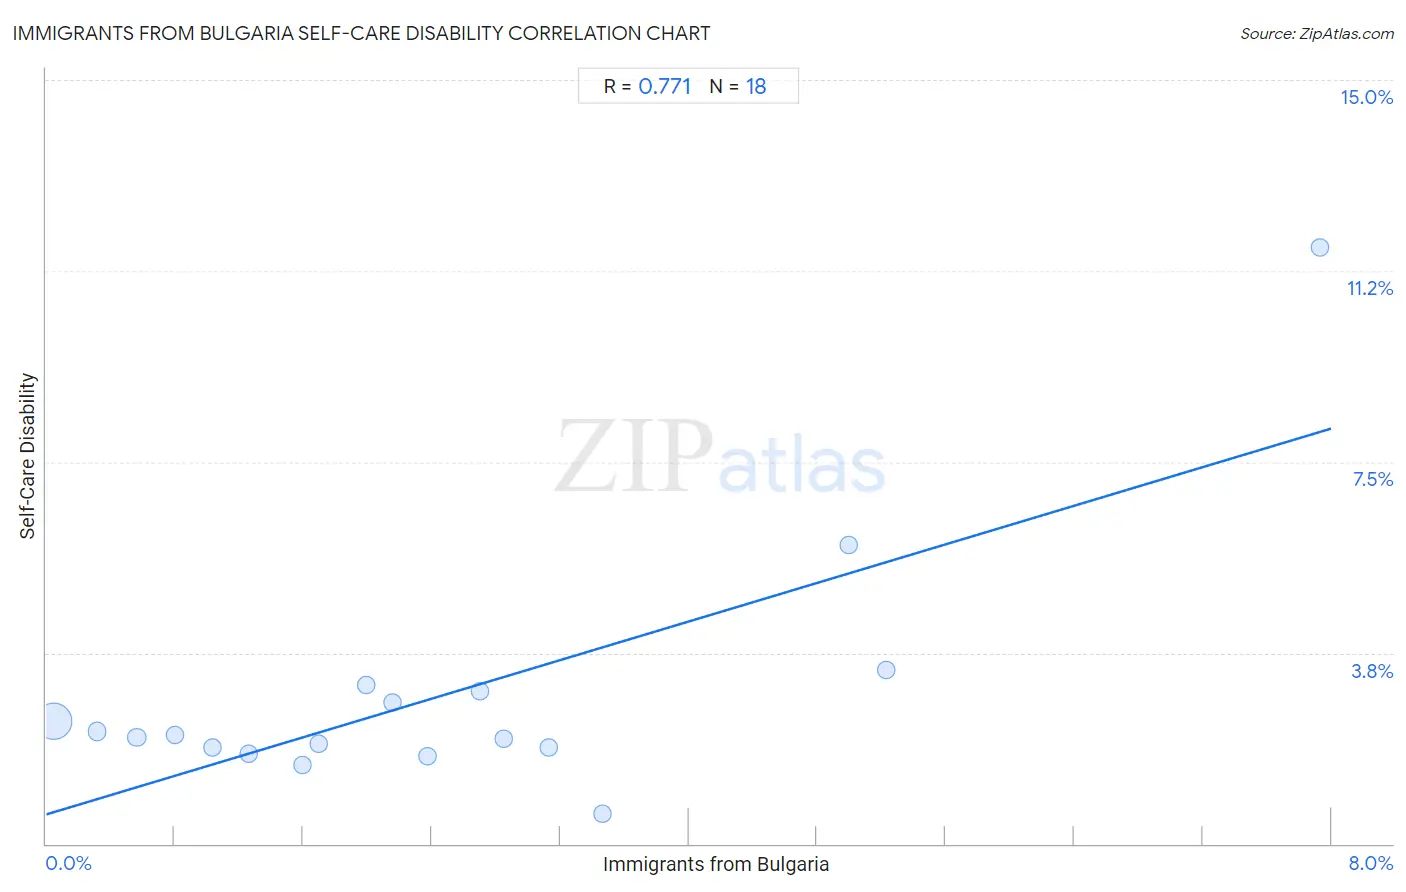
Immigrants from Bulgaria Self-Care Disability Correlation Chart

The statistical analysis conducted on geographies consisting of 172,509,254 people shows a strong positive correlation between the proportion of Immigrants from Bulgaria and percentage of population with self-care disability in the United States with a correlation coefficient (R) of 0.771 and weighted average of 2.3%. On average, for every 1% (one percent) increase in Immigrants from Bulgaria within a typical geography, there is an increase of 0.95% in percentage of population with self-care disability.
Immigrants from Bulgaria Self-Care Disability
It is essential to understand that the correlation between the percentage of Immigrants from Bulgaria and percentage of population with self-care disability does not imply a direct cause-and-effect relationship. It remains uncertain whether the presence of Immigrants from Bulgaria influences an upward or downward trend in the level of percentage of population with self-care disability within an area, or if Immigrants from Bulgaria simply ended up residing in those areas with higher or lower levels of percentage of population with self-care disability due to other factors.

Demographics Similar to Immigrants from Bulgaria by Self-Care Disability

In terms of self-care disability, the demographic groups most similar to Immigrants from Bulgaria are Iranian (2.3%, a difference of 0.040%), Immigrants from Eastern Africa (2.3%, a difference of 0.10%), Immigrants from Sudan (2.3%, a difference of 0.11%), Immigrants from Uganda (2.3%, a difference of 0.21%), and Immigrants from Sweden (2.3%, a difference of 0.23%).
DemographicsRating | RankSelf-Care Disability
Burmese
99.9
/100
|
#32
Exceptional
2.3%
Immigrants from Korea
99.9
/100
|
#33
Exceptional
2.3%
Immigrants from Turkey
99.9
/100
|
#34
Exceptional
2.3%
Immigrants from Australia
99.9
/100
|
#35
Exceptional
2.3%
Immigrants from Lithuania
99.9
/100
|
#36
Exceptional
2.3%
Immigrants from Sweden
99.9
/100
|
#37
Exceptional
2.3%
Immigrants from Eastern Africa
99.9
/100
|
#38
Exceptional
2.3%
Immigrants from Bulgaria
99.8
/100
|
#39
Exceptional
2.3%
Iranians
99.8
/100
|
#40
Exceptional
2.3%
Immigrants from Sudan
99.8
/100
|
#41
Exceptional
2.3%
Immigrants from Uganda
99.8
/100
|
#42
Exceptional
2.3%
Immigrants from Pakistan
99.8
/100
|
#43
Exceptional
2.3%
Immigrants from South Africa
99.8
/100
|
#44
Exceptional
2.3%
Norwegians
99.8
/100
|
#45
Exceptional
2.3%
Czechs
99.8
/100
|
#46
Exceptional
2.3%

Immigrants from Bulgaria Self-Care Disability Correlation Summary

MeasurementImmigrants from Bulgaria DataSelf-Care Disability Data
Minimum0.050%0.60%
Maximum7.9%11.7%
Range7.9%11.1%
Mean2.5%2.9%
Median2.1%2.1%
Interquartile 25% (IQ1)1.0%1.9%
Interquartile 75% (IQ3)3.1%3.0%
Interquartile Range (IQR)2.1%1.1%
Standard Deviation (Sample)2.0%2.4%
Standard Deviation (Population)1.9%2.4%

Correlation Details

Immigrants from Bulgaria PercentileSample SizeSelf-Care Disability
[
0.0%
-
0.5%
]
0.050%
161,416,9782.4%
[
0.0%
-
0.5%
]
0.32%
7,169,3872.2%
[
0.5%
-
1.0%
]
0.56%
1,940,7652.1%
[
0.5%
-
1.0%
]
0.80%
836,1542.1%
[
1.0%
-
1.5%
]
1.03%
441,7611.9%
[
1.0%
-
1.5%
]
1.26%
295,2501.8%
[
1.5%
-
2.0%
]
1.59%
163,6231.5%
[
1.5%
-
2.0%
]
1.70%
96,0952.0%
[
1.5%
-
2.0%
]
1.99%
5,0243.1%
[
2.0%
-
2.5%
]
2.16%
41,4362.8%
[
2.0%
-
2.5%
]
2.38%
71,4611.7%
[
2.5%
-
3.0%
]
2.70%
7,8543.0%
[
2.5%
-
3.0%
]
2.85%
4,3542.1%
[
3.0%
-
3.5%
]
3.13%
3,2941.9%
[
3.0%
-
3.5%
]
3.46%
9,9600.60%
[
4.5%
-
5.0%
]
5.00%
2,1605.9%
[
5.0%
-
5.5%
]
5.23%
3,0423.4%
[
7.5%
-
8.0%
]
7.93%
65611.7%