Immigrants from Indonesia Self-Care Disability
COMPARE
Immigrants from Indonesia
Select to Compare
Self-Care Disability
Immigrants from Indonesia Self-Care Disability
2.4%
SELF-CARE DISABILITY
94.3/ 100
METRIC RATING
106th/ 347
METRIC RANK
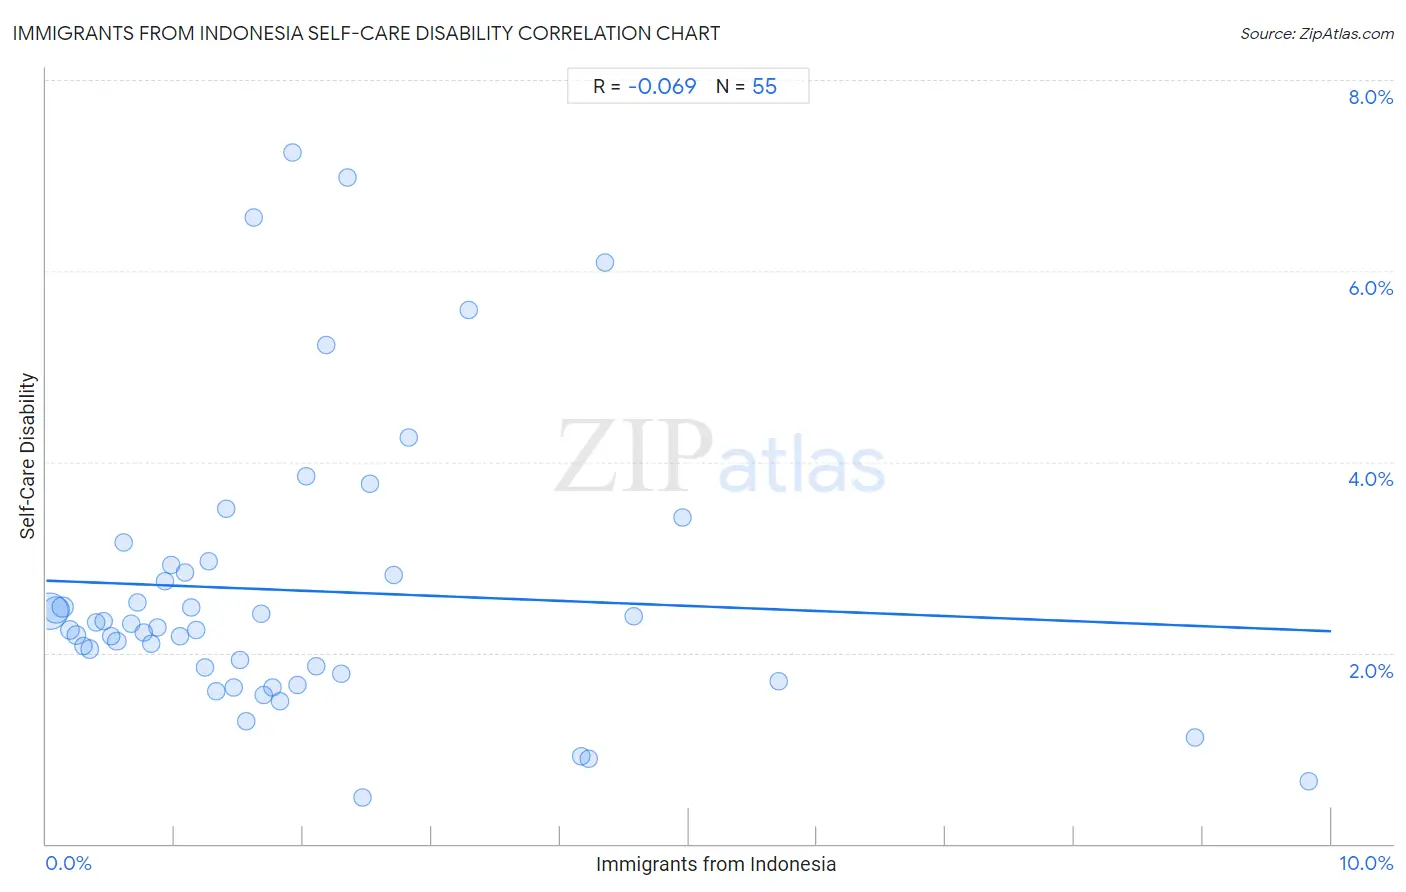
Immigrants from Indonesia Self-Care Disability Correlation Chart
The statistical analysis conducted on geographies consisting of 215,649,762 people shows a slight negative correlation between the proportion of Immigrants from Indonesia and percentage of population with self-care disability in the United States with a correlation coefficient (R) of -0.069 and weighted average of 2.4%. On average, for every 1% (one percent) increase in Immigrants from Indonesia within a typical geography, there is a decrease of 0.053% in percentage of population with self-care disability.
It is essential to understand that the correlation between the percentage of Immigrants from Indonesia and percentage of population with self-care disability does not imply a direct cause-and-effect relationship. It remains uncertain whether the presence of Immigrants from Indonesia influences an upward or downward trend in the level of percentage of population with self-care disability within an area, or if Immigrants from Indonesia simply ended up residing in those areas with higher or lower levels of percentage of population with self-care disability due to other factors.
Demographics Similar to Immigrants from Indonesia by Self-Care Disability
In terms of self-care disability, the demographic groups most similar to Immigrants from Indonesia are Carpatho Rusyn (2.4%, a difference of 0.010%), British (2.4%, a difference of 0.010%), Bhutanese (2.4%, a difference of 0.040%), Greek (2.4%, a difference of 0.040%), and Slovene (2.4%, a difference of 0.050%).
| Demographics | Rating | Rank | Self-Care Disability |
| Immigrants from Israel | 96.1 /100 | #99 | Exceptional 2.4% |
| Europeans | 95.8 /100 | #100 | Exceptional 2.4% |
| Immigrants from Scotland | 95.7 /100 | #101 | Exceptional 2.4% |
| Croatians | 95.0 /100 | #102 | Exceptional 2.4% |
| Alsatians | 94.9 /100 | #103 | Exceptional 2.4% |
| Bhutanese | 94.5 /100 | #104 | Exceptional 2.4% |
| Carpatho Rusyns | 94.4 /100 | #105 | Exceptional 2.4% |
| Immigrants from Indonesia | 94.3 /100 | #106 | Exceptional 2.4% |
| British | 94.3 /100 | #107 | Exceptional 2.4% |
| Greeks | 94.1 /100 | #108 | Exceptional 2.4% |
| Slovenes | 94.1 /100 | #109 | Exceptional 2.4% |
| Immigrants from Africa | 93.7 /100 | #110 | Exceptional 2.4% |
| Serbians | 93.6 /100 | #111 | Exceptional 2.4% |
| Scandinavians | 93.5 /100 | #112 | Exceptional 2.4% |
| South Americans | 93.2 /100 | #113 | Exceptional 2.4% |
Immigrants from Indonesia Self-Care Disability Correlation Summary
| Measurement | Immigrants from Indonesia Data | Self-Care Disability Data |
| Minimum | 0.025% | 0.49% |
| Maximum | 9.8% | 7.2% |
| Range | 9.8% | 6.8% |
| Mean | 2.0% | 2.7% |
| Median | 1.5% | 2.3% |
| Interquartile 25% (IQ1) | 0.71% | 1.8% |
| Interquartile 75% (IQ3) | 2.3% | 2.9% |
| Interquartile Range (IQR) | 1.6% | 1.1% |
| Standard Deviation (Sample) | 2.0% | 1.5% |
| Standard Deviation (Population) | 1.9% | 1.5% |
Correlation Details
| Immigrants from Indonesia Percentile | Sample Size | Self-Care Disability |
[ 0.0% - 0.5% ] 0.025% | 113,793,090 | 2.4% |
[ 0.0% - 0.5% ] 0.075% | 53,796,881 | 2.5% |
[ 0.0% - 0.5% ] 0.13% | 20,824,959 | 2.5% |
[ 0.0% - 0.5% ] 0.18% | 8,278,920 | 2.2% |
[ 0.0% - 0.5% ] 0.24% | 6,221,031 | 2.2% |
[ 0.0% - 0.5% ] 0.29% | 2,911,790 | 2.1% |
[ 0.0% - 0.5% ] 0.34% | 3,246,096 | 2.0% |
[ 0.0% - 0.5% ] 0.39% | 1,371,621 | 2.3% |
[ 0.0% - 0.5% ] 0.44% | 1,001,427 | 2.3% |
[ 0.5% - 1.0% ] 0.50% | 620,883 | 2.2% |
[ 0.5% - 1.0% ] 0.55% | 677,470 | 2.1% |
[ 0.5% - 1.0% ] 0.60% | 724,963 | 3.2% |
[ 0.5% - 1.0% ] 0.66% | 470,740 | 2.3% |
[ 0.5% - 1.0% ] 0.71% | 311,745 | 2.5% |
[ 0.5% - 1.0% ] 0.75% | 245,055 | 2.2% |
[ 0.5% - 1.0% ] 0.81% | 78,346 | 2.1% |
[ 0.5% - 1.0% ] 0.86% | 209,745 | 2.3% |
[ 0.5% - 1.0% ] 0.93% | 90,850 | 2.8% |
[ 0.5% - 1.0% ] 0.97% | 75,129 | 2.9% |
[ 1.0% - 1.5% ] 1.04% | 25,174 | 2.2% |
[ 1.0% - 1.5% ] 1.08% | 18,353 | 2.8% |
[ 1.0% - 1.5% ] 1.13% | 122,247 | 2.5% |
[ 1.0% - 1.5% ] 1.17% | 59,795 | 2.2% |
[ 1.0% - 1.5% ] 1.24% | 57,812 | 1.8% |
[ 1.0% - 1.5% ] 1.27% | 12,762 | 3.0% |
[ 1.0% - 1.5% ] 1.32% | 111,183 | 1.6% |
[ 1.0% - 1.5% ] 1.40% | 4,496 | 3.5% |
[ 1.0% - 1.5% ] 1.46% | 2,949 | 1.6% |
[ 1.5% - 2.0% ] 1.50% | 2,459 | 1.9% |
[ 1.5% - 2.0% ] 1.55% | 12,166 | 1.3% |
[ 1.5% - 2.0% ] 1.61% | 4,718 | 6.6% |
[ 1.5% - 2.0% ] 1.67% | 68,325 | 2.4% |
[ 1.5% - 2.0% ] 1.69% | 1,477 | 1.6% |
[ 1.5% - 2.0% ] 1.76% | 55,333 | 1.6% |
[ 1.5% - 2.0% ] 1.82% | 2,368 | 1.5% |
[ 1.5% - 2.0% ] 1.92% | 1,304 | 7.2% |
[ 1.5% - 2.0% ] 1.95% | 205 | 1.7% |
[ 2.0% - 2.5% ] 2.02% | 44,107 | 3.8% |
[ 2.0% - 2.5% ] 2.10% | 286 | 1.9% |
[ 2.0% - 2.5% ] 2.18% | 24,883 | 5.2% |
[ 2.0% - 2.5% ] 2.29% | 5,495 | 1.8% |
[ 2.0% - 2.5% ] 2.35% | 1,746 | 7.0% |
[ 2.0% - 2.5% ] 2.46% | 4,150 | 0.49% |
[ 2.5% - 3.0% ] 2.52% | 1,983 | 3.8% |
[ 2.5% - 3.0% ] 2.70% | 10,918 | 2.8% |
[ 2.5% - 3.0% ] 2.82% | 12,478 | 4.3% |
[ 3.0% - 3.5% ] 3.29% | 23,054 | 5.6% |
[ 4.0% - 4.5% ] 4.16% | 985 | 0.91% |
[ 4.0% - 4.5% ] 4.22% | 1,138 | 0.89% |
[ 4.0% - 4.5% ] 4.35% | 1,012 | 6.1% |
[ 4.5% - 5.0% ] 4.57% | 634 | 2.4% |
[ 4.5% - 5.0% ] 4.95% | 222 | 3.4% |
[ 5.5% - 6.0% ] 5.70% | 193 | 1.7% |
[ 8.5% - 9.0% ] 8.94% | 1,634 | 1.1% |
[ 9.5% - 10.0% ] 9.83% | 977 | 0.65% |