Immigrants from Afghanistan Self-Care Disability
COMPARE
Immigrants from Afghanistan
Select to Compare
Self-Care Disability
Immigrants from Afghanistan Self-Care Disability
2.5%
SELF-CARE DISABILITY
47.6/ 100
METRIC RATING
176th/ 347
METRIC RANK
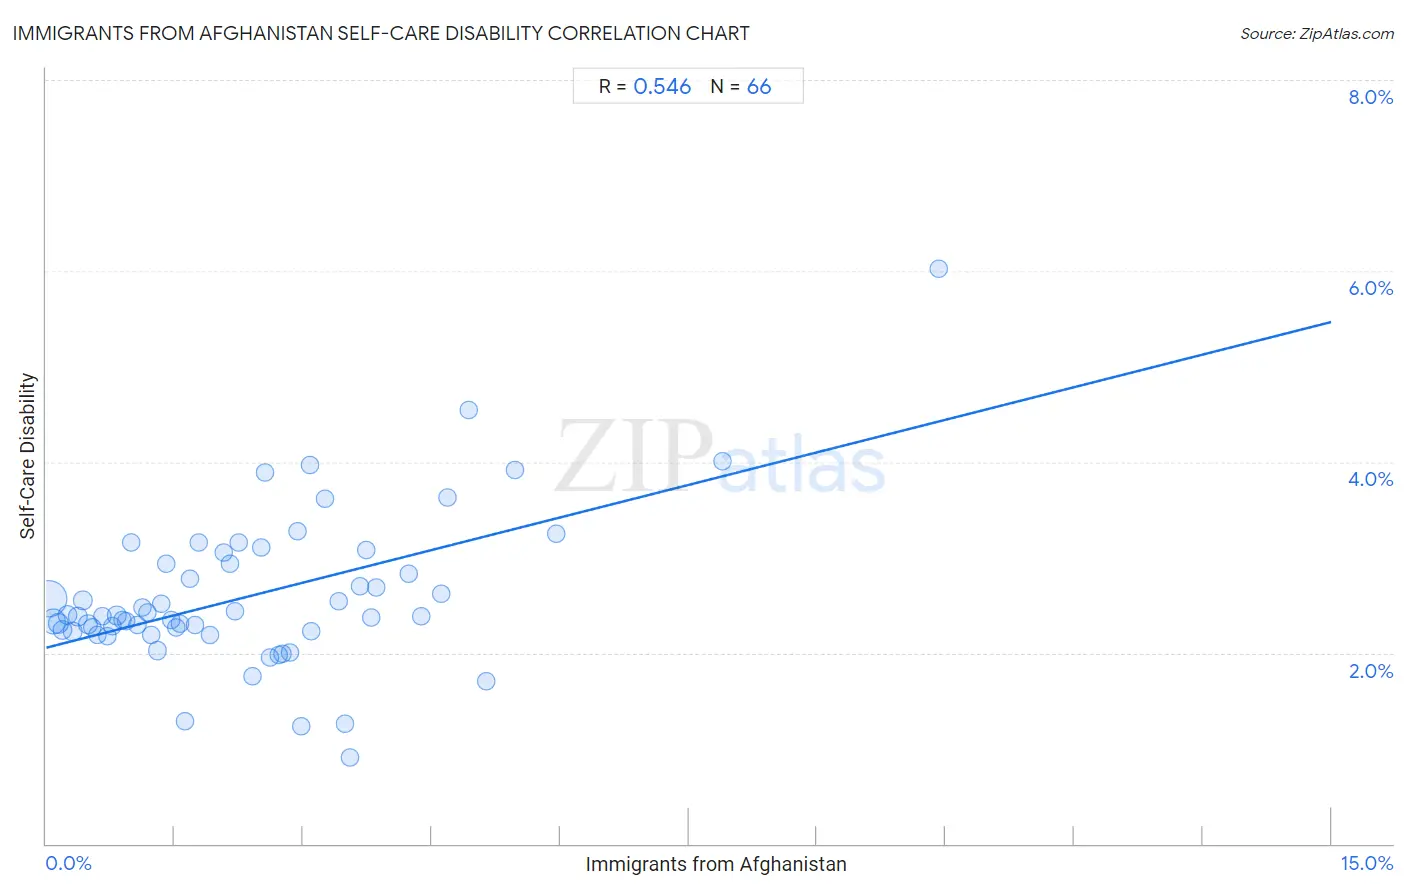
Immigrants from Afghanistan Self-Care Disability Correlation Chart
The statistical analysis conducted on geographies consisting of 147,580,725 people shows a substantial positive correlation between the proportion of Immigrants from Afghanistan and percentage of population with self-care disability in the United States with a correlation coefficient (R) of 0.546 and weighted average of 2.5%. On average, for every 1% (one percent) increase in Immigrants from Afghanistan within a typical geography, there is an increase of 0.23% in percentage of population with self-care disability.
It is essential to understand that the correlation between the percentage of Immigrants from Afghanistan and percentage of population with self-care disability does not imply a direct cause-and-effect relationship. It remains uncertain whether the presence of Immigrants from Afghanistan influences an upward or downward trend in the level of percentage of population with self-care disability within an area, or if Immigrants from Afghanistan simply ended up residing in those areas with higher or lower levels of percentage of population with self-care disability due to other factors.
Demographics Similar to Immigrants from Afghanistan by Self-Care Disability
In terms of self-care disability, the demographic groups most similar to Immigrants from Afghanistan are Immigrants from Kazakhstan (2.5%, a difference of 0.040%), English (2.5%, a difference of 0.070%), Immigrants from Bosnia and Herzegovina (2.5%, a difference of 0.090%), Hungarian (2.5%, a difference of 0.10%), and Welsh (2.5%, a difference of 0.11%).
| Demographics | Rating | Rank | Self-Care Disability |
| Immigrants from Somalia | 55.9 /100 | #169 | Average 2.5% |
| Scottish | 54.3 /100 | #170 | Average 2.5% |
| Pennsylvania Germans | 53.5 /100 | #171 | Average 2.5% |
| Czechoslovakians | 53.5 /100 | #172 | Average 2.5% |
| Immigrants from Burma/Myanmar | 52.8 /100 | #173 | Average 2.5% |
| Welsh | 50.0 /100 | #174 | Average 2.5% |
| Immigrants from Bosnia and Herzegovina | 49.6 /100 | #175 | Average 2.5% |
| Immigrants from Afghanistan | 47.6 /100 | #176 | Average 2.5% |
| Immigrants from Kazakhstan | 46.7 /100 | #177 | Average 2.5% |
| English | 46.2 /100 | #178 | Average 2.5% |
| Hungarians | 45.5 /100 | #179 | Average 2.5% |
| Indonesians | 41.2 /100 | #180 | Average 2.5% |
| Ghanaians | 40.4 /100 | #181 | Average 2.5% |
| Maltese | 37.5 /100 | #182 | Fair 2.5% |
| Salvadorans | 36.4 /100 | #183 | Fair 2.5% |
Immigrants from Afghanistan Self-Care Disability Correlation Summary
| Measurement | Immigrants from Afghanistan Data | Self-Care Disability Data |
| Minimum | 0.029% | 0.91% |
| Maximum | 10.4% | 6.0% |
| Range | 10.4% | 5.1% |
| Mean | 2.4% | 2.6% |
| Median | 2.0% | 2.4% |
| Interquartile 25% (IQ1) | 0.93% | 2.2% |
| Interquartile 75% (IQ3) | 3.4% | 2.9% |
| Interquartile Range (IQR) | 2.5% | 0.71% |
| Standard Deviation (Sample) | 1.9% | 0.80% |
| Standard Deviation (Population) | 1.9% | 0.80% |
Correlation Details
| Immigrants from Afghanistan Percentile | Sample Size | Self-Care Disability |
[ 0.0% - 0.5% ] 0.029% | 75,099,764 | 2.6% |
[ 0.0% - 0.5% ] 0.083% | 28,196,250 | 2.3% |
[ 0.0% - 0.5% ] 0.14% | 12,724,393 | 2.3% |
[ 0.0% - 0.5% ] 0.20% | 5,306,403 | 2.2% |
[ 0.0% - 0.5% ] 0.25% | 5,074,905 | 2.4% |
[ 0.0% - 0.5% ] 0.31% | 3,206,855 | 2.2% |
[ 0.0% - 0.5% ] 0.37% | 2,335,845 | 2.4% |
[ 0.0% - 0.5% ] 0.43% | 2,143,369 | 2.6% |
[ 0.0% - 0.5% ] 0.49% | 1,393,837 | 2.3% |
[ 0.5% - 1.0% ] 0.54% | 1,602,109 | 2.3% |
[ 0.5% - 1.0% ] 0.60% | 785,903 | 2.2% |
[ 0.5% - 1.0% ] 0.66% | 785,853 | 2.4% |
[ 0.5% - 1.0% ] 0.71% | 854,084 | 2.2% |
[ 0.5% - 1.0% ] 0.77% | 906,910 | 2.3% |
[ 0.5% - 1.0% ] 0.82% | 926,389 | 2.4% |
[ 0.5% - 1.0% ] 0.89% | 276,819 | 2.3% |
[ 0.5% - 1.0% ] 0.93% | 694,275 | 2.3% |
[ 0.5% - 1.0% ] 0.99% | 526,494 | 3.2% |
[ 1.0% - 1.5% ] 1.06% | 578,778 | 2.3% |
[ 1.0% - 1.5% ] 1.12% | 365,516 | 2.5% |
[ 1.0% - 1.5% ] 1.18% | 574,334 | 2.4% |
[ 1.0% - 1.5% ] 1.23% | 194,636 | 2.2% |
[ 1.0% - 1.5% ] 1.30% | 301,238 | 2.0% |
[ 1.0% - 1.5% ] 1.35% | 177,016 | 2.5% |
[ 1.0% - 1.5% ] 1.40% | 182,752 | 2.9% |
[ 1.0% - 1.5% ] 1.45% | 156,284 | 2.3% |
[ 1.5% - 2.0% ] 1.52% | 162,757 | 2.3% |
[ 1.5% - 2.0% ] 1.56% | 158,976 | 2.3% |
[ 1.5% - 2.0% ] 1.62% | 149,493 | 1.3% |
[ 1.5% - 2.0% ] 1.68% | 157,625 | 2.8% |
[ 1.5% - 2.0% ] 1.74% | 153,547 | 2.3% |
[ 1.5% - 2.0% ] 1.78% | 96,788 | 3.2% |
[ 1.5% - 2.0% ] 1.91% | 161,077 | 2.2% |
[ 2.0% - 2.5% ] 2.08% | 127,855 | 3.1% |
[ 2.0% - 2.5% ] 2.14% | 85,679 | 2.9% |
[ 2.0% - 2.5% ] 2.20% | 29,846 | 2.4% |
[ 2.0% - 2.5% ] 2.25% | 89,654 | 3.2% |
[ 2.0% - 2.5% ] 2.40% | 5,416 | 1.8% |
[ 2.5% - 3.0% ] 2.51% | 36,335 | 3.1% |
[ 2.5% - 3.0% ] 2.55% | 63,715 | 3.9% |
[ 2.5% - 3.0% ] 2.61% | 51,346 | 2.0% |
[ 2.5% - 3.0% ] 2.72% | 1,620 | 2.0% |
[ 2.5% - 3.0% ] 2.75% | 58,550 | 2.0% |
[ 2.5% - 3.0% ] 2.85% | 45,296 | 2.0% |
[ 2.5% - 3.0% ] 2.93% | 23,756 | 3.3% |
[ 2.5% - 3.0% ] 2.97% | 19,531 | 1.2% |
[ 3.0% - 3.5% ] 3.09% | 35,458 | 4.0% |
[ 3.0% - 3.5% ] 3.10% | 1,936 | 2.2% |
[ 3.0% - 3.5% ] 3.26% | 50,028 | 3.6% |
[ 3.0% - 3.5% ] 3.42% | 3,303 | 2.5% |
[ 3.0% - 3.5% ] 3.48% | 10,400 | 1.3% |
[ 3.5% - 4.0% ] 3.55% | 18,080 | 0.91% |
[ 3.5% - 4.0% ] 3.66% | 3,085 | 2.7% |
[ 3.5% - 4.0% ] 3.73% | 7,770 | 3.1% |
[ 3.5% - 4.0% ] 3.79% | 39,126 | 2.4% |
[ 3.5% - 4.0% ] 3.85% | 12,840 | 2.7% |
[ 4.0% - 4.5% ] 4.23% | 37,635 | 2.8% |
[ 4.0% - 4.5% ] 4.38% | 63,907 | 2.4% |
[ 4.5% - 5.0% ] 4.61% | 16,050 | 2.6% |
[ 4.5% - 5.0% ] 4.69% | 37,310 | 3.6% |
[ 4.5% - 5.0% ] 4.93% | 345 | 4.5% |
[ 5.0% - 5.5% ] 5.13% | 24,785 | 1.7% |
[ 5.0% - 5.5% ] 5.47% | 96,076 | 3.9% |
[ 5.5% - 6.0% ] 5.95% | 34,082 | 3.3% |
[ 7.5% - 8.0% ] 7.90% | 37,436 | 4.0% |
[ 10.0% - 10.5% ] 10.42% | 1,200 | 6.0% |