Scottish Self-Care Disability
COMPARE
Scottish
Select to Compare
Self-Care Disability
Scottish Self-Care Disability
2.5%
SELF-CARE DISABILITY
54.3/ 100
METRIC RATING
170th/ 347
METRIC RANK
Scottish Self-Care Disability Correlation Chart
The statistical analysis conducted on geographies consisting of 564,803,719 people shows a substantial positive correlation between the proportion of Scottish and percentage of population with self-care disability in the United States with a correlation coefficient (R) of 0.592 and weighted average of 2.5%. On average, for every 1% (one percent) increase in Scottish within a typical geography, there is an increase of 0.46% in percentage of population with self-care disability.
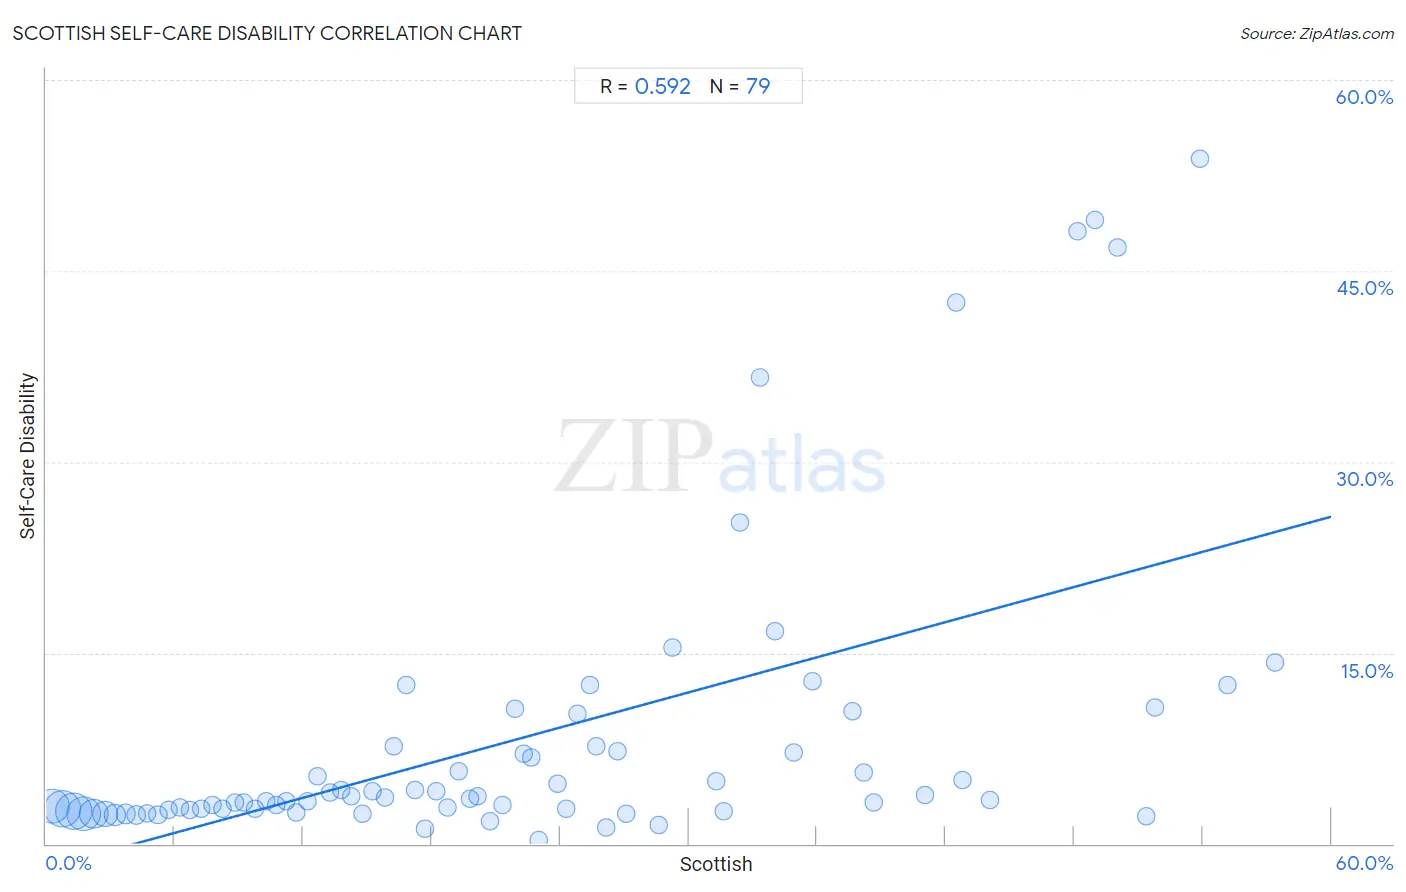
It is essential to understand that the correlation between the percentage of Scottish and percentage of population with self-care disability does not imply a direct cause-and-effect relationship. It remains uncertain whether the presence of Scottish influences an upward or downward trend in the level of percentage of population with self-care disability within an area, or if Scottish simply ended up residing in those areas with higher or lower levels of percentage of population with self-care disability due to other factors.
Demographics Similar to Scottish by Self-Care Disability
In terms of self-care disability, the demographic groups most similar to Scottish are Pennsylvania German (2.5%, a difference of 0.030%), Czechoslovakian (2.5%, a difference of 0.040%), Immigrants from Burma/Myanmar (2.5%, a difference of 0.070%), Immigrants from Somalia (2.5%, a difference of 0.080%), and Ute (2.5%, a difference of 0.14%).
| Demographics | Rating | Rank | Self-Care Disability |
| German Russians | 62.7 /100 | #163 | Good 2.5% |
| Immigrants from Vietnam | 59.3 /100 | #164 | Average 2.5% |
| Syrians | 59.0 /100 | #165 | Average 2.5% |
| Canadians | 58.8 /100 | #166 | Average 2.5% |
| Immigrants from Greece | 57.3 /100 | #167 | Average 2.5% |
| Ute | 57.1 /100 | #168 | Average 2.5% |
| Immigrants from Somalia | 55.9 /100 | #169 | Average 2.5% |
| Scottish | 54.3 /100 | #170 | Average 2.5% |
| Pennsylvania Germans | 53.5 /100 | #171 | Average 2.5% |
| Czechoslovakians | 53.5 /100 | #172 | Average 2.5% |
| Immigrants from Burma/Myanmar | 52.8 /100 | #173 | Average 2.5% |
| Welsh | 50.0 /100 | #174 | Average 2.5% |
| Immigrants from Bosnia and Herzegovina | 49.6 /100 | #175 | Average 2.5% |
| Immigrants from Afghanistan | 47.6 /100 | #176 | Average 2.5% |
| Immigrants from Kazakhstan | 46.7 /100 | #177 | Average 2.5% |
Scottish Self-Care Disability Correlation Summary
| Measurement | Scottish Data | Self-Care Disability Data |
| Minimum | 0.27% | 0.29% |
| Maximum | 57.4% | 53.8% |
| Range | 57.1% | 53.6% |
| Mean | 22.1% | 8.3% |
| Median | 19.8% | 3.6% |
| Interquartile 25% (IQ1) | 9.7% | 2.6% |
| Interquartile 75% (IQ3) | 32.4% | 7.7% |
| Interquartile Range (IQR) | 22.6% | 5.0% |
| Standard Deviation (Sample) | 15.2% | 11.8% |
| Standard Deviation (Population) | 15.1% | 11.7% |
Correlation Details
| Scottish Percentile | Sample Size | Self-Care Disability |
[ 0.0% - 0.5% ] 0.27% | 94,751,448 | 3.0% |
[ 0.5% - 1.0% ] 0.76% | 107,933,245 | 2.7% |
[ 1.0% - 1.5% ] 1.26% | 107,859,463 | 2.5% |
[ 1.5% - 2.0% ] 1.73% | 94,253,396 | 2.4% |
[ 2.0% - 2.5% ] 2.23% | 64,581,732 | 2.4% |
[ 2.5% - 3.0% ] 2.74% | 41,519,671 | 2.4% |
[ 3.0% - 3.5% ] 3.23% | 22,010,862 | 2.3% |
[ 3.5% - 4.0% ] 3.72% | 12,862,070 | 2.3% |
[ 4.0% - 4.5% ] 4.21% | 7,699,918 | 2.2% |
[ 4.5% - 5.0% ] 4.72% | 4,017,050 | 2.4% |
[ 5.0% - 5.5% ] 5.22% | 2,457,280 | 2.3% |
[ 5.5% - 6.0% ] 5.71% | 1,484,473 | 2.7% |
[ 6.0% - 6.5% ] 6.22% | 829,232 | 2.8% |
[ 6.5% - 7.0% ] 6.72% | 612,403 | 2.6% |
[ 7.0% - 7.5% ] 7.23% | 449,485 | 2.8% |
[ 7.5% - 8.0% ] 7.74% | 274,517 | 3.0% |
[ 8.0% - 8.5% ] 8.23% | 323,339 | 2.8% |
[ 8.5% - 9.0% ] 8.79% | 168,570 | 3.3% |
[ 9.0% - 9.5% ] 9.21% | 124,117 | 3.2% |
[ 9.5% - 10.0% ] 9.73% | 98,885 | 2.8% |
[ 10.0% - 10.5% ] 10.26% | 67,261 | 3.3% |
[ 10.5% - 11.0% ] 10.73% | 88,069 | 3.0% |
[ 11.0% - 11.5% ] 11.21% | 59,771 | 3.4% |
[ 11.5% - 12.0% ] 11.70% | 39,876 | 2.5% |
[ 12.0% - 12.5% ] 12.20% | 43,711 | 3.4% |
[ 12.5% - 13.0% ] 12.68% | 32,957 | 5.3% |
[ 13.0% - 13.5% ] 13.23% | 19,227 | 4.0% |
[ 13.5% - 14.0% ] 13.78% | 14,102 | 4.3% |
[ 14.0% - 14.5% ] 14.22% | 17,624 | 3.7% |
[ 14.5% - 15.0% ] 14.76% | 17,666 | 2.4% |
[ 15.0% - 15.5% ] 15.25% | 9,141 | 4.1% |
[ 15.5% - 16.0% ] 15.84% | 13,795 | 3.7% |
[ 16.0% - 16.5% ] 16.24% | 3,713 | 7.7% |
[ 16.5% - 17.0% ] 16.79% | 3,728 | 12.5% |
[ 17.0% - 17.5% ] 17.20% | 2,902 | 4.3% |
[ 17.5% - 18.0% ] 17.68% | 9,444 | 1.2% |
[ 18.0% - 18.5% ] 18.20% | 5,856 | 4.1% |
[ 18.5% - 19.0% ] 18.74% | 7,101 | 2.8% |
[ 19.0% - 19.5% ] 19.27% | 3,144 | 5.7% |
[ 19.5% - 20.0% ] 19.77% | 7,101 | 3.6% |
[ 20.0% - 20.5% ] 20.12% | 1,983 | 3.7% |
[ 20.5% - 21.0% ] 20.73% | 4,699 | 1.8% |
[ 21.0% - 21.5% ] 21.28% | 733 | 3.0% |
[ 21.5% - 22.0% ] 21.86% | 247 | 10.6% |
[ 22.0% - 22.5% ] 22.32% | 466 | 7.1% |
[ 22.5% - 23.0% ] 22.67% | 2,025 | 6.7% |
[ 23.0% - 23.5% ] 23.02% | 443 | 0.29% |
[ 23.5% - 24.0% ] 23.87% | 2,032 | 4.7% |
[ 24.0% - 24.5% ] 24.31% | 144 | 2.8% |
[ 24.5% - 25.0% ] 24.79% | 363 | 10.2% |
[ 25.0% - 25.5% ] 25.36% | 1,029 | 12.5% |
[ 25.5% - 26.0% ] 25.68% | 1,515 | 7.7% |
[ 26.0% - 26.5% ] 26.15% | 631 | 1.3% |
[ 26.5% - 27.0% ] 26.69% | 2,008 | 7.2% |
[ 27.0% - 27.5% ] 27.06% | 85 | 2.4% |
[ 28.5% - 29.0% ] 28.59% | 808 | 1.4% |
[ 29.0% - 29.5% ] 29.23% | 65 | 15.4% |
[ 31.0% - 31.5% ] 31.30% | 1,281 | 4.9% |
[ 31.5% - 32.0% ] 31.62% | 1,518 | 2.6% |
[ 32.0% - 32.5% ] 32.38% | 349 | 25.2% |
[ 33.0% - 33.5% ] 33.33% | 30 | 36.7% |
[ 34.0% - 34.5% ] 34.06% | 323 | 16.7% |
[ 34.5% - 35.0% ] 34.90% | 616 | 7.1% |
[ 35.5% - 36.0% ] 35.80% | 176 | 12.7% |
[ 37.5% - 38.0% ] 37.66% | 154 | 10.4% |
[ 38.0% - 38.5% ] 38.14% | 388 | 5.6% |
[ 38.5% - 39.0% ] 38.61% | 101 | 3.2% |
[ 41.0% - 41.5% ] 41.01% | 278 | 3.8% |
[ 42.0% - 42.5% ] 42.50% | 80 | 42.5% |
[ 42.5% - 43.0% ] 42.77% | 318 | 5.0% |
[ 44.0% - 44.5% ] 44.07% | 59 | 3.4% |
[ 48.0% - 48.5% ] 48.15% | 27 | 48.1% |
[ 48.5% - 49.0% ] 48.96% | 96 | 49.0% |
[ 50.0% - 50.5% ] 50.00% | 32 | 46.9% |
[ 51.0% - 51.5% ] 51.38% | 654 | 2.1% |
[ 51.5% - 52.0% ] 51.79% | 112 | 10.8% |
[ 53.5% - 54.0% ] 53.85% | 39 | 53.8% |
[ 55.0% - 55.5% ] 55.15% | 136 | 12.5% |
[ 57.0% - 57.5% ] 57.40% | 331 | 14.2% |