Apache Self-Care Disability
COMPARE
Apache
Select to Compare
Self-Care Disability
Apache Self-Care Disability
2.7%
SELF-CARE DISABILITY
0.0/ 100
METRIC RATING
282nd/ 347
METRIC RANK
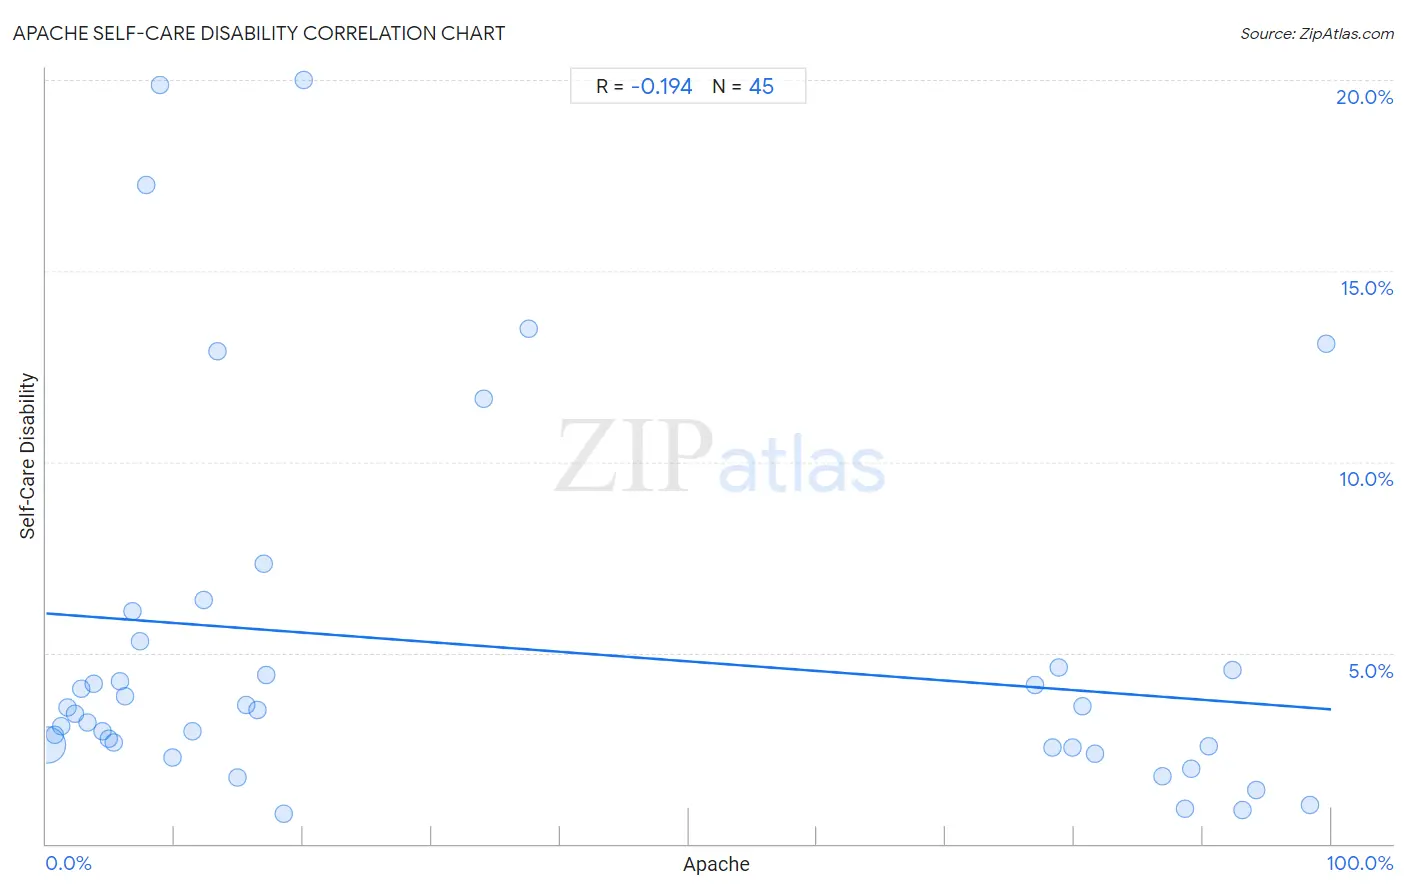
Apache Self-Care Disability Correlation Chart
The statistical analysis conducted on geographies consisting of 230,868,082 people shows a poor negative correlation between the proportion of Apache and percentage of population with self-care disability in the United States with a correlation coefficient (R) of -0.194 and weighted average of 2.7%. On average, for every 1% (one percent) increase in Apache within a typical geography, there is a decrease of 0.025% in percentage of population with self-care disability.
It is essential to understand that the correlation between the percentage of Apache and percentage of population with self-care disability does not imply a direct cause-and-effect relationship. It remains uncertain whether the presence of Apache influences an upward or downward trend in the level of percentage of population with self-care disability within an area, or if Apache simply ended up residing in those areas with higher or lower levels of percentage of population with self-care disability due to other factors.
Demographics Similar to Apache by Self-Care Disability
In terms of self-care disability, the demographic groups most similar to Apache are Immigrants from Iraq (2.7%, a difference of 0.020%), Delaware (2.7%, a difference of 0.070%), Fijian (2.7%, a difference of 0.12%), Jamaican (2.7%, a difference of 0.16%), and Hispanic or Latino (2.7%, a difference of 0.17%).
| Demographics | Rating | Rank | Self-Care Disability |
| Immigrants from Trinidad and Tobago | 0.1 /100 | #275 | Tragic 2.7% |
| Japanese | 0.1 /100 | #276 | Tragic 2.7% |
| Immigrants from Ukraine | 0.1 /100 | #277 | Tragic 2.7% |
| Ottawa | 0.1 /100 | #278 | Tragic 2.7% |
| Iroquois | 0.1 /100 | #279 | Tragic 2.7% |
| Hispanics or Latinos | 0.1 /100 | #280 | Tragic 2.7% |
| Immigrants from Iraq | 0.0 /100 | #281 | Tragic 2.7% |
| Apache | 0.0 /100 | #282 | Tragic 2.7% |
| Delaware | 0.0 /100 | #283 | Tragic 2.7% |
| Fijians | 0.0 /100 | #284 | Tragic 2.7% |
| Jamaicans | 0.0 /100 | #285 | Tragic 2.7% |
| French American Indians | 0.0 /100 | #286 | Tragic 2.7% |
| Immigrants from Jamaica | 0.0 /100 | #287 | Tragic 2.7% |
| Immigrants from Barbados | 0.0 /100 | #288 | Tragic 2.7% |
| Africans | 0.0 /100 | #289 | Tragic 2.7% |
Apache Self-Care Disability Correlation Summary
| Measurement | Apache Data | Self-Care Disability Data |
| Minimum | 0.085% | 0.78% |
| Maximum | 99.6% | 20.0% |
| Range | 99.5% | 19.2% |
| Mean | 36.0% | 5.1% |
| Median | 15.6% | 3.5% |
| Interquartile 25% (IQ1) | 5.5% | 2.5% |
| Interquartile 75% (IQ3) | 80.3% | 5.0% |
| Interquartile Range (IQR) | 74.8% | 2.4% |
| Standard Deviation (Sample) | 37.6% | 4.9% |
| Standard Deviation (Population) | 37.2% | 4.8% |
Correlation Details
| Apache Percentile | Sample Size | Self-Care Disability |
[ 0.0% - 0.5% ] 0.085% | 224,465,056 | 2.6% |
[ 0.5% - 1.0% ] 0.67% | 4,721,709 | 2.9% |
[ 1.0% - 1.5% ] 1.20% | 897,005 | 3.1% |
[ 1.5% - 2.0% ] 1.68% | 314,224 | 3.6% |
[ 2.0% - 2.5% ] 2.24% | 176,650 | 3.4% |
[ 2.5% - 3.0% ] 2.69% | 54,987 | 4.1% |
[ 3.0% - 3.5% ] 3.21% | 33,903 | 3.2% |
[ 3.5% - 4.0% ] 3.73% | 12,042 | 4.2% |
[ 4.0% - 4.5% ] 4.34% | 41,709 | 2.9% |
[ 4.5% - 5.0% ] 4.83% | 27,202 | 2.7% |
[ 5.0% - 5.5% ] 5.26% | 33,104 | 2.7% |
[ 5.5% - 6.0% ] 5.72% | 11,702 | 4.3% |
[ 6.0% - 6.5% ] 6.17% | 2,252 | 3.9% |
[ 6.5% - 7.0% ] 6.74% | 282 | 6.1% |
[ 7.0% - 7.5% ] 7.30% | 1,356 | 5.3% |
[ 7.5% - 8.0% ] 7.79% | 1,027 | 17.2% |
[ 8.5% - 9.0% ] 8.84% | 848 | 19.9% |
[ 9.5% - 10.0% ] 9.80% | 8,287 | 2.3% |
[ 11.0% - 11.5% ] 11.35% | 414 | 3.0% |
[ 12.0% - 12.5% ] 12.28% | 5,911 | 6.4% |
[ 13.0% - 13.5% ] 13.33% | 225 | 12.9% |
[ 14.5% - 15.0% ] 14.90% | 2,563 | 1.7% |
[ 15.5% - 16.0% ] 15.58% | 937 | 3.6% |
[ 16.0% - 16.5% ] 16.44% | 1,928 | 3.5% |
[ 16.5% - 17.0% ] 16.97% | 442 | 7.3% |
[ 17.0% - 17.5% ] 17.16% | 169 | 4.4% |
[ 18.0% - 18.5% ] 18.45% | 618 | 0.78% |
[ 20.0% - 20.5% ] 20.00% | 10 | 20.0% |
[ 34.0% - 34.5% ] 34.01% | 147 | 11.7% |
[ 37.5% - 38.0% ] 37.59% | 133 | 13.5% |
[ 76.5% - 77.0% ] 76.94% | 2,650 | 4.1% |
[ 78.0% - 78.5% ] 78.32% | 7,067 | 2.5% |
[ 78.5% - 79.0% ] 78.81% | 2,261 | 4.6% |
[ 79.5% - 80.0% ] 79.86% | 4,405 | 2.5% |
[ 80.5% - 81.0% ] 80.68% | 4,860 | 3.6% |
[ 81.5% - 82.0% ] 81.63% | 980 | 2.4% |
[ 86.5% - 87.0% ] 86.87% | 11,840 | 1.8% |
[ 88.5% - 89.0% ] 88.65% | 3,049 | 0.92% |
[ 89.0% - 89.5% ] 89.14% | 1,621 | 2.0% |
[ 90.0% - 90.5% ] 90.48% | 4,284 | 2.5% |
[ 92.0% - 92.5% ] 92.27% | 2,925 | 4.6% |
[ 93.0% - 93.5% ] 93.13% | 1,777 | 0.87% |
[ 94.0% - 94.5% ] 94.20% | 1,465 | 1.4% |
[ 98.0% - 98.5% ] 98.39% | 1,552 | 1.00% |
[ 99.5% - 100.0% ] 99.60% | 504 | 13.1% |