Union Center, WI Map & Demographics
Union Center Map
Union Center Overview
$35,500
PER CAPITA INCOME
$80,833
AVG FAMILY INCOME
$70,833
AVG HOUSEHOLD INCOME
25.9%
WAGE / INCOME GAP [ % ]
74.1¢/ $1
WAGE / INCOME GAP [ $ ]
0.32
INEQUALITY / GINI INDEX
212
TOTAL POPULATION
94
MALE POPULATION
118
FEMALE POPULATION
79.66
MALES / 100 FEMALES
125.53
FEMALES / 100 MALES
40.1
MEDIAN AGE
2.9
AVG FAMILY SIZE
2.3
AVG HOUSEHOLD SIZE
123
LABOR FORCE [ PEOPLE ]
78.3%
PERCENT IN LABOR FORCE
Union Center Zip Codes
Union Center Area Codes
Income in Union Center
Income Overview in Union Center
Per Capita Income in Union Center is $35,500, while median incomes of families and households are $80,833 and $70,833 respectively.
| Characteristic | Number | Measure |
| Per Capita Income | 212 | $35,500 |
| Median Family Income | 54 | $80,833 |
| Mean Family Income | 54 | $82,104 |
| Median Household Income | 94 | $70,833 |
| Mean Household Income | 94 | $73,963 |
| Income Deficit | 54 | $0 |
| Wage / Income Gap (%) | 212 | 25.86% |
| Wage / Income Gap ($) | 212 | 74.14¢ per $1 |
| Gini / Inequality Index | 212 | 0.32 |
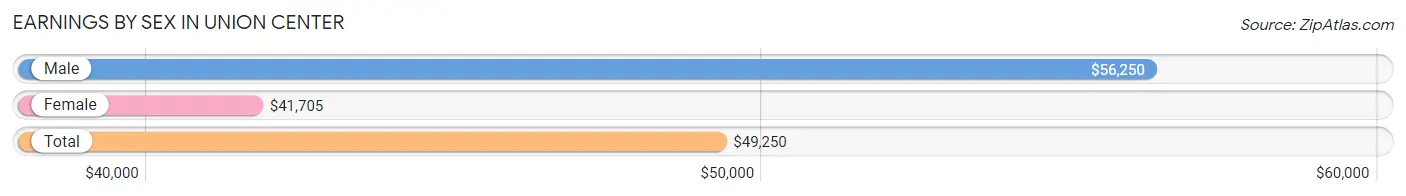
Earnings by Sex in Union Center
Average Earnings in Union Center are $49,250, $56,250 for men and $41,705 for women, a difference of 25.9%.
| Sex | Number | Average Earnings |
| Male | 70 (56.0%) | $56,250 |
| Female | 55 (44.0%) | $41,705 |
| Total | 125 (100.0%) | $49,250 |
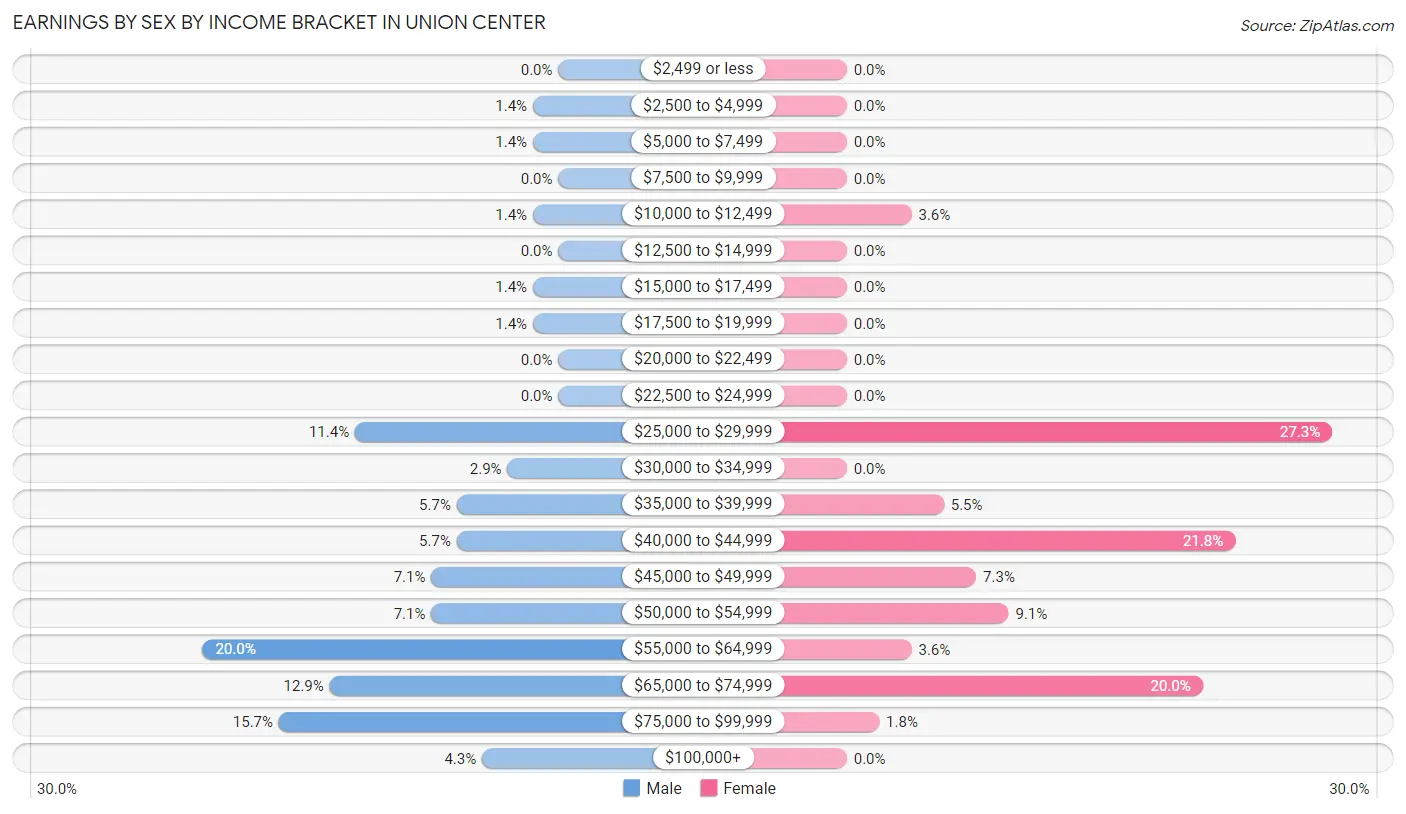
Earnings by Sex by Income Bracket in Union Center
The most common earnings brackets in Union Center are $55,000 to $64,999 for men (14 | 20.0%) and $25,000 to $29,999 for women (15 | 27.3%).
| Income | Male | Female |
| $2,499 or less | 0 (0.0%) | 0 (0.0%) |
| $2,500 to $4,999 | 1 (1.4%) | 0 (0.0%) |
| $5,000 to $7,499 | 1 (1.4%) | 0 (0.0%) |
| $7,500 to $9,999 | 0 (0.0%) | 0 (0.0%) |
| $10,000 to $12,499 | 1 (1.4%) | 2 (3.6%) |
| $12,500 to $14,999 | 0 (0.0%) | 0 (0.0%) |
| $15,000 to $17,499 | 1 (1.4%) | 0 (0.0%) |
| $17,500 to $19,999 | 1 (1.4%) | 0 (0.0%) |
| $20,000 to $22,499 | 0 (0.0%) | 0 (0.0%) |
| $22,500 to $24,999 | 0 (0.0%) | 0 (0.0%) |
| $25,000 to $29,999 | 8 (11.4%) | 15 (27.3%) |
| $30,000 to $34,999 | 2 (2.9%) | 0 (0.0%) |
| $35,000 to $39,999 | 4 (5.7%) | 3 (5.4%) |
| $40,000 to $44,999 | 4 (5.7%) | 12 (21.8%) |
| $45,000 to $49,999 | 5 (7.1%) | 4 (7.3%) |
| $50,000 to $54,999 | 5 (7.1%) | 5 (9.1%) |
| $55,000 to $64,999 | 14 (20.0%) | 2 (3.6%) |
| $65,000 to $74,999 | 9 (12.9%) | 11 (20.0%) |
| $75,000 to $99,999 | 11 (15.7%) | 1 (1.8%) |
| $100,000+ | 3 (4.3%) | 0 (0.0%) |
| Total | 70 (100.0%) | 55 (100.0%) |
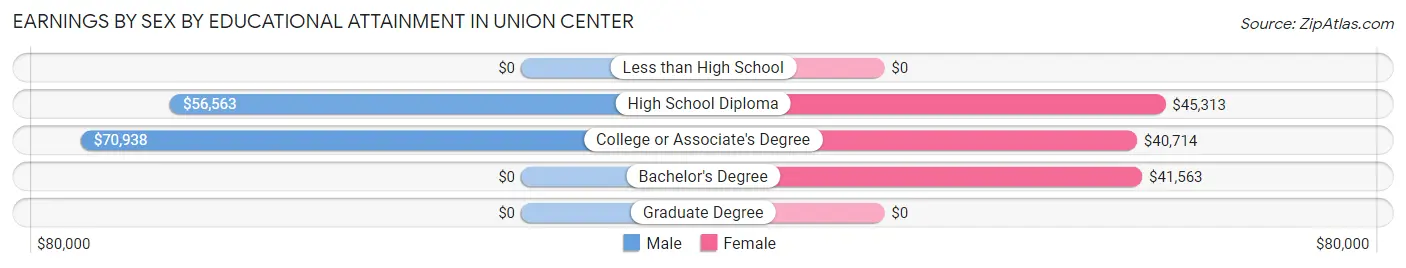
Earnings by Sex by Educational Attainment in Union Center
Average earnings in Union Center are $61,500 for men and $42,273 for women, a difference of 31.3%. Men with an educational attainment of college or associate's degree enjoy the highest average annual earnings of $70,938, while those with high school diploma education earn the least with $56,563. Women with an educational attainment of high school diploma earn the most with the average annual earnings of $45,313, while those with college or associate's degree education have the smallest earnings of $40,714.
| Educational Attainment | Male Income | Female Income |
| Less than High School | - | - |
| High School Diploma | $56,563 | $45,313 |
| College or Associate's Degree | $70,938 | $40,714 |
| Bachelor's Degree | - | - |
| Graduate Degree | - | - |
| Total | $61,500 | $42,273 |
Family Income in Union Center
Family Income Brackets in Union Center
According to the Union Center family income data, there are 17 families falling into the $75,000 to $99,999 income range, which is the most common income bracket and makes up 31.5% of all families.
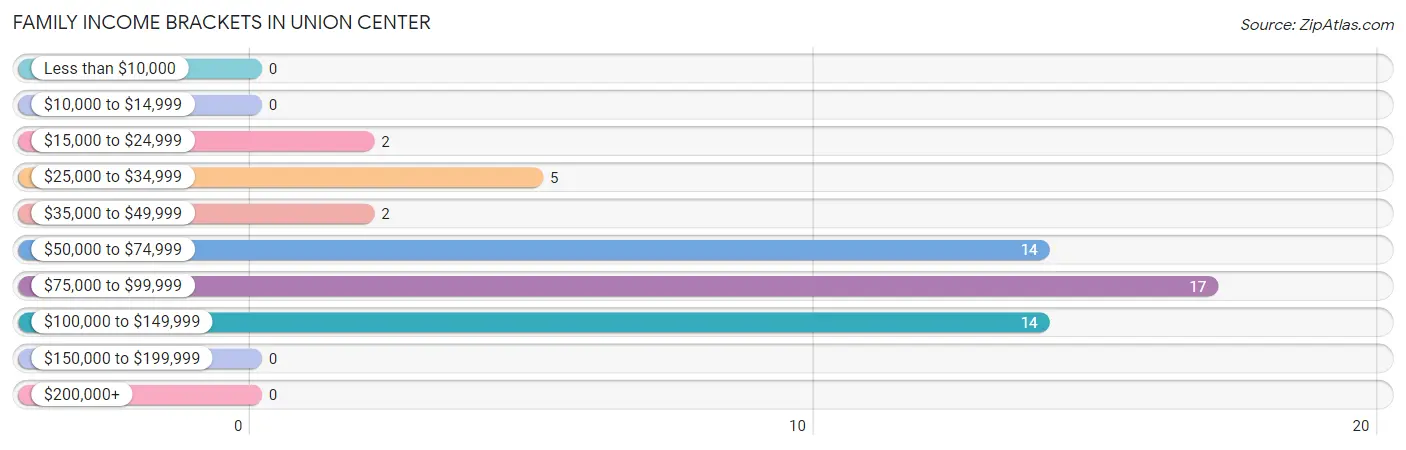
| Income Bracket | # Families | % Families |
| Less than $10,000 | 0 | 0.0% |
| $10,000 to $14,999 | 0 | 0.0% |
| $15,000 to $24,999 | 2 | 3.7% |
| $25,000 to $34,999 | 5 | 9.3% |
| $35,000 to $49,999 | 2 | 3.7% |
| $50,000 to $74,999 | 14 | 25.9% |
| $75,000 to $99,999 | 17 | 31.5% |
| $100,000 to $149,999 | 14 | 25.9% |
| $150,000 to $199,999 | 0 | 0.0% |
| $200,000+ | 0 | 0.0% |
Family Income by Famaliy Size in Union Center
5-person families (4 | 7.4%) account for the highest median family income in Union Center with $113,750 per family, while 2-person families (29 | 53.7%) have the highest median income of $39,375 per family member.
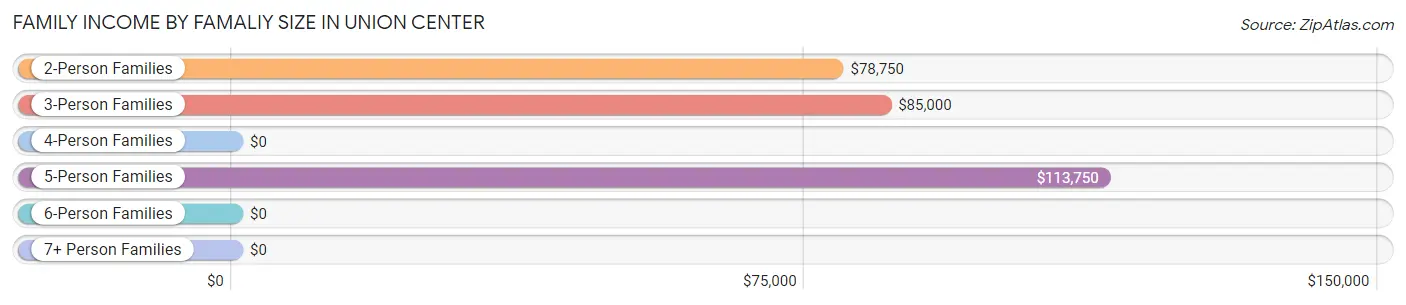
| Income Bracket | # Families | Median Income |
| 2-Person Families | 29 (53.7%) | $78,750 |
| 3-Person Families | 14 (25.9%) | $85,000 |
| 4-Person Families | 7 (13.0%) | $0 |
| 5-Person Families | 4 (7.4%) | $113,750 |
| 6-Person Families | 0 (0.0%) | $0 |
| 7+ Person Families | 0 (0.0%) | $0 |
| Total | 54 (100.0%) | $80,833 |
Family Income by Number of Earners in Union Center
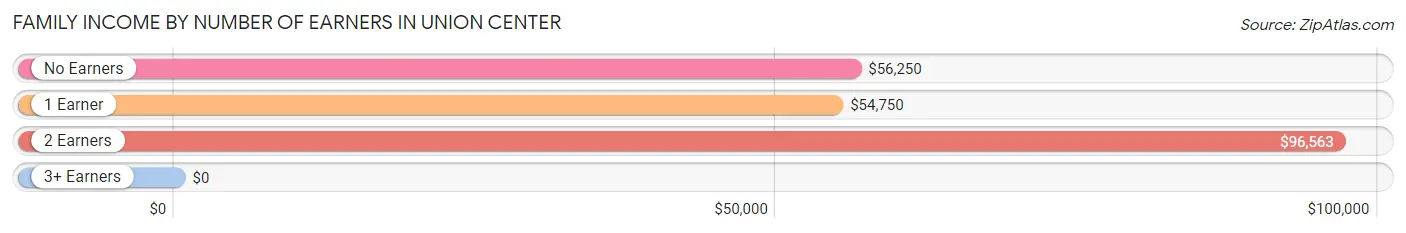
| Number of Earners | # Families | Median Income |
| No Earners | 5 (9.3%) | $56,250 |
| 1 Earner | 19 (35.2%) | $54,750 |
| 2 Earners | 29 (53.7%) | $96,563 |
| 3+ Earners | 1 (1.8%) | $0 |
| Total | 54 (100.0%) | $80,833 |
Household Income in Union Center
Household Income Brackets in Union Center
With 31 households falling in the category, the $50,000 to $74,999 income range is the most frequent in Union Center, accounting for 33.0% of all households.
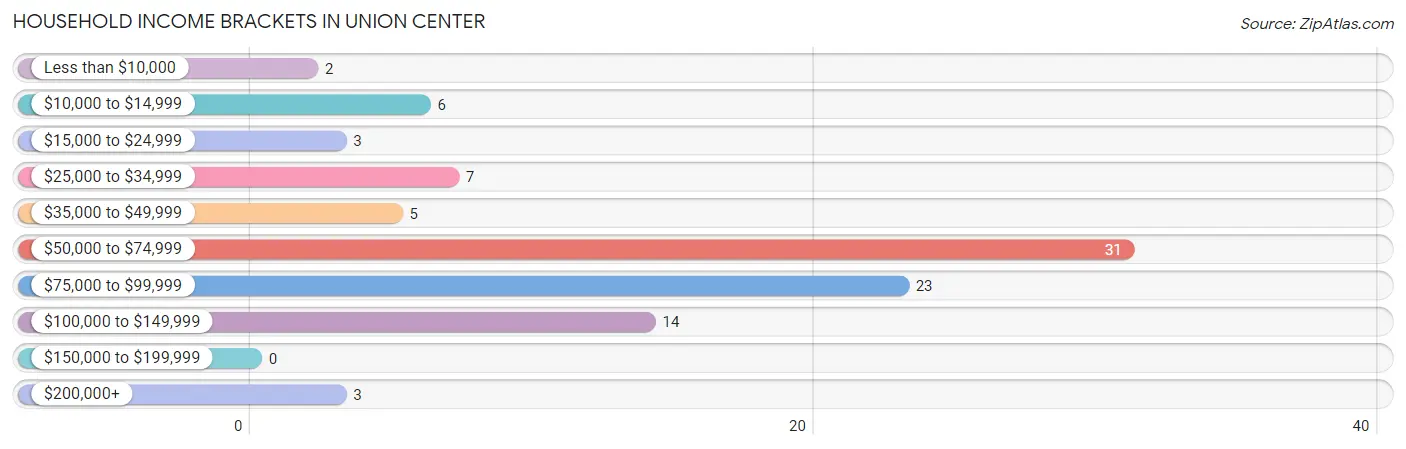
| Income Bracket | # Households | % Households |
| Less than $10,000 | 2 | 2.1% |
| $10,000 to $14,999 | 6 | 6.4% |
| $15,000 to $24,999 | 3 | 3.2% |
| $25,000 to $34,999 | 7 | 7.4% |
| $35,000 to $49,999 | 5 | 5.3% |
| $50,000 to $74,999 | 31 | 33.0% |
| $75,000 to $99,999 | 23 | 24.5% |
| $100,000 to $149,999 | 14 | 14.9% |
| $150,000 to $199,999 | 0 | 0.0% |
| $200,000+ | 3 | 3.2% |
Household Income by Householder Age in Union Center
The median household income in Union Center is $70,833, with the highest median household income of $78,750 found in the 25 to 44 years age bracket for the primary householder. A total of 31 households (33.0%) fall into this category. Meanwhile, the 15 to 24 years age bracket for the primary householder has the lowest median household income of $0, with 5 households (5.3%) in this group.
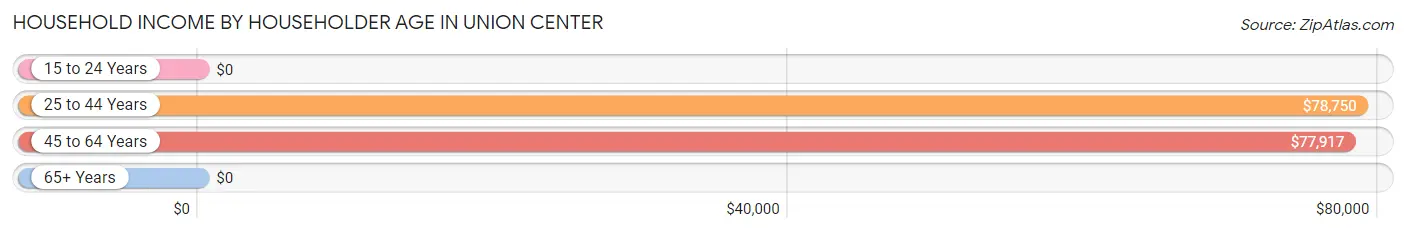
| Income Bracket | # Households | Median Income |
| 15 to 24 Years | 5 (5.3%) | $0 |
| 25 to 44 Years | 31 (33.0%) | $78,750 |
| 45 to 64 Years | 43 (45.7%) | $77,917 |
| 65+ Years | 15 (16.0%) | $0 |
| Total | 94 (100.0%) | $70,833 |
Poverty in Union Center
Income Below Poverty by Sex and Age in Union Center
With 1.1% poverty level for males and 7.8% for females among the residents of Union Center, 45 to 54 year old males and 45 to 54 year old females are the most vulnerable to poverty, with 1 males (6.7%) and 2 females (66.7%) in their respective age groups living below the poverty level.
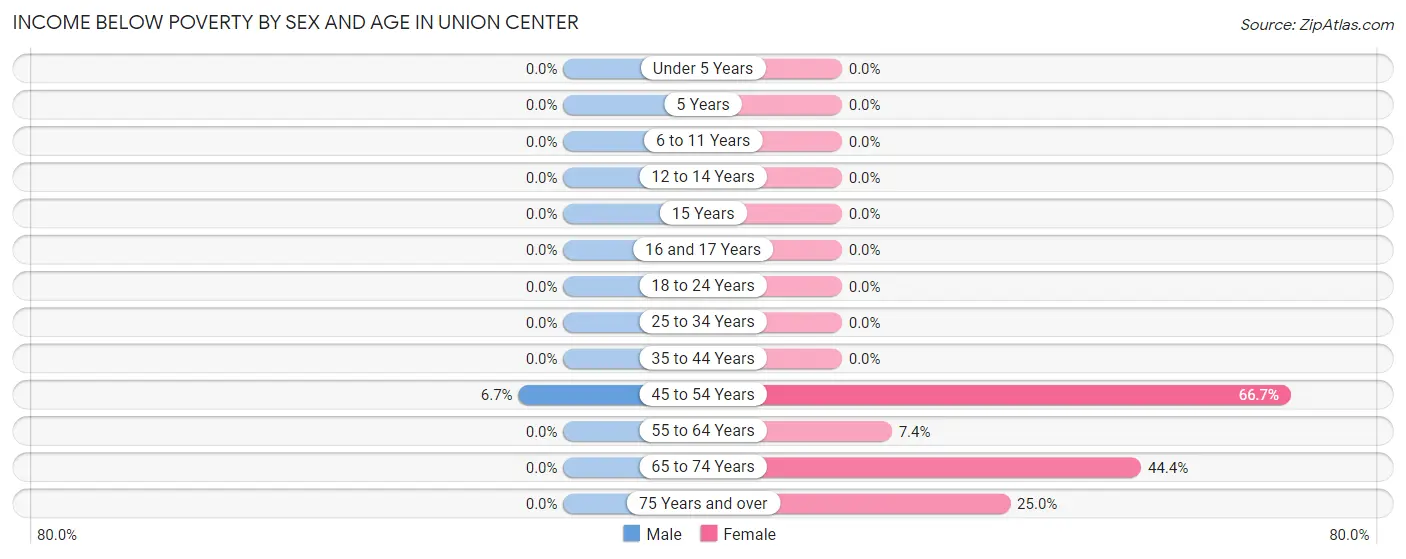
| Age Bracket | Male | Female |
| Under 5 Years | 0 (0.0%) | 0 (0.0%) |
| 5 Years | 0 (0.0%) | 0 (0.0%) |
| 6 to 11 Years | 0 (0.0%) | 0 (0.0%) |
| 12 to 14 Years | 0 (0.0%) | 0 (0.0%) |
| 15 Years | 0 (0.0%) | 0 (0.0%) |
| 16 and 17 Years | 0 (0.0%) | 0 (0.0%) |
| 18 to 24 Years | 0 (0.0%) | 0 (0.0%) |
| 25 to 34 Years | 0 (0.0%) | 0 (0.0%) |
| 35 to 44 Years | 0 (0.0%) | 0 (0.0%) |
| 45 to 54 Years | 1 (6.7%) | 2 (66.7%) |
| 55 to 64 Years | 0 (0.0%) | 2 (7.4%) |
| 65 to 74 Years | 0 (0.0%) | 4 (44.4%) |
| 75 Years and over | 0 (0.0%) | 1 (25.0%) |
| Total | 1 (1.1%) | 9 (7.8%) |
Income Above Poverty by Sex and Age in Union Center
According to the poverty statistics in Union Center, males aged 5 years and females aged under 5 years are the age groups that are most secure financially, with 100.0% of males and 100.0% of females in these age groups living above the poverty line.
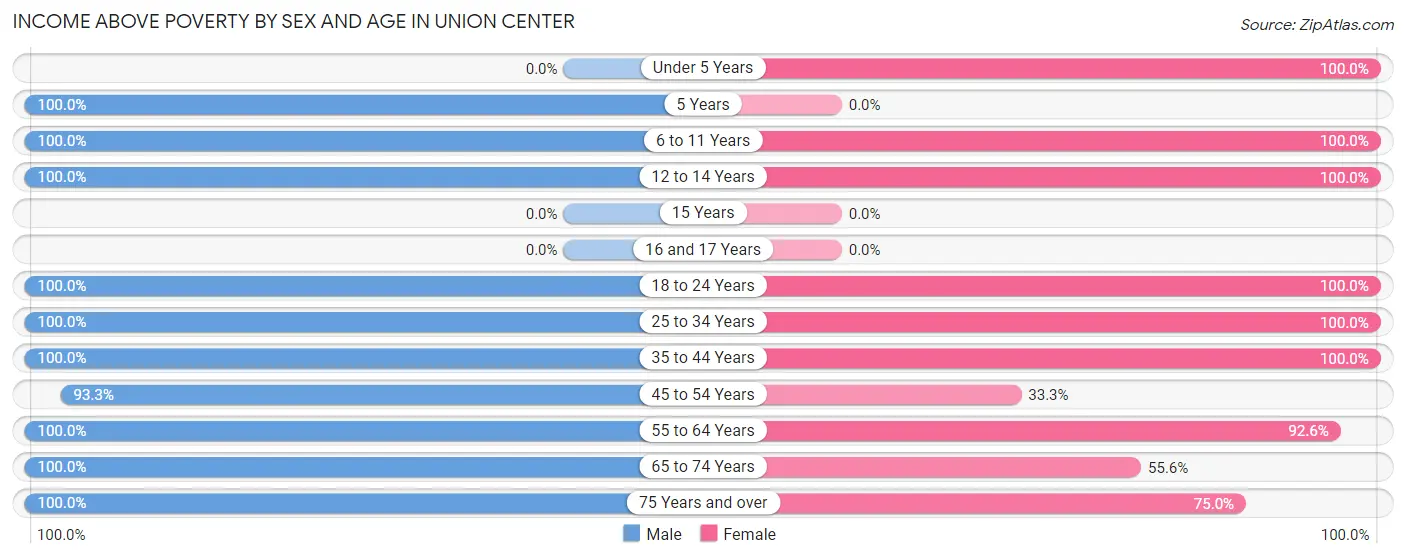
| Age Bracket | Male | Female |
| Under 5 Years | 0 (0.0%) | 28 (100.0%) |
| 5 Years | 2 (100.0%) | 0 (0.0%) |
| 6 to 11 Years | 9 (100.0%) | 2 (100.0%) |
| 12 to 14 Years | 2 (100.0%) | 10 (100.0%) |
| 15 Years | 0 (0.0%) | 0 (0.0%) |
| 16 and 17 Years | 0 (0.0%) | 0 (0.0%) |
| 18 to 24 Years | 10 (100.0%) | 5 (100.0%) |
| 25 to 34 Years | 8 (100.0%) | 14 (100.0%) |
| 35 to 44 Years | 15 (100.0%) | 14 (100.0%) |
| 45 to 54 Years | 14 (93.3%) | 1 (33.3%) |
| 55 to 64 Years | 15 (100.0%) | 25 (92.6%) |
| 65 to 74 Years | 14 (100.0%) | 5 (55.6%) |
| 75 Years and over | 4 (100.0%) | 3 (75.0%) |
| Total | 93 (98.9%) | 107 (92.2%) |
Income Below Poverty Among Married-Couple Families in Union Center
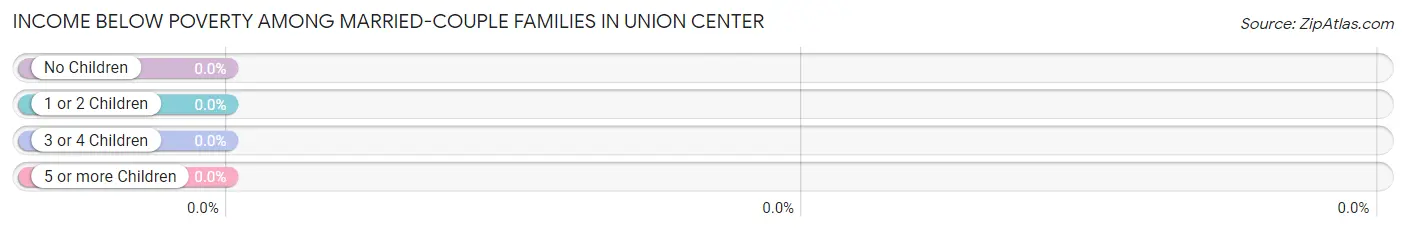
| Children | Above Poverty | Below Poverty |
| No Children | 22 (100.0%) | 0 (0.0%) |
| 1 or 2 Children | 13 (100.0%) | 0 (0.0%) |
| 3 or 4 Children | 2 (100.0%) | 0 (0.0%) |
| 5 or more Children | 0 (0.0%) | 0 (0.0%) |
| Total | 37 (100.0%) | 0 (0.0%) |
Income Below Poverty Among Single-Parent Households in Union Center
| Children | Single Father | Single Mother |
| No Children | 0 (0.0%) | 0 (0.0%) |
| 1 or 2 Children | 0 (0.0%) | 0 (0.0%) |
| 3 or 4 Children | 0 (0.0%) | 0 (0.0%) |
| 5 or more Children | 0 (0.0%) | 0 (0.0%) |
| Total | 0 (0.0%) | 0 (0.0%) |
Income Below Poverty Among Married-Couple vs Single-Parent Households in Union Center
| Children | Married-Couple Families | Single-Parent Households |
| No Children | 0 (0.0%) | 0 (0.0%) |
| 1 or 2 Children | 0 (0.0%) | 0 (0.0%) |
| 3 or 4 Children | 0 (0.0%) | 0 (0.0%) |
| 5 or more Children | 0 (0.0%) | 0 (0.0%) |
| Total | 0 (0.0%) | 0 (0.0%) |
Race in Union Center
The most populous races in Union Center are White / Caucasian (192 | 90.6%), Two or more Races (17 | 8.0%), and Native / Alaskan (2 | 0.9%).
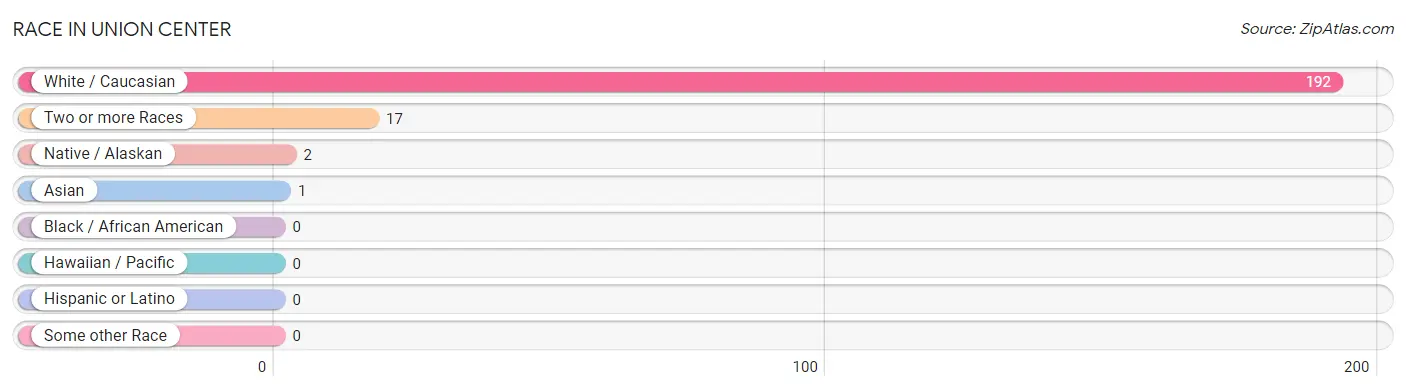
| Race | # Population | % Population |
| Asian | 1 | 0.5% |
| Black / African American | 0 | 0.0% |
| Hawaiian / Pacific | 0 | 0.0% |
| Hispanic or Latino | 0 | 0.0% |
| Native / Alaskan | 2 | 0.9% |
| White / Caucasian | 192 | 90.6% |
| Two or more Races | 17 | 8.0% |
| Some other Race | 0 | 0.0% |
| Total | 212 | 100.0% |
Ancestry in Union Center
The most populous ancestries reported in Union Center are German (80 | 37.7%), Irish (38 | 17.9%), English (28 | 13.2%), Czech (21 | 9.9%), and Norwegian (14 | 6.6%), together accounting for 85.4% of all Union Center residents.
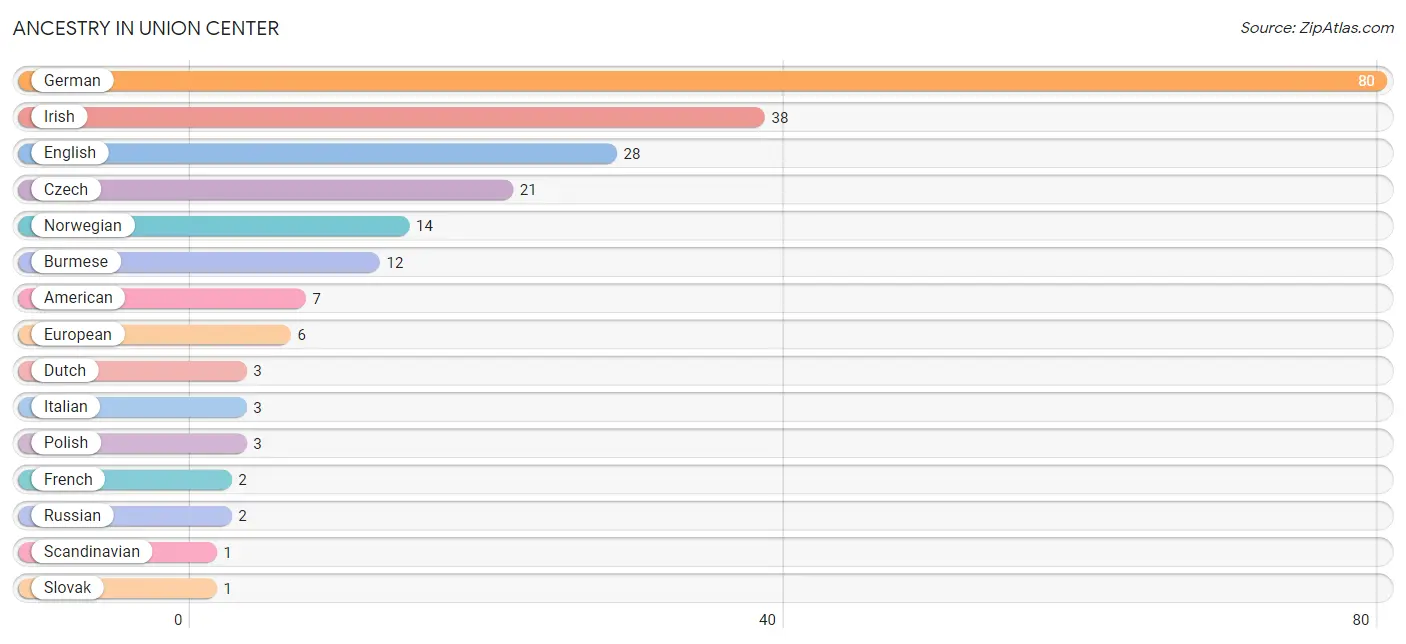
| Ancestry | # Population | % Population |
| American | 7 | 3.3% |
| Burmese | 12 | 5.7% |
| Czech | 21 | 9.9% |
| Dutch | 3 | 1.4% |
| English | 28 | 13.2% |
| European | 6 | 2.8% |
| French | 2 | 0.9% |
| German | 80 | 37.7% |
| Irish | 38 | 17.9% |
| Italian | 3 | 1.4% |
| Norwegian | 14 | 6.6% |
| Polish | 3 | 1.4% |
| Russian | 2 | 0.9% |
| Scandinavian | 1 | 0.5% |
| Slovak | 1 | 0.5% | View All 15 Rows |
Immigrants in Union Center
The most numerous immigrant groups reported in Union Center came from Eastern Europe (2 | 0.9%), Europe (2 | 0.9%), Poland (2 | 0.9%), Asia (1 | 0.5%), and Eastern Asia (1 | 0.5%), together accounting for 3.8% of all Union Center residents.
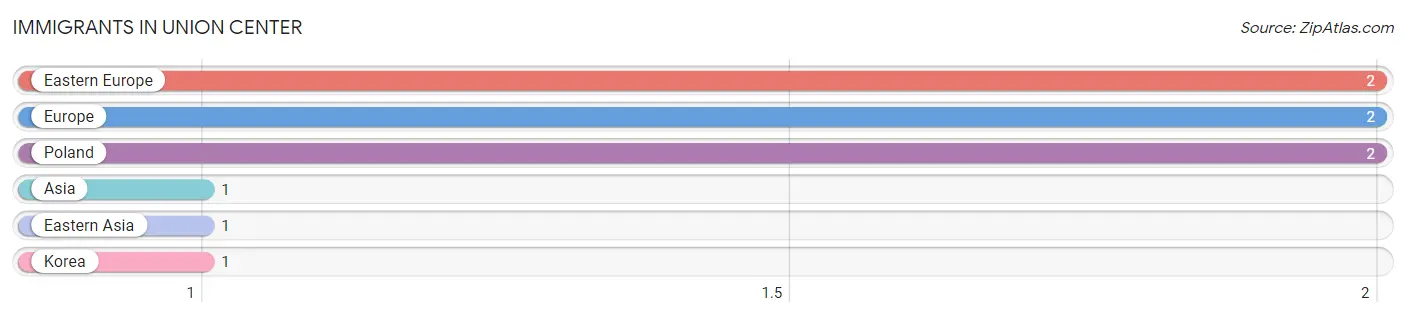
| Immigration Origin | # Population | % Population |
| Asia | 1 | 0.5% |
| Eastern Asia | 1 | 0.5% |
| Eastern Europe | 2 | 0.9% |
| Europe | 2 | 0.9% |
| Korea | 1 | 0.5% |
| Poland | 2 | 0.9% | View All 6 Rows |
Sex and Age in Union Center
Sex and Age in Union Center
The most populous age groups in Union Center are 35 to 39 Years (12 | 12.8%) for men and Under 5 Years (28 | 23.7%) for women.
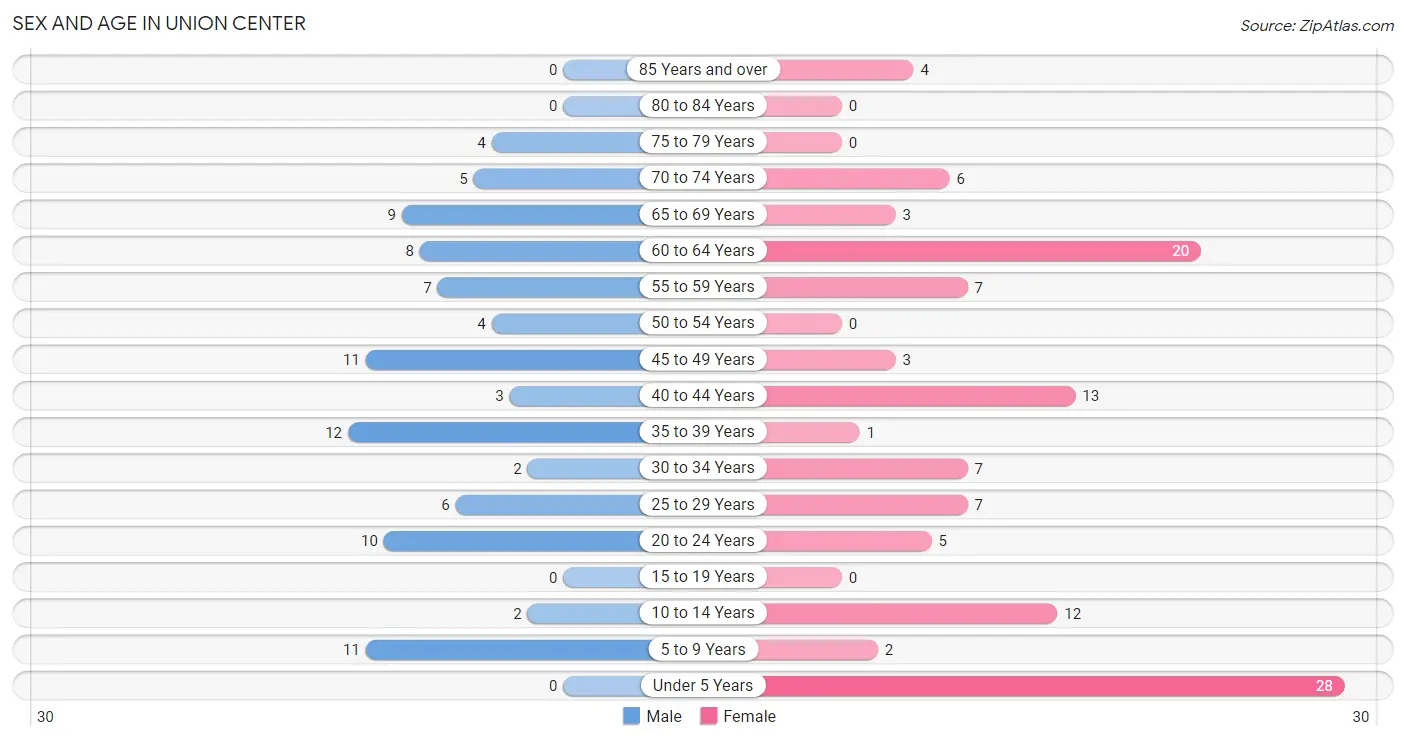
| Age Bracket | Male | Female |
| Under 5 Years | 0 (0.0%) | 28 (23.7%) |
| 5 to 9 Years | 11 (11.7%) | 2 (1.7%) |
| 10 to 14 Years | 2 (2.1%) | 12 (10.2%) |
| 15 to 19 Years | 0 (0.0%) | 0 (0.0%) |
| 20 to 24 Years | 10 (10.6%) | 5 (4.2%) |
| 25 to 29 Years | 6 (6.4%) | 7 (5.9%) |
| 30 to 34 Years | 2 (2.1%) | 7 (5.9%) |
| 35 to 39 Years | 12 (12.8%) | 1 (0.9%) |
| 40 to 44 Years | 3 (3.2%) | 13 (11.0%) |
| 45 to 49 Years | 11 (11.7%) | 3 (2.5%) |
| 50 to 54 Years | 4 (4.3%) | 0 (0.0%) |
| 55 to 59 Years | 7 (7.4%) | 7 (5.9%) |
| 60 to 64 Years | 8 (8.5%) | 20 (17.0%) |
| 65 to 69 Years | 9 (9.6%) | 3 (2.5%) |
| 70 to 74 Years | 5 (5.3%) | 6 (5.1%) |
| 75 to 79 Years | 4 (4.3%) | 0 (0.0%) |
| 80 to 84 Years | 0 (0.0%) | 0 (0.0%) |
| 85 Years and over | 0 (0.0%) | 4 (3.4%) |
| Total | 94 (100.0%) | 118 (100.0%) |
Families and Households in Union Center
Median Family Size in Union Center
The median family size in Union Center is 2.93 persons per family, with single female/mother families (13 | 24.1%) accounting for the largest median family size of 3.23 persons per family. On the other hand, single male/father families (4 | 7.4%) represent the smallest median family size with 1.75 persons per family.
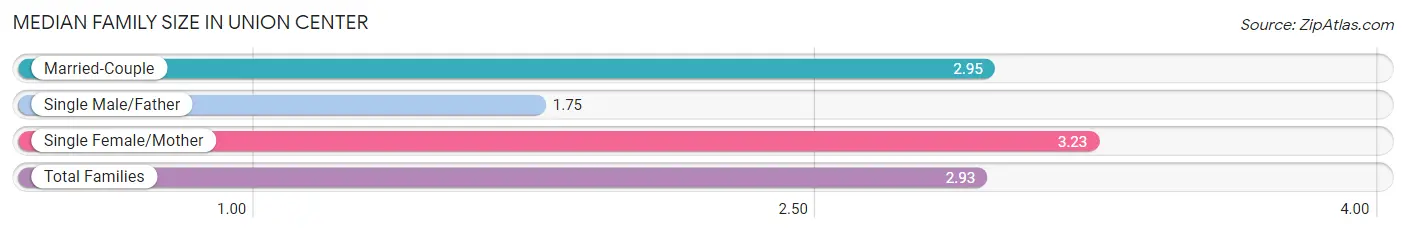
| Family Type | # Families | Family Size |
| Married-Couple | 37 (68.5%) | 2.95 |
| Single Male/Father | 4 (7.4%) | 1.75 |
| Single Female/Mother | 13 (24.1%) | 3.23 |
| Total Families | 54 (100.0%) | 2.93 |
Median Household Size in Union Center
The median household size in Union Center is 2.26 persons per household, with single female/mother households (13 | 13.8%) accounting for the largest median household size of 3.85 persons per household. non-family households (40 | 42.5%) represent the smallest median household size with 1.15 persons per household.
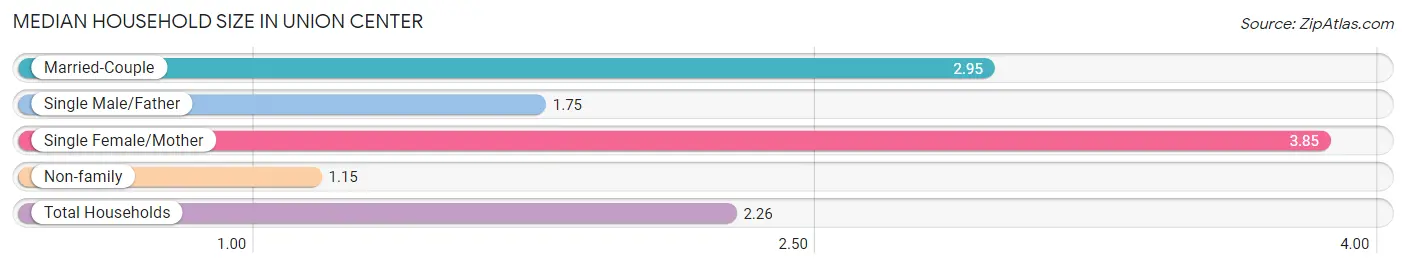
| Household Type | # Households | Household Size |
| Married-Couple | 37 (39.4%) | 2.95 |
| Single Male/Father | 4 (4.3%) | 1.75 |
| Single Female/Mother | 13 (13.8%) | 3.85 |
| Non-family | 40 (42.5%) | 1.15 |
| Total Households | 94 (100.0%) | 2.26 |
Household Size by Marriage Status in Union Center
Out of a total of 94 households in Union Center, 54 (57.5%) are family households, while 40 (42.5%) are nonfamily households. The most numerous type of family households are 2-person households, comprising 29, and the most common type of nonfamily households are 1-person households, comprising 35.
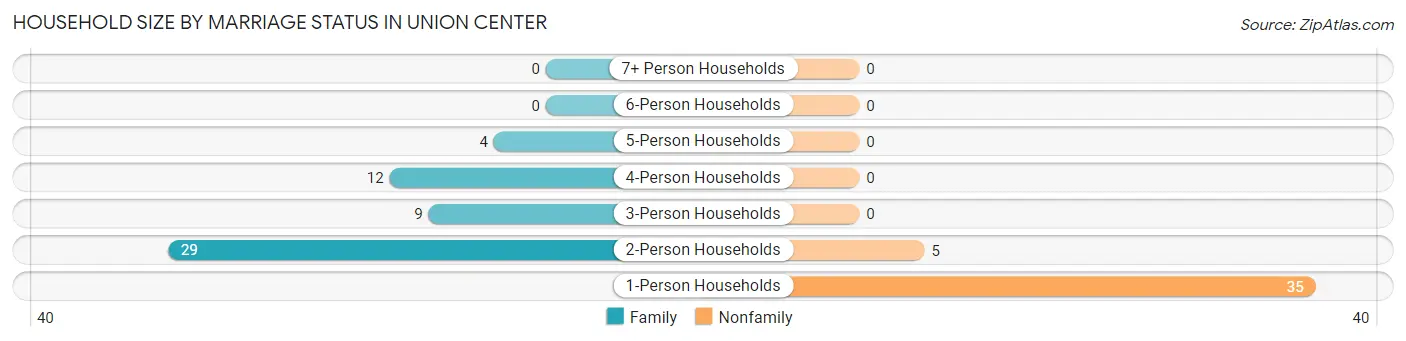
| Household Size | Family Households | Nonfamily Households |
| 1-Person Households | - | 35 (37.2%) |
| 2-Person Households | 29 (30.8%) | 5 (5.3%) |
| 3-Person Households | 9 (9.6%) | 0 (0.0%) |
| 4-Person Households | 12 (12.8%) | 0 (0.0%) |
| 5-Person Households | 4 (4.3%) | 0 (0.0%) |
| 6-Person Households | 0 (0.0%) | 0 (0.0%) |
| 7+ Person Households | 0 (0.0%) | 0 (0.0%) |
| Total | 54 (57.5%) | 40 (42.5%) |
Female Fertility in Union Center
Fertility by Age in Union Center
Average fertility rate in Union Center is 444.0 births per 1,000 women. Women in the age bracket of 20 to 34 years have the highest fertility rate with 842.0 births per 1,000 women. Women in the age bracket of 20 to 34 years acount for 100.0% of all women with births.
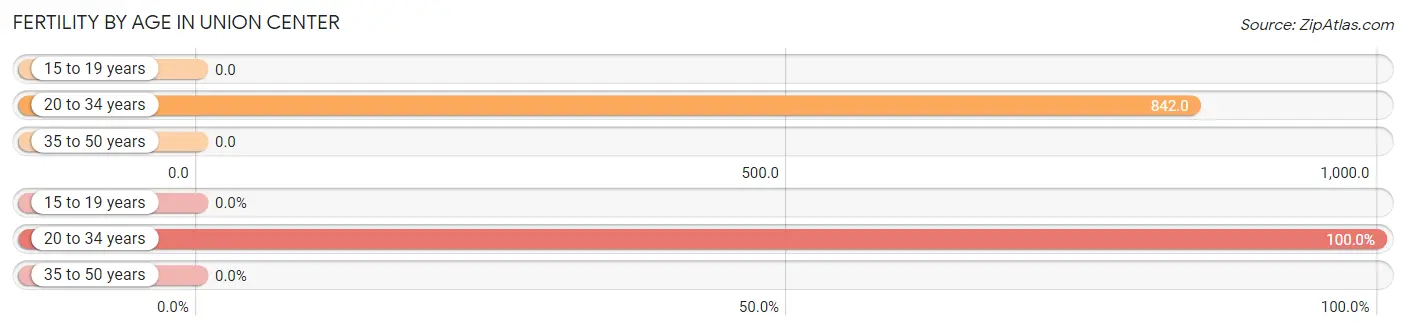
| Age Bracket | Women with Births | Births / 1,000 Women |
| 15 to 19 years | 0 (0.0%) | 0.0 |
| 20 to 34 years | 16 (100.0%) | 842.0 |
| 35 to 50 years | 0 (0.0%) | 0.0 |
| Total | 16 (100.0%) | 444.0 |
Fertility by Age by Marriage Status in Union Center
68.8% of women with births (16) in Union Center are married. The highest percentage of unmarried women with births falls into 20 to 34 years age bracket with 31.2% of them unmarried at the time of birth, while the lowest percentage of unmarried women with births belong to 20 to 34 years age bracket with 31.2% of them unmarried.
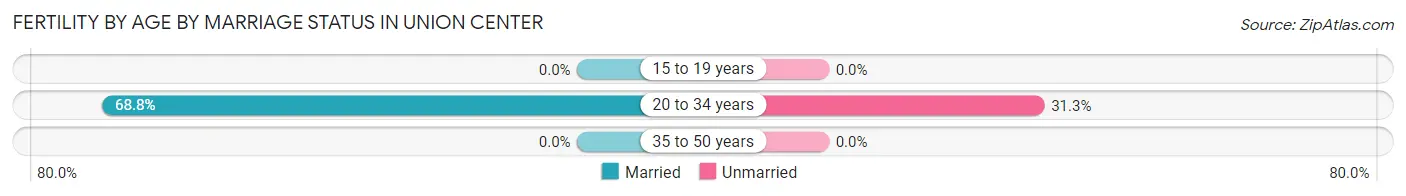
| Age Bracket | Married | Unmarried |
| 15 to 19 years | 0 (0.0%) | 0 (0.0%) |
| 20 to 34 years | 11 (68.8%) | 5 (31.2%) |
| 35 to 50 years | 0 (0.0%) | 0 (0.0%) |
| Total | 11 (68.8%) | 5 (31.2%) |
Fertility by Education in Union Center
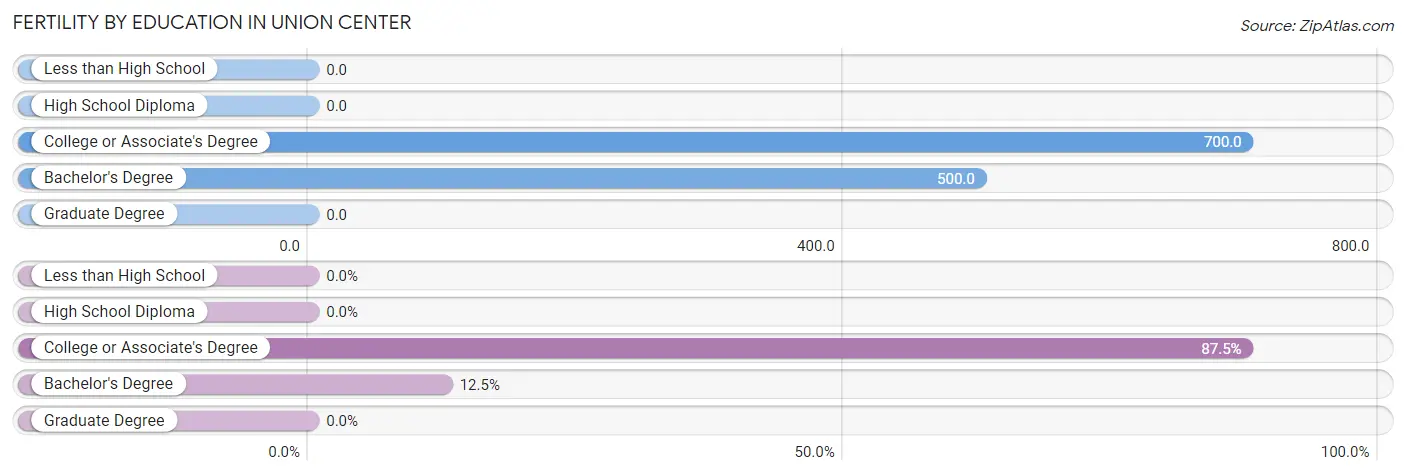
| Educational Attainment | Women with Births | Births / 1,000 Women |
| Less than High School | 0 (0.0%) | 0.0 |
| High School Diploma | 0 (0.0%) | 0.0 |
| College or Associate's Degree | 14 (87.5%) | 700.0 |
| Bachelor's Degree | 2 (12.5%) | 500.0 |
| Graduate Degree | 0 (0.0%) | 0.0 |
| Total | 16 (100.0%) | 444.0 |
Fertility by Education by Marriage Status in Union Center
31.2% of women with births in Union Center are unmarried. Women with the educational attainment of bachelor's degree are most likely to be married with 100.0% of them married at childbirth, while women with the educational attainment of college or associate's degree are least likely to be married with 35.7% of them unmarried at childbirth.
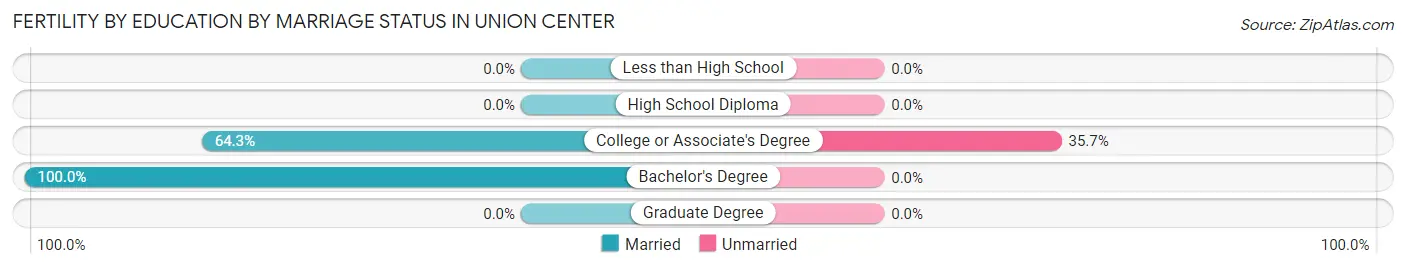
| Educational Attainment | Married | Unmarried |
| Less than High School | 0 (0.0%) | 0 (0.0%) |
| High School Diploma | 0 (0.0%) | 0 (0.0%) |
| College or Associate's Degree | 9 (64.3%) | 5 (35.7%) |
| Bachelor's Degree | 2 (100.0%) | 0 (0.0%) |
| Graduate Degree | 0 (0.0%) | 0 (0.0%) |
| Total | 11 (68.8%) | 5 (31.2%) |
Employment Characteristics in Union Center
Employment by Class of Employer in Union Center
Among the 123 employed individuals in Union Center, private company employees (70 | 56.9%), local government employees (23 | 18.7%), and self-employed (incorporated) (13 | 10.6%) make up the most common classes of employment.
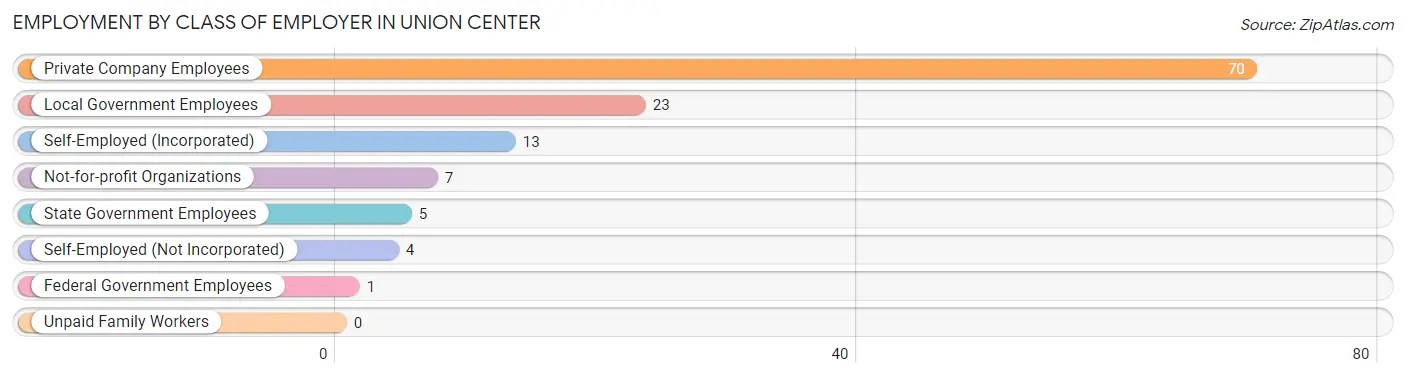
| Employer Class | # Employees | % Employees |
| Private Company Employees | 70 | 56.9% |
| Self-Employed (Incorporated) | 13 | 10.6% |
| Self-Employed (Not Incorporated) | 4 | 3.3% |
| Not-for-profit Organizations | 7 | 5.7% |
| Local Government Employees | 23 | 18.7% |
| State Government Employees | 5 | 4.1% |
| Federal Government Employees | 1 | 0.8% |
| Unpaid Family Workers | 0 | 0.0% |
| Total | 123 | 100.0% |
Employment Status by Age in Union Center
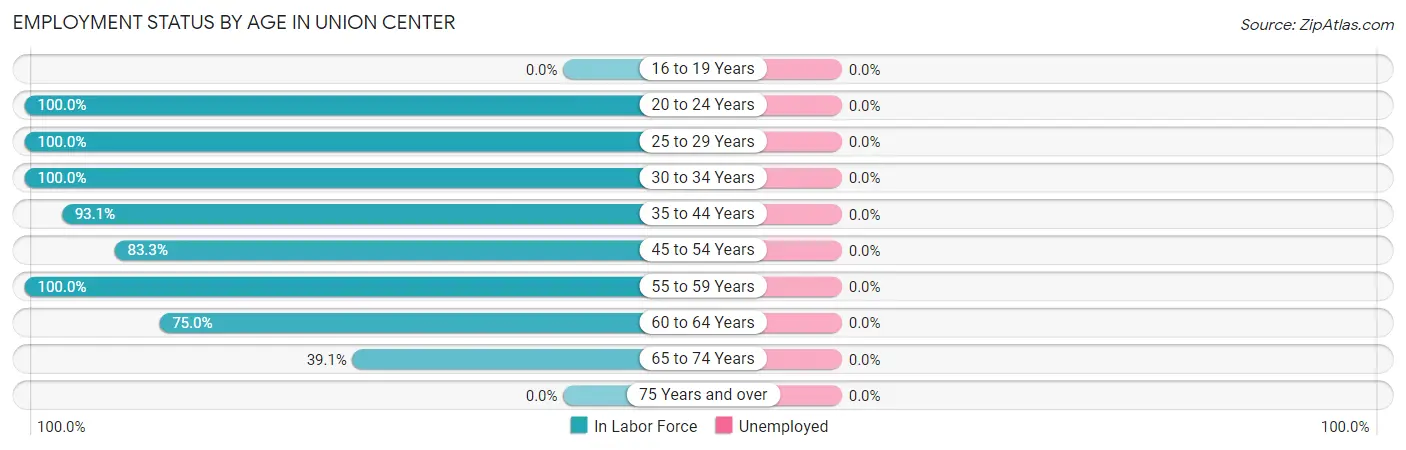
| Age Bracket | In Labor Force | Unemployed |
| 16 to 19 Years | 0 (0.0%) | 0 (0.0%) |
| 20 to 24 Years | 15 (100.0%) | 0 (0.0%) |
| 25 to 29 Years | 13 (100.0%) | 0 (0.0%) |
| 30 to 34 Years | 9 (100.0%) | 0 (0.0%) |
| 35 to 44 Years | 27 (93.1%) | 0 (0.0%) |
| 45 to 54 Years | 15 (83.3%) | 0 (0.0%) |
| 55 to 59 Years | 14 (100.0%) | 0 (0.0%) |
| 60 to 64 Years | 21 (75.0%) | 0 (0.0%) |
| 65 to 74 Years | 9 (39.1%) | 0 (0.0%) |
| 75 Years and over | 0 (0.0%) | 0 (0.0%) |
| Total | 123 (78.3%) | 0 (0.0%) |
Employment Status by Educational Attainment in Union Center
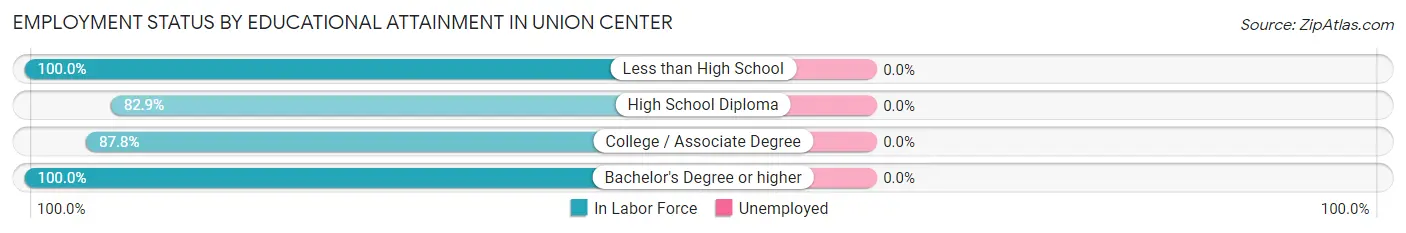
| Educational Attainment | In Labor Force | Unemployed |
| Less than High School | 8 (100.0%) | 0 (0.0%) |
| High School Diploma | 29 (82.9%) | 0 (0.0%) |
| College / Associate Degree | 43 (87.8%) | 0 (0.0%) |
| Bachelor's Degree or higher | 19 (100.0%) | 0 (0.0%) |
| Total | 99 (89.2%) | 0 (0.0%) |
Employment Occupations by Sex in Union Center
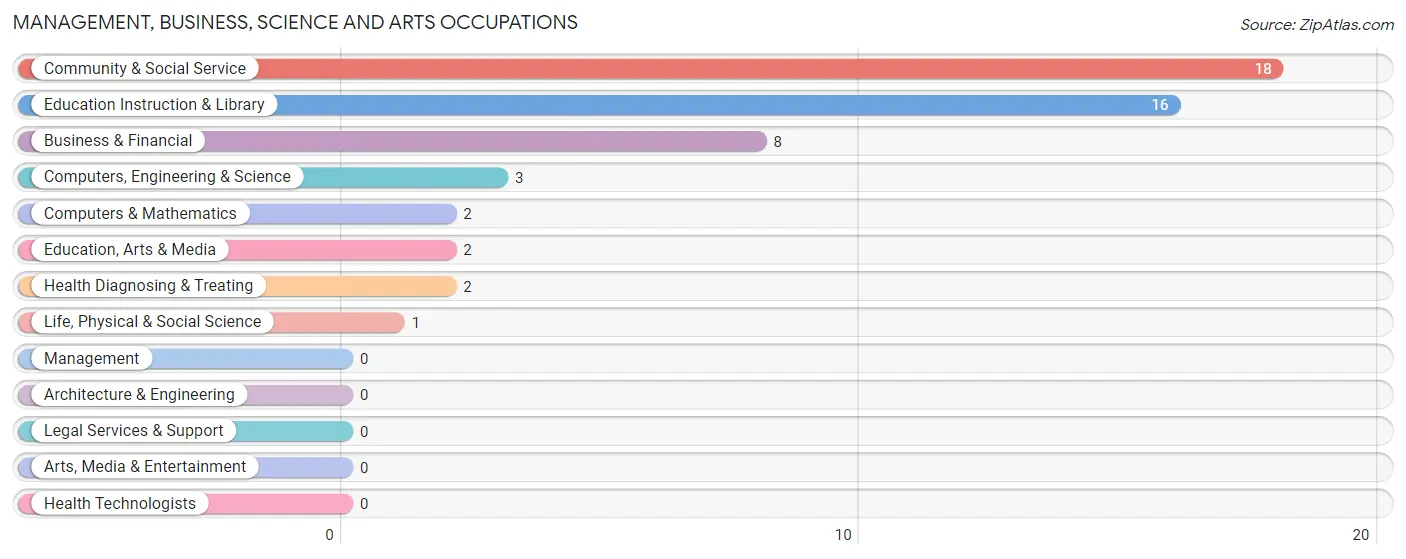
Management, Business, Science and Arts Occupations
The most common Management, Business, Science and Arts occupations in Union Center are Community & Social Service (18 | 14.6%), Education Instruction & Library (16 | 13.0%), Business & Financial (8 | 6.5%), Computers, Engineering & Science (3 | 2.4%), and Computers & Mathematics (2 | 1.6%).
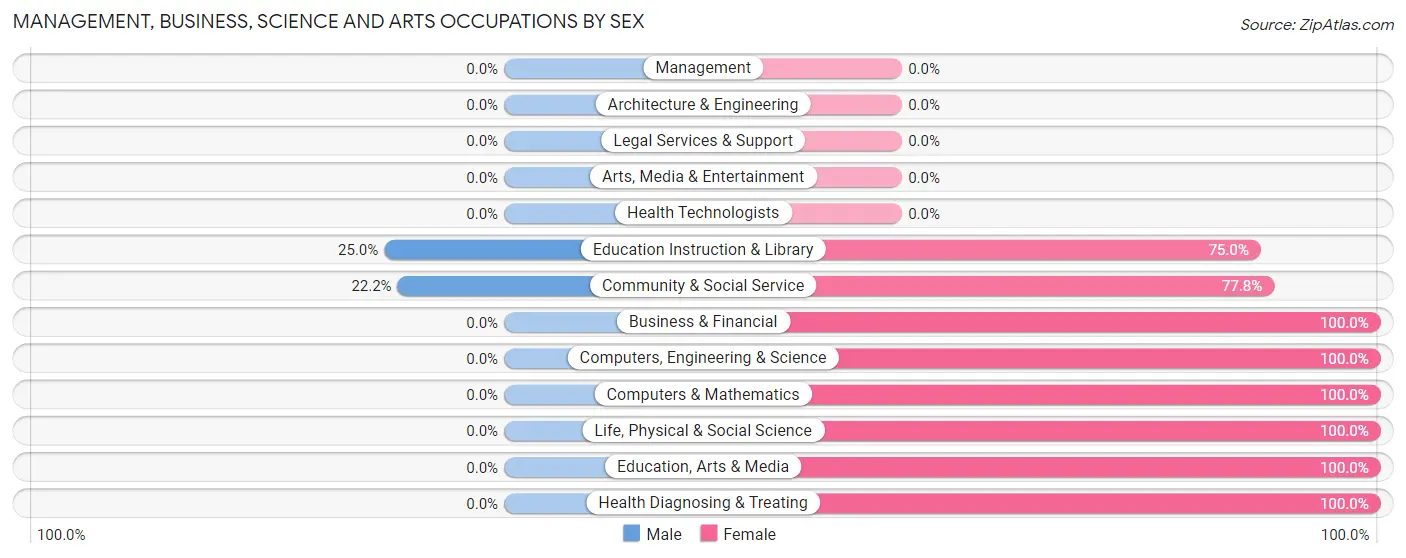
Management, Business, Science and Arts Occupations by Sex
Within the Management, Business, Science and Arts occupations in Union Center, the most male-oriented occupations are Education Instruction & Library (25.0%), and Community & Social Service (22.2%), while the most female-oriented occupations are Business & Financial (100.0%), Computers, Engineering & Science (100.0%), and Computers & Mathematics (100.0%).
| Occupation | Male | Female |
| Management | 0 (0.0%) | 0 (0.0%) |
| Business & Financial | 0 (0.0%) | 8 (100.0%) |
| Computers, Engineering & Science | 0 (0.0%) | 3 (100.0%) |
| Computers & Mathematics | 0 (0.0%) | 2 (100.0%) |
| Architecture & Engineering | 0 (0.0%) | 0 (0.0%) |
| Life, Physical & Social Science | 0 (0.0%) | 1 (100.0%) |
| Community & Social Service | 4 (22.2%) | 14 (77.8%) |
| Education, Arts & Media | 0 (0.0%) | 2 (100.0%) |
| Legal Services & Support | 0 (0.0%) | 0 (0.0%) |
| Education Instruction & Library | 4 (25.0%) | 12 (75.0%) |
| Arts, Media & Entertainment | 0 (0.0%) | 0 (0.0%) |
| Health Diagnosing & Treating | 0 (0.0%) | 2 (100.0%) |
| Health Technologists | 0 (0.0%) | 0 (0.0%) |
| Total (Category) | 4 (12.9%) | 27 (87.1%) |
| Total (Overall) | 68 (55.3%) | 55 (44.7%) |
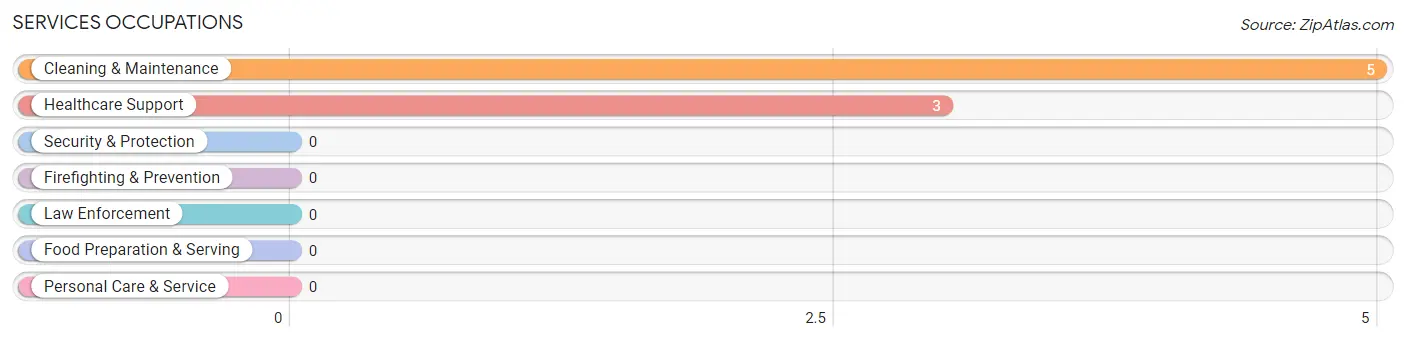
Services Occupations
The most common Services occupations in Union Center are Cleaning & Maintenance (5 | 4.1%), and Healthcare Support (3 | 2.4%).
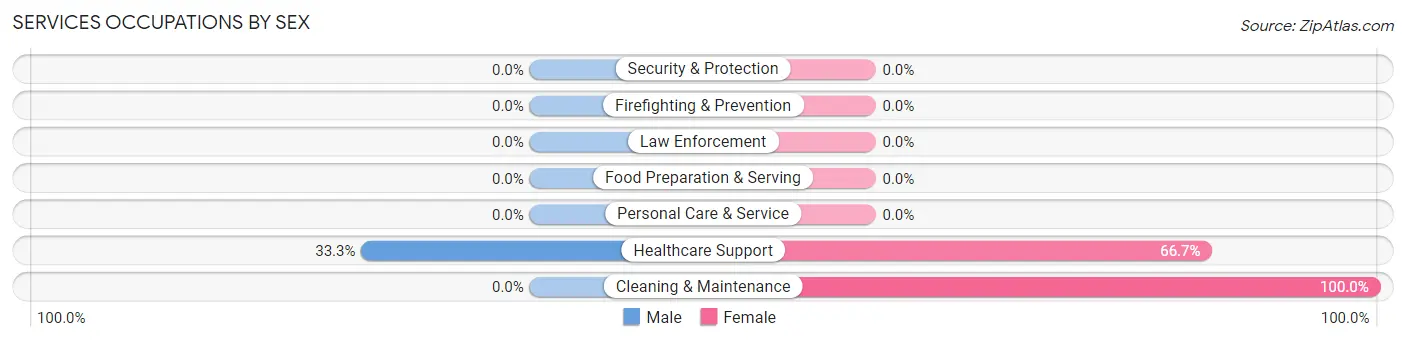
Services Occupations by Sex
| Occupation | Male | Female |
| Healthcare Support | 1 (33.3%) | 2 (66.7%) |
| Security & Protection | 0 (0.0%) | 0 (0.0%) |
| Firefighting & Prevention | 0 (0.0%) | 0 (0.0%) |
| Law Enforcement | 0 (0.0%) | 0 (0.0%) |
| Food Preparation & Serving | 0 (0.0%) | 0 (0.0%) |
| Cleaning & Maintenance | 0 (0.0%) | 5 (100.0%) |
| Personal Care & Service | 0 (0.0%) | 0 (0.0%) |
| Total (Category) | 1 (12.5%) | 7 (87.5%) |
| Total (Overall) | 68 (55.3%) | 55 (44.7%) |
Sales and Office Occupations
The most common Sales and Office occupations in Union Center are Sales & Related (12 | 9.8%), and Office & Administration (10 | 8.1%).
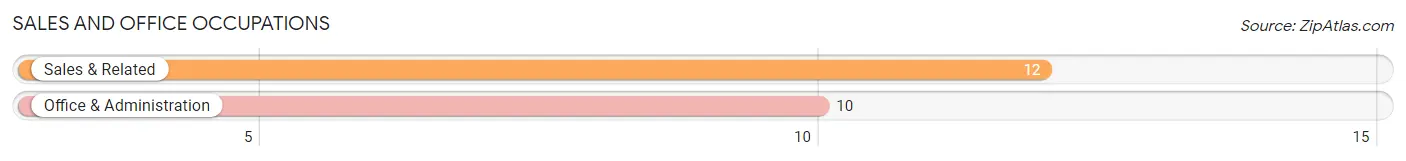
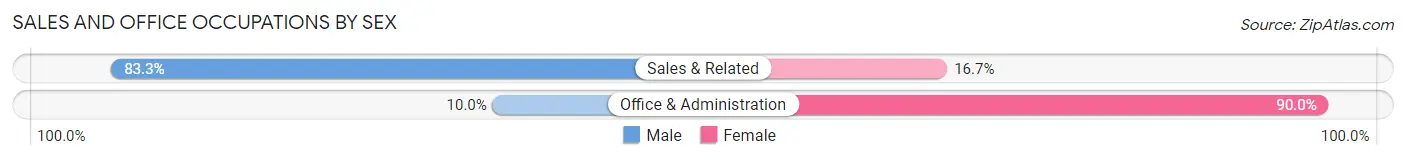
Sales and Office Occupations by Sex
| Occupation | Male | Female |
| Sales & Related | 10 (83.3%) | 2 (16.7%) |
| Office & Administration | 1 (10.0%) | 9 (90.0%) |
| Total (Category) | 11 (50.0%) | 11 (50.0%) |
| Total (Overall) | 68 (55.3%) | 55 (44.7%) |
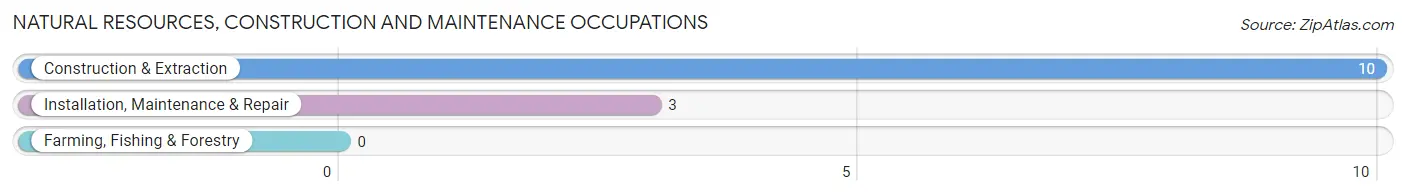
Natural Resources, Construction and Maintenance Occupations
The most common Natural Resources, Construction and Maintenance occupations in Union Center are Construction & Extraction (10 | 8.1%), and Installation, Maintenance & Repair (3 | 2.4%).
Natural Resources, Construction and Maintenance Occupations by Sex
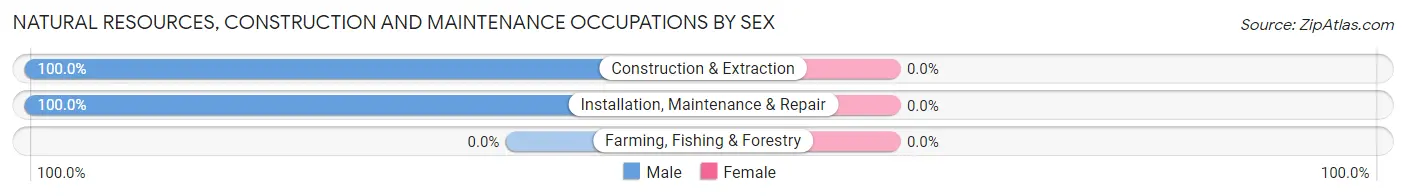
| Occupation | Male | Female |
| Farming, Fishing & Forestry | 0 (0.0%) | 0 (0.0%) |
| Construction & Extraction | 10 (100.0%) | 0 (0.0%) |
| Installation, Maintenance & Repair | 3 (100.0%) | 0 (0.0%) |
| Total (Category) | 13 (100.0%) | 0 (0.0%) |
| Total (Overall) | 68 (55.3%) | 55 (44.7%) |
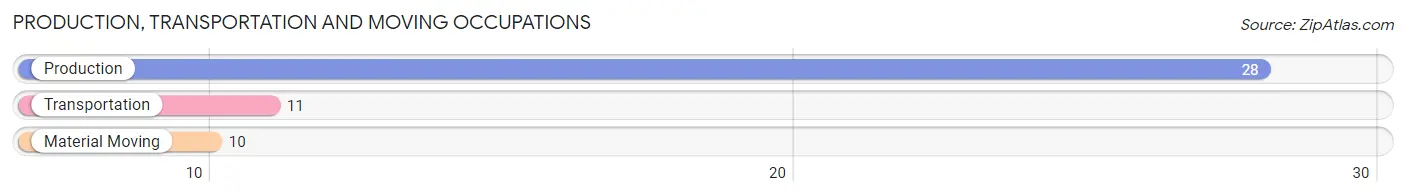
Production, Transportation and Moving Occupations
The most common Production, Transportation and Moving occupations in Union Center are Production (28 | 22.8%), Transportation (11 | 8.9%), and Material Moving (10 | 8.1%).
Production, Transportation and Moving Occupations by Sex
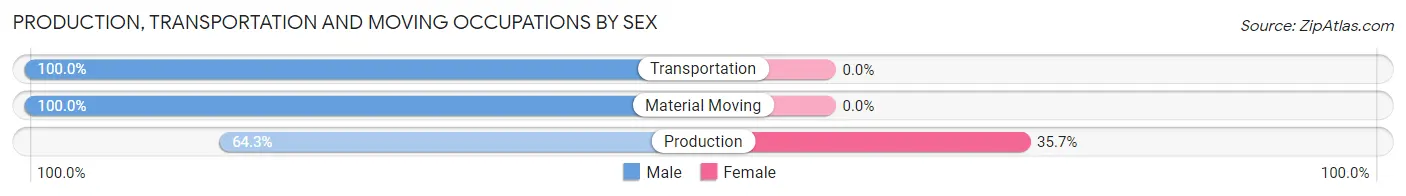
| Occupation | Male | Female |
| Production | 18 (64.3%) | 10 (35.7%) |
| Transportation | 11 (100.0%) | 0 (0.0%) |
| Material Moving | 10 (100.0%) | 0 (0.0%) |
| Total (Category) | 39 (79.6%) | 10 (20.4%) |
| Total (Overall) | 68 (55.3%) | 55 (44.7%) |
Employment Industries by Sex in Union Center
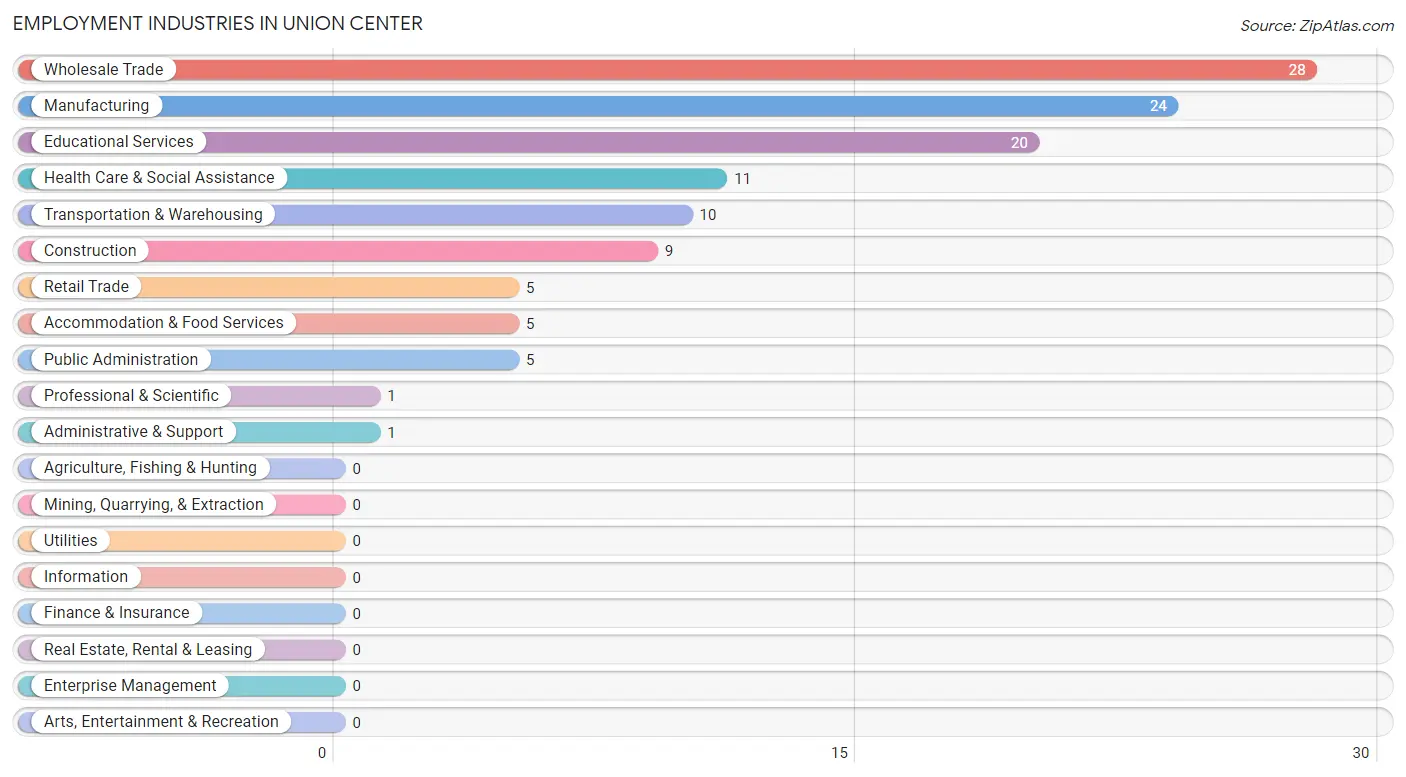
Employment Industries in Union Center
The major employment industries in Union Center include Wholesale Trade (28 | 22.8%), Manufacturing (24 | 19.5%), Educational Services (20 | 16.3%), Health Care & Social Assistance (11 | 8.9%), and Transportation & Warehousing (10 | 8.1%).
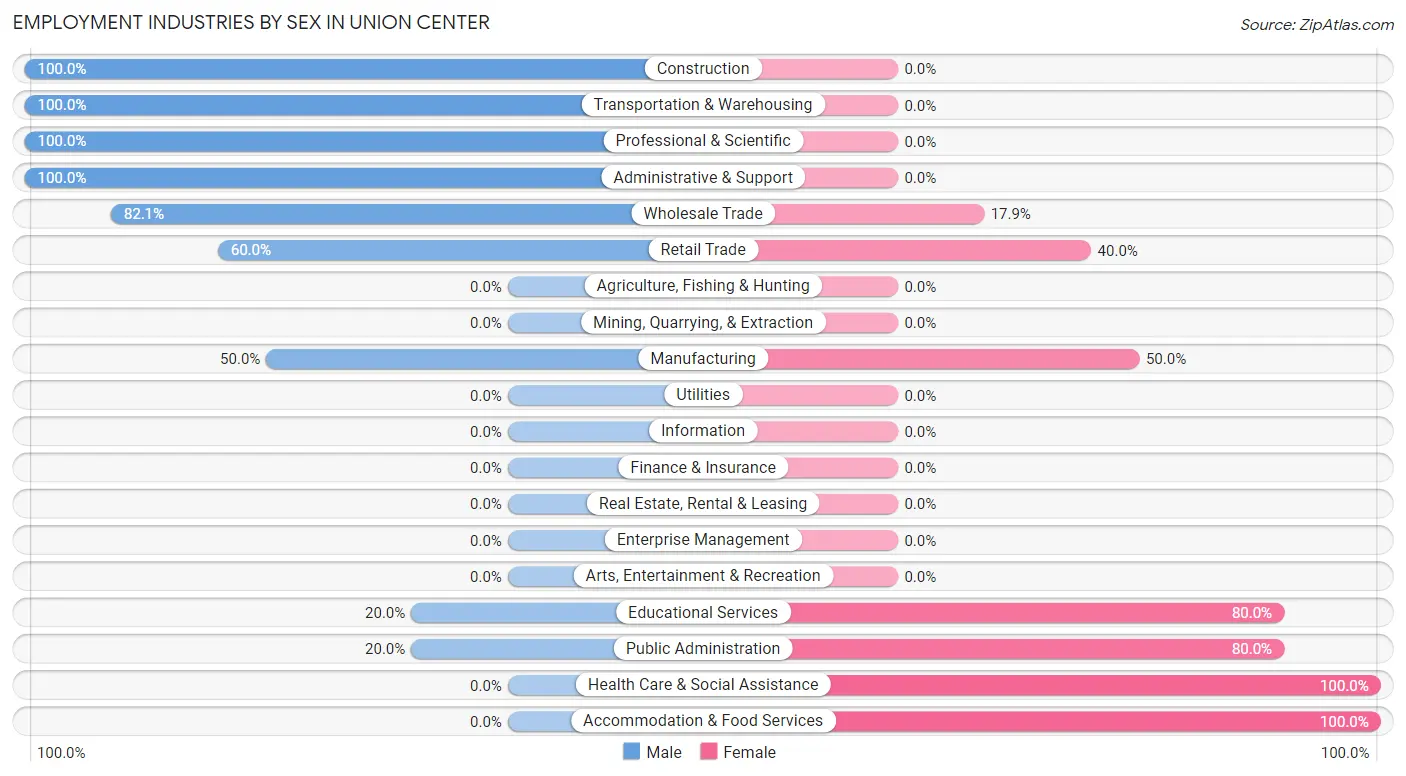
Employment Industries by Sex in Union Center
The Union Center industries that see more men than women are Construction (100.0%), Transportation & Warehousing (100.0%), and Professional & Scientific (100.0%), whereas the industries that tend to have a higher number of women are Health Care & Social Assistance (100.0%), Accommodation & Food Services (100.0%), and Educational Services (80.0%).
| Industry | Male | Female |
| Agriculture, Fishing & Hunting | 0 (0.0%) | 0 (0.0%) |
| Mining, Quarrying, & Extraction | 0 (0.0%) | 0 (0.0%) |
| Construction | 9 (100.0%) | 0 (0.0%) |
| Manufacturing | 12 (50.0%) | 12 (50.0%) |
| Wholesale Trade | 23 (82.1%) | 5 (17.9%) |
| Retail Trade | 3 (60.0%) | 2 (40.0%) |
| Transportation & Warehousing | 10 (100.0%) | 0 (0.0%) |
| Utilities | 0 (0.0%) | 0 (0.0%) |
| Information | 0 (0.0%) | 0 (0.0%) |
| Finance & Insurance | 0 (0.0%) | 0 (0.0%) |
| Real Estate, Rental & Leasing | 0 (0.0%) | 0 (0.0%) |
| Professional & Scientific | 1 (100.0%) | 0 (0.0%) |
| Enterprise Management | 0 (0.0%) | 0 (0.0%) |
| Administrative & Support | 1 (100.0%) | 0 (0.0%) |
| Educational Services | 4 (20.0%) | 16 (80.0%) |
| Health Care & Social Assistance | 0 (0.0%) | 11 (100.0%) |
| Arts, Entertainment & Recreation | 0 (0.0%) | 0 (0.0%) |
| Accommodation & Food Services | 0 (0.0%) | 5 (100.0%) |
| Public Administration | 1 (20.0%) | 4 (80.0%) |
| Total | 68 (55.3%) | 55 (44.7%) |
Education in Union Center
School Enrollment in Union Center
The most common levels of schooling among the 32 students in Union Center are middle school (11 | 34.4%), kindergarten (7 | 21.9%), and elementary school (6 | 18.8%).
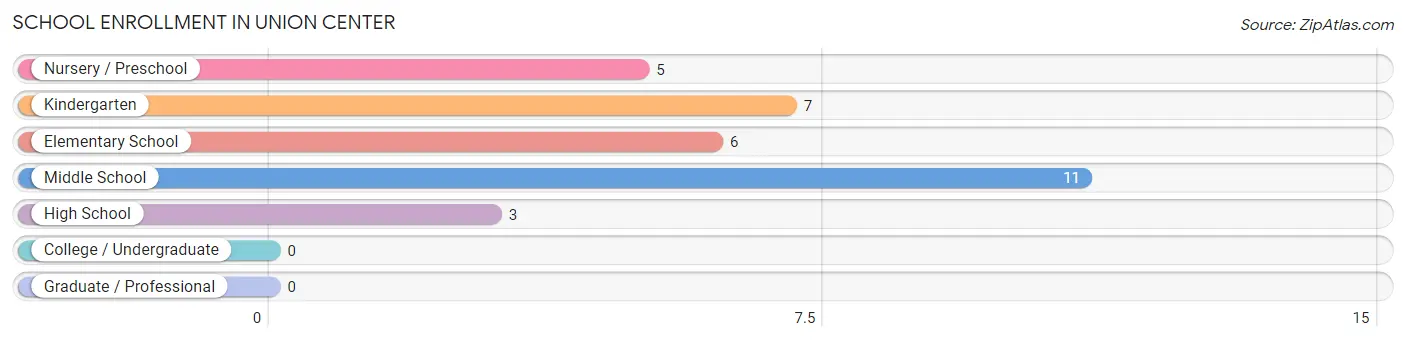
| School Level | # Students | % Students |
| Nursery / Preschool | 5 | 15.6% |
| Kindergarten | 7 | 21.9% |
| Elementary School | 6 | 18.8% |
| Middle School | 11 | 34.4% |
| High School | 3 | 9.4% |
| College / Undergraduate | 0 | 0.0% |
| Graduate / Professional | 0 | 0.0% |
| Total | 32 | 100.0% |
School Enrollment by Age by Funding Source in Union Center
Out of a total of 32 students who are enrolled in schools in Union Center, 15 (46.9%) attend a private institution, while the remaining 17 (53.1%) are enrolled in public schools. The age group of 3 to 4 year olds has the highest likelihood of being enrolled in private schools, with 5 (100.0% in the age bracket) enrolled. Conversely, the age group of 10 to 14 year olds has the lowest likelihood of being enrolled in a private school, with 13 (92.9% in the age bracket) attending a public institution.
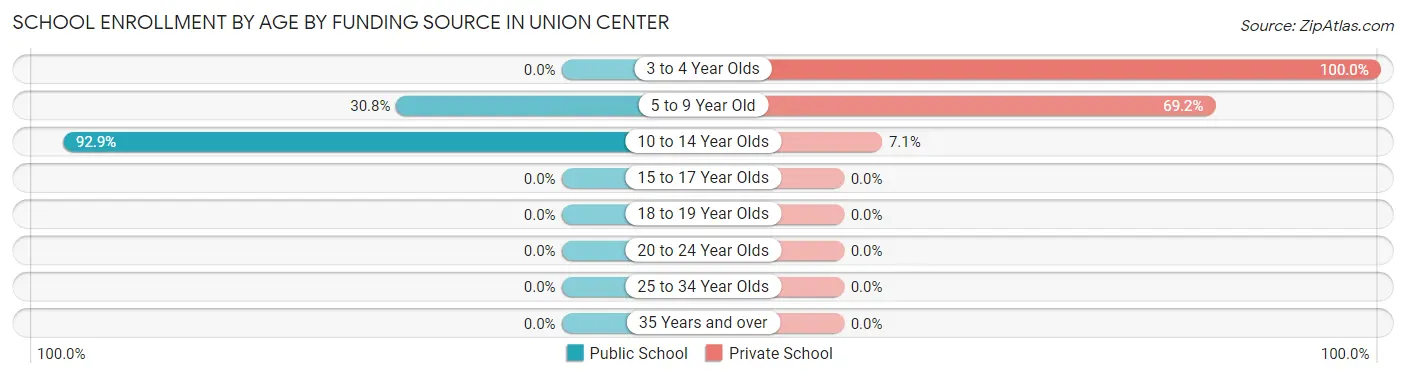
| Age Bracket | Public School | Private School |
| 3 to 4 Year Olds | 0 (0.0%) | 5 (100.0%) |
| 5 to 9 Year Old | 4 (30.8%) | 9 (69.2%) |
| 10 to 14 Year Olds | 13 (92.9%) | 1 (7.1%) |
| 15 to 17 Year Olds | 0 (0.0%) | 0 (0.0%) |
| 18 to 19 Year Olds | 0 (0.0%) | 0 (0.0%) |
| 20 to 24 Year Olds | 0 (0.0%) | 0 (0.0%) |
| 25 to 34 Year Olds | 0 (0.0%) | 0 (0.0%) |
| 35 Years and over | 0 (0.0%) | 0 (0.0%) |
| Total | 17 (53.1%) | 15 (46.9%) |
Educational Attainment by Field of Study in Union Center
Psychology (10 | 52.6%), education (5 | 26.3%), social sciences (2 | 10.5%), and arts & humanities (2 | 10.5%) are the most common fields of study among 19 individuals in Union Center who have obtained a bachelor's degree or higher.
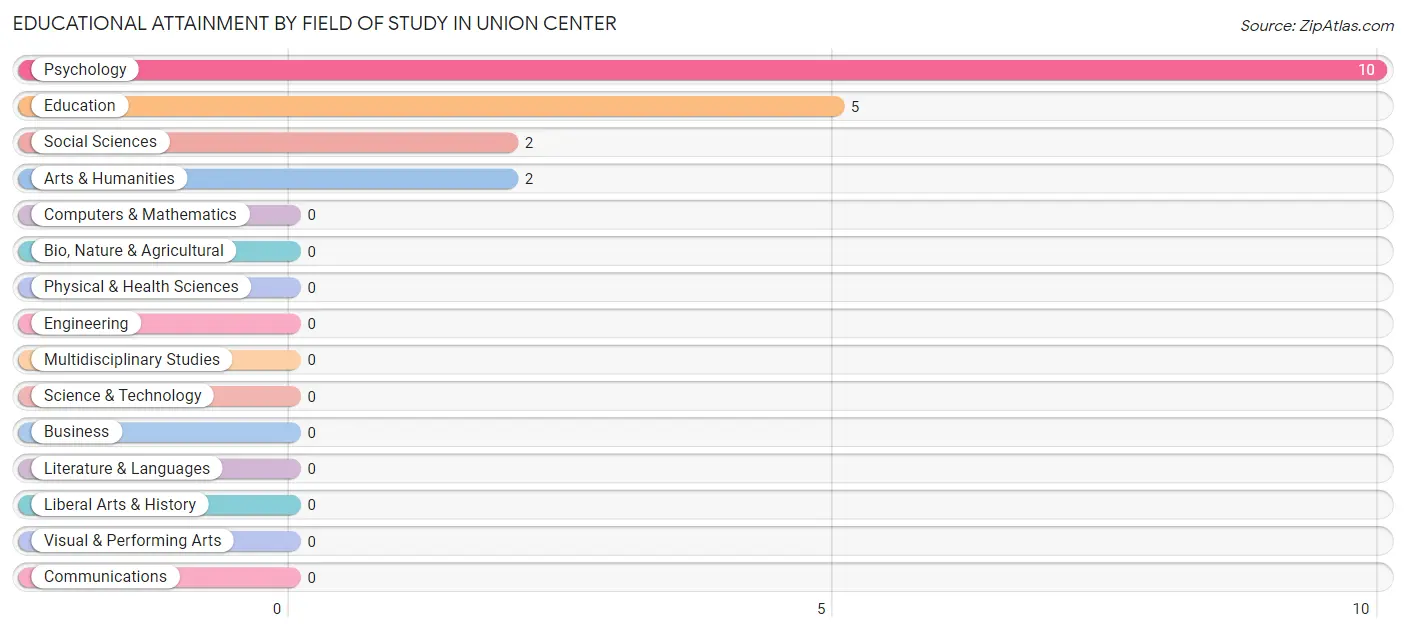
| Field of Study | # Graduates | % Graduates |
| Computers & Mathematics | 0 | 0.0% |
| Bio, Nature & Agricultural | 0 | 0.0% |
| Physical & Health Sciences | 0 | 0.0% |
| Psychology | 10 | 52.6% |
| Social Sciences | 2 | 10.5% |
| Engineering | 0 | 0.0% |
| Multidisciplinary Studies | 0 | 0.0% |
| Science & Technology | 0 | 0.0% |
| Business | 0 | 0.0% |
| Education | 5 | 26.3% |
| Literature & Languages | 0 | 0.0% |
| Liberal Arts & History | 0 | 0.0% |
| Visual & Performing Arts | 0 | 0.0% |
| Communications | 0 | 0.0% |
| Arts & Humanities | 2 | 10.5% |
| Total | 19 | 100.0% |
Transportation & Commute in Union Center
Vehicle Availability by Sex in Union Center
The most prevalent vehicle ownership categories in Union Center are males with 2 vehicles (52, accounting for 76.5%) and females with 2 vehicles (35, making up 94.6%).
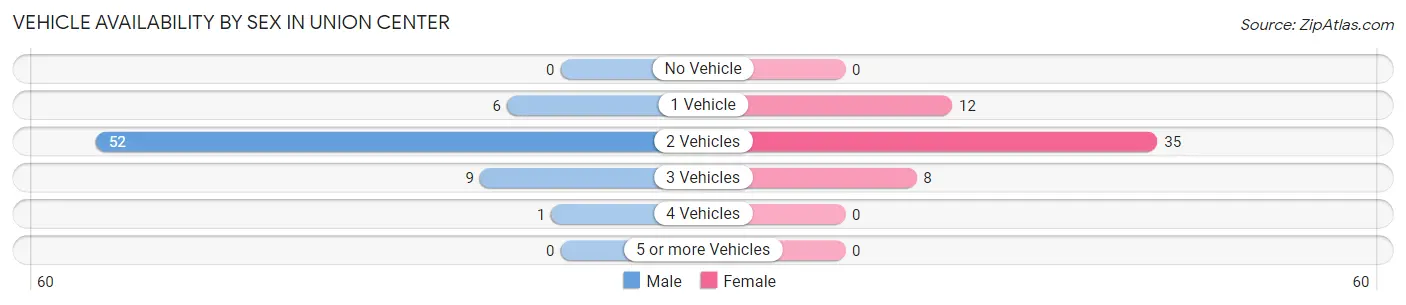
| Vehicles Available | Male | Female |
| No Vehicle | 0 (0.0%) | 0 (0.0%) |
| 1 Vehicle | 6 (8.8%) | 12 (21.8%) |
| 2 Vehicles | 52 (76.5%) | 35 (63.6%) |
| 3 Vehicles | 9 (13.2%) | 8 (14.5%) |
| 4 Vehicles | 1 (1.5%) | 0 (0.0%) |
| 5 or more Vehicles | 0 (0.0%) | 0 (0.0%) |
| Total | 68 (100.0%) | 55 (100.0%) |
Commute Time in Union Center
The most frequently occuring commute durations in Union Center are 5 to 9 minutes (32 commuters, 26.2%), 20 to 24 minutes (17 commuters, 13.9%), and 25 to 29 minutes (16 commuters, 13.1%).
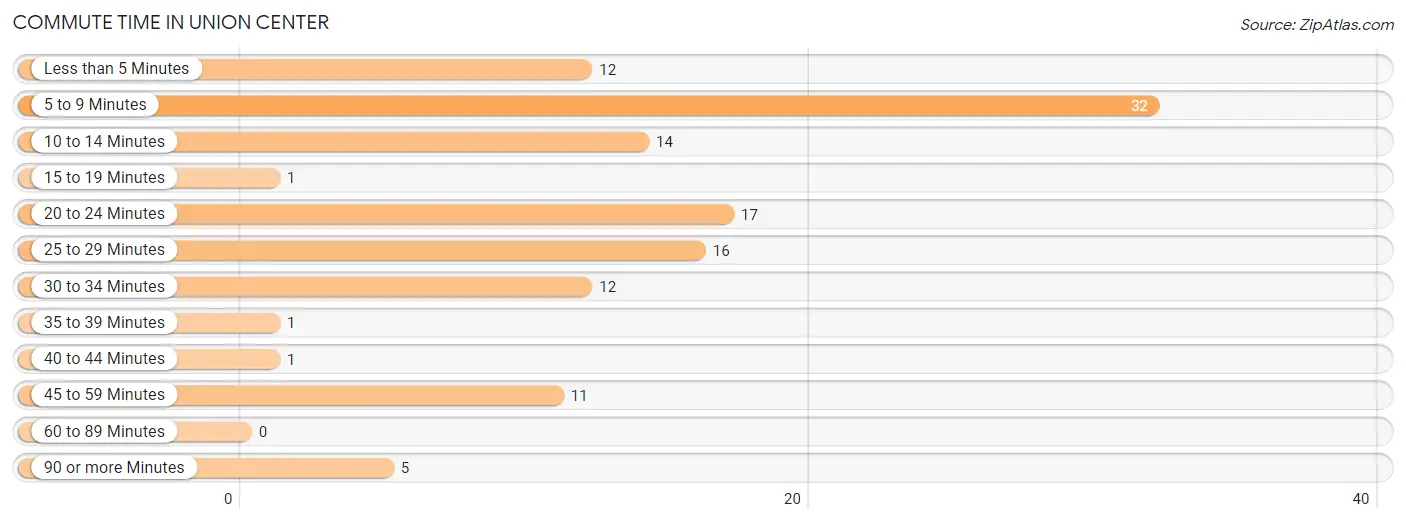
| Commute Time | # Commuters | % Commuters |
| Less than 5 Minutes | 12 | 9.8% |
| 5 to 9 Minutes | 32 | 26.2% |
| 10 to 14 Minutes | 14 | 11.5% |
| 15 to 19 Minutes | 1 | 0.8% |
| 20 to 24 Minutes | 17 | 13.9% |
| 25 to 29 Minutes | 16 | 13.1% |
| 30 to 34 Minutes | 12 | 9.8% |
| 35 to 39 Minutes | 1 | 0.8% |
| 40 to 44 Minutes | 1 | 0.8% |
| 45 to 59 Minutes | 11 | 9.0% |
| 60 to 89 Minutes | 0 | 0.0% |
| 90 or more Minutes | 5 | 4.1% |
Commute Time by Sex in Union Center
The most common commute times in Union Center are less than 5 minutes (12 commuters, 17.9%) for males and 5 to 9 minutes (23 commuters, 41.8%) for females.
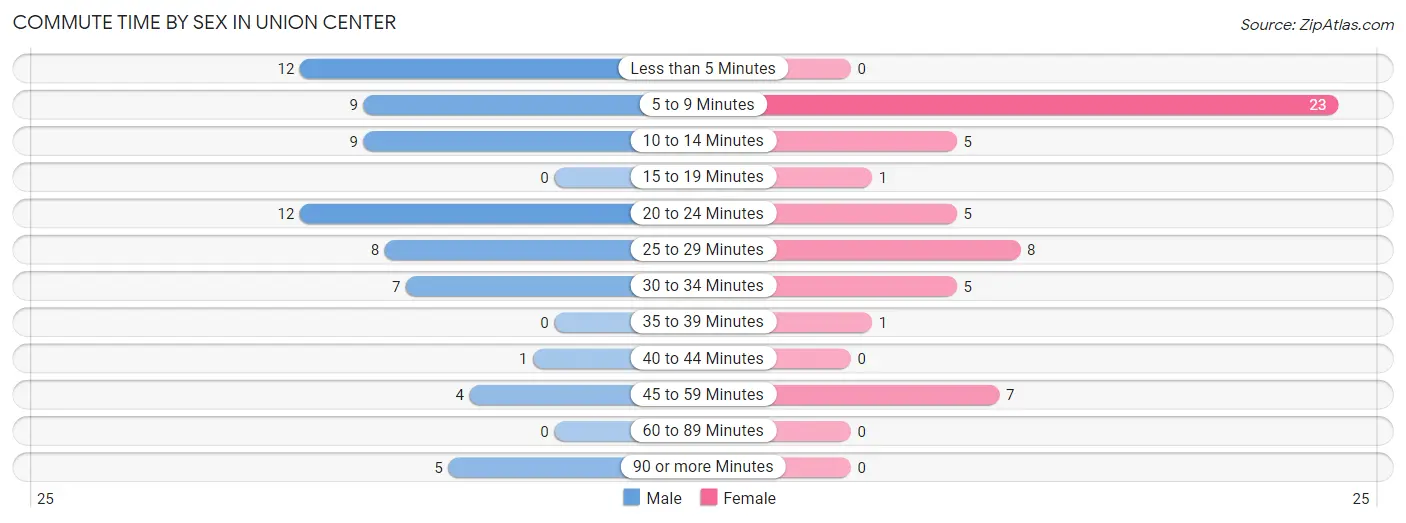
| Commute Time | Male | Female |
| Less than 5 Minutes | 12 (17.9%) | 0 (0.0%) |
| 5 to 9 Minutes | 9 (13.4%) | 23 (41.8%) |
| 10 to 14 Minutes | 9 (13.4%) | 5 (9.1%) |
| 15 to 19 Minutes | 0 (0.0%) | 1 (1.8%) |
| 20 to 24 Minutes | 12 (17.9%) | 5 (9.1%) |
| 25 to 29 Minutes | 8 (11.9%) | 8 (14.5%) |
| 30 to 34 Minutes | 7 (10.4%) | 5 (9.1%) |
| 35 to 39 Minutes | 0 (0.0%) | 1 (1.8%) |
| 40 to 44 Minutes | 1 (1.5%) | 0 (0.0%) |
| 45 to 59 Minutes | 4 (6.0%) | 7 (12.7%) |
| 60 to 89 Minutes | 0 (0.0%) | 0 (0.0%) |
| 90 or more Minutes | 5 (7.5%) | 0 (0.0%) |
Time of Departure to Work by Sex in Union Center
The most frequent times of departure to work in Union Center are 12:00 AM to 4:59 AM (21, 31.3%) for males and 7:00 AM to 7:29 AM (17, 30.9%) for females.
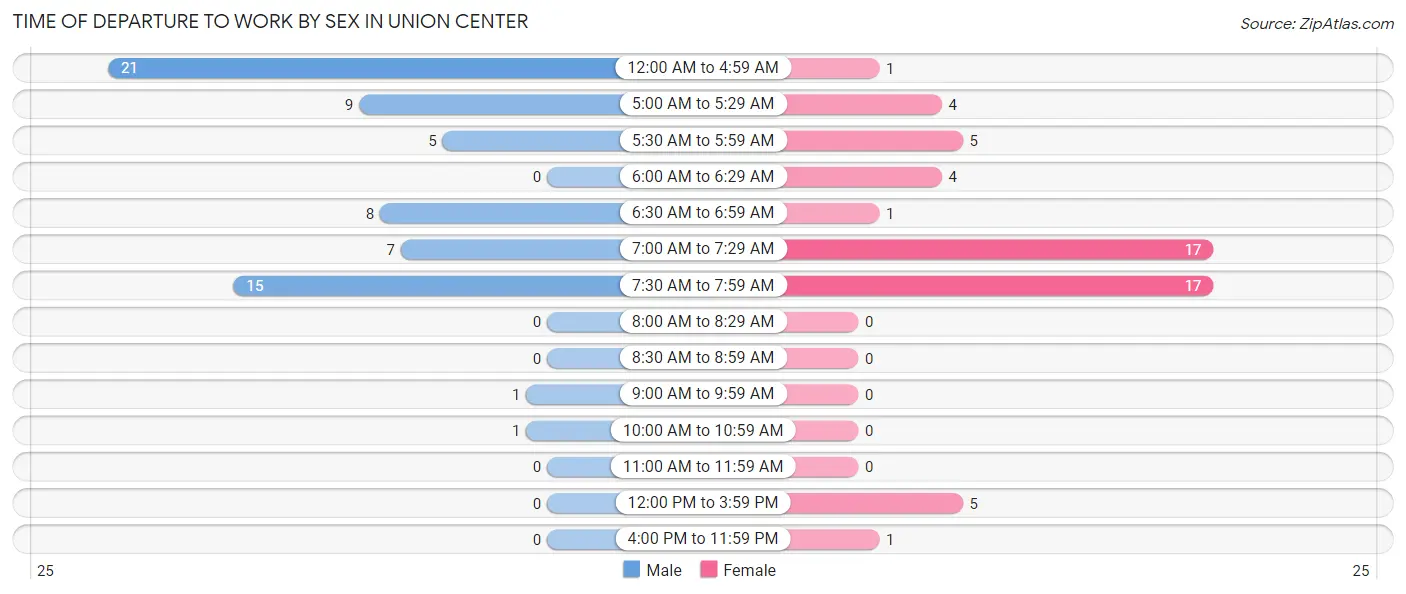
| Time of Departure | Male | Female |
| 12:00 AM to 4:59 AM | 21 (31.3%) | 1 (1.8%) |
| 5:00 AM to 5:29 AM | 9 (13.4%) | 4 (7.3%) |
| 5:30 AM to 5:59 AM | 5 (7.5%) | 5 (9.1%) |
| 6:00 AM to 6:29 AM | 0 (0.0%) | 4 (7.3%) |
| 6:30 AM to 6:59 AM | 8 (11.9%) | 1 (1.8%) |
| 7:00 AM to 7:29 AM | 7 (10.4%) | 17 (30.9%) |
| 7:30 AM to 7:59 AM | 15 (22.4%) | 17 (30.9%) |
| 8:00 AM to 8:29 AM | 0 (0.0%) | 0 (0.0%) |
| 8:30 AM to 8:59 AM | 0 (0.0%) | 0 (0.0%) |
| 9:00 AM to 9:59 AM | 1 (1.5%) | 0 (0.0%) |
| 10:00 AM to 10:59 AM | 1 (1.5%) | 0 (0.0%) |
| 11:00 AM to 11:59 AM | 0 (0.0%) | 0 (0.0%) |
| 12:00 PM to 3:59 PM | 0 (0.0%) | 5 (9.1%) |
| 4:00 PM to 11:59 PM | 0 (0.0%) | 1 (1.8%) |
| Total | 67 (100.0%) | 55 (100.0%) |
Housing Occupancy in Union Center
Occupancy by Ownership in Union Center
Of the total 94 dwellings in Union Center, owner-occupied units account for 65 (69.2%), while renter-occupied units make up 29 (30.8%).
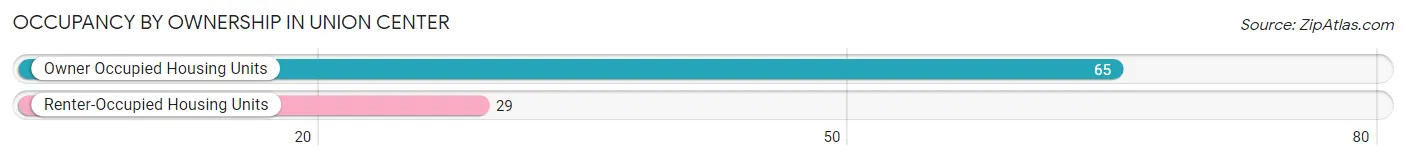
| Occupancy | # Housing Units | % Housing Units |
| Owner Occupied Housing Units | 65 | 69.2% |
| Renter-Occupied Housing Units | 29 | 30.8% |
| Total Occupied Housing Units | 94 | 100.0% |
Occupancy by Household Size in Union Center
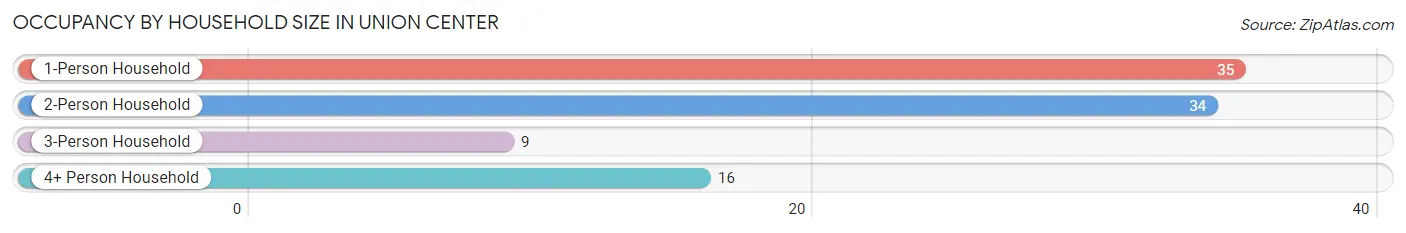
| Household Size | # Housing Units | % Housing Units |
| 1-Person Household | 35 | 37.2% |
| 2-Person Household | 34 | 36.2% |
| 3-Person Household | 9 | 9.6% |
| 4+ Person Household | 16 | 17.0% |
| Total Housing Units | 94 | 100.0% |
Occupancy by Ownership by Household Size in Union Center
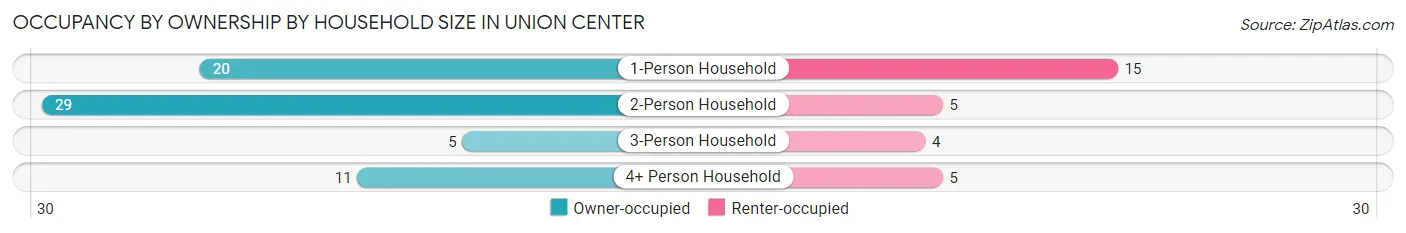
| Household Size | Owner-occupied | Renter-occupied |
| 1-Person Household | 20 (57.1%) | 15 (42.9%) |
| 2-Person Household | 29 (85.3%) | 5 (14.7%) |
| 3-Person Household | 5 (55.6%) | 4 (44.4%) |
| 4+ Person Household | 11 (68.8%) | 5 (31.2%) |
| Total Housing Units | 65 (69.2%) | 29 (30.8%) |
Occupancy by Educational Attainment in Union Center
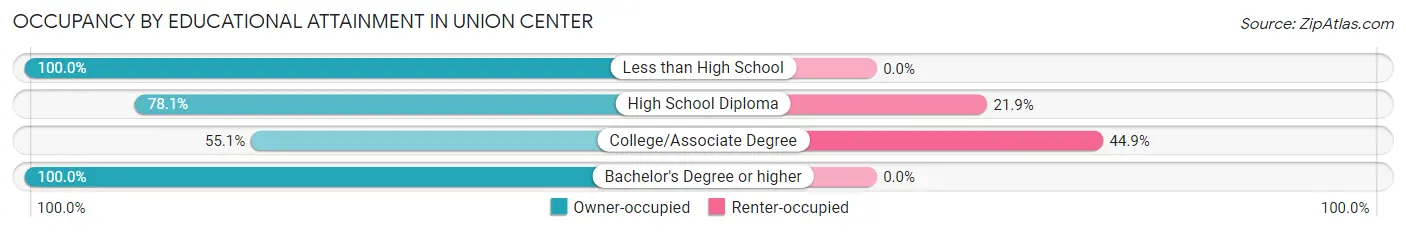
| Household Size | Owner-occupied | Renter-occupied |
| Less than High School | 6 (100.0%) | 0 (0.0%) |
| High School Diploma | 25 (78.1%) | 7 (21.9%) |
| College/Associate Degree | 27 (55.1%) | 22 (44.9%) |
| Bachelor's Degree or higher | 7 (100.0%) | 0 (0.0%) |
Occupancy by Age of Householder in Union Center
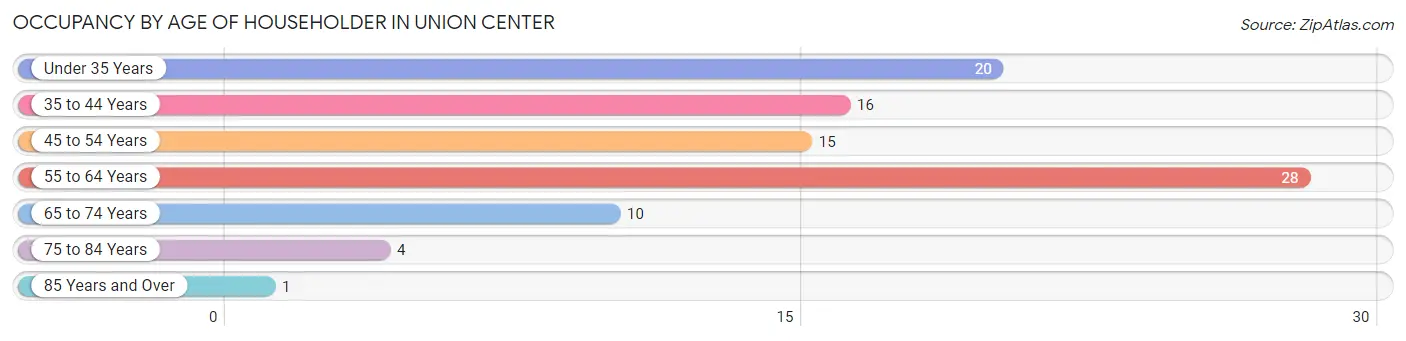
| Age Bracket | # Households | % Households |
| Under 35 Years | 20 | 21.3% |
| 35 to 44 Years | 16 | 17.0% |
| 45 to 54 Years | 15 | 16.0% |
| 55 to 64 Years | 28 | 29.8% |
| 65 to 74 Years | 10 | 10.6% |
| 75 to 84 Years | 4 | 4.3% |
| 85 Years and Over | 1 | 1.1% |
| Total | 94 | 100.0% |
Housing Finances in Union Center
Median Income by Occupancy in Union Center
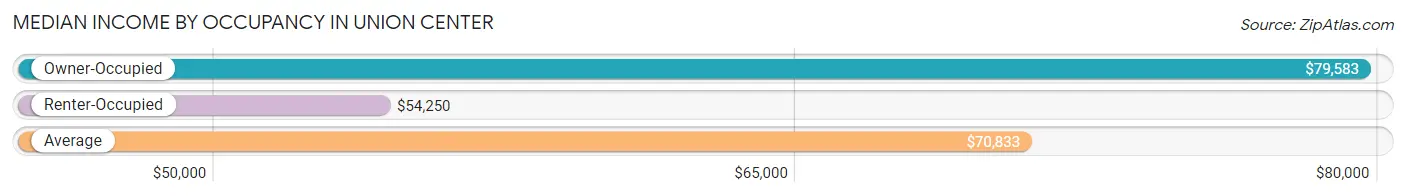
| Occupancy Type | # Households | Median Income |
| Owner-Occupied | 65 (69.2%) | $79,583 |
| Renter-Occupied | 29 (30.8%) | $54,250 |
| Average | 94 (100.0%) | $70,833 |
Occupancy by Householder Income Bracket in Union Center
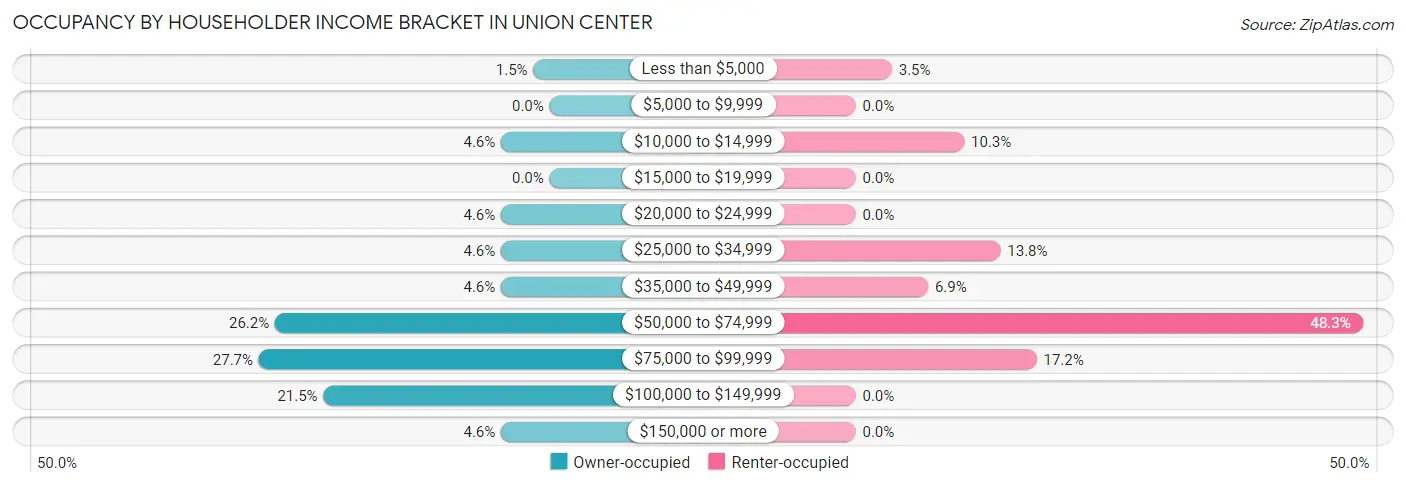
| Income Bracket | Owner-occupied | Renter-occupied |
| Less than $5,000 | 1 (1.5%) | 1 (3.5%) |
| $5,000 to $9,999 | 0 (0.0%) | 0 (0.0%) |
| $10,000 to $14,999 | 3 (4.6%) | 3 (10.3%) |
| $15,000 to $19,999 | 0 (0.0%) | 0 (0.0%) |
| $20,000 to $24,999 | 3 (4.6%) | 0 (0.0%) |
| $25,000 to $34,999 | 3 (4.6%) | 4 (13.8%) |
| $35,000 to $49,999 | 3 (4.6%) | 2 (6.9%) |
| $50,000 to $74,999 | 17 (26.2%) | 14 (48.3%) |
| $75,000 to $99,999 | 18 (27.7%) | 5 (17.2%) |
| $100,000 to $149,999 | 14 (21.5%) | 0 (0.0%) |
| $150,000 or more | 3 (4.6%) | 0 (0.0%) |
| Total | 65 (100.0%) | 29 (100.0%) |
Monthly Housing Cost Tiers in Union Center
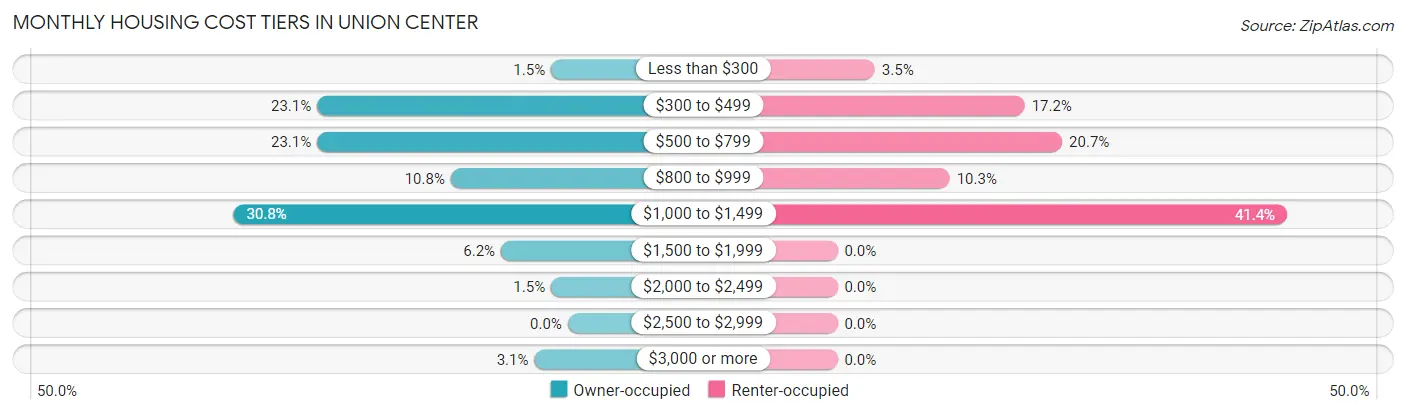
| Monthly Cost | Owner-occupied | Renter-occupied |
| Less than $300 | 1 (1.5%) | 1 (3.5%) |
| $300 to $499 | 15 (23.1%) | 5 (17.2%) |
| $500 to $799 | 15 (23.1%) | 6 (20.7%) |
| $800 to $999 | 7 (10.8%) | 3 (10.3%) |
| $1,000 to $1,499 | 20 (30.8%) | 12 (41.4%) |
| $1,500 to $1,999 | 4 (6.1%) | 0 (0.0%) |
| $2,000 to $2,499 | 1 (1.5%) | 0 (0.0%) |
| $2,500 to $2,999 | 0 (0.0%) | 0 (0.0%) |
| $3,000 or more | 2 (3.1%) | 0 (0.0%) |
| Total | 65 (100.0%) | 29 (100.0%) |
Physical Housing Characteristics in Union Center
Housing Structures in Union Center
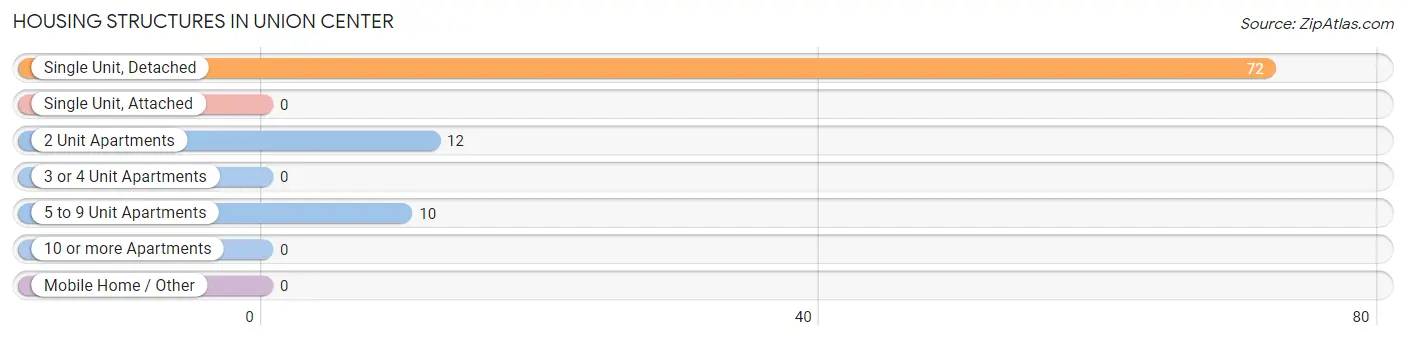
| Structure Type | # Housing Units | % Housing Units |
| Single Unit, Detached | 72 | 76.6% |
| Single Unit, Attached | 0 | 0.0% |
| 2 Unit Apartments | 12 | 12.8% |
| 3 or 4 Unit Apartments | 0 | 0.0% |
| 5 to 9 Unit Apartments | 10 | 10.6% |
| 10 or more Apartments | 0 | 0.0% |
| Mobile Home / Other | 0 | 0.0% |
| Total | 94 | 100.0% |
Housing Structures by Occupancy in Union Center
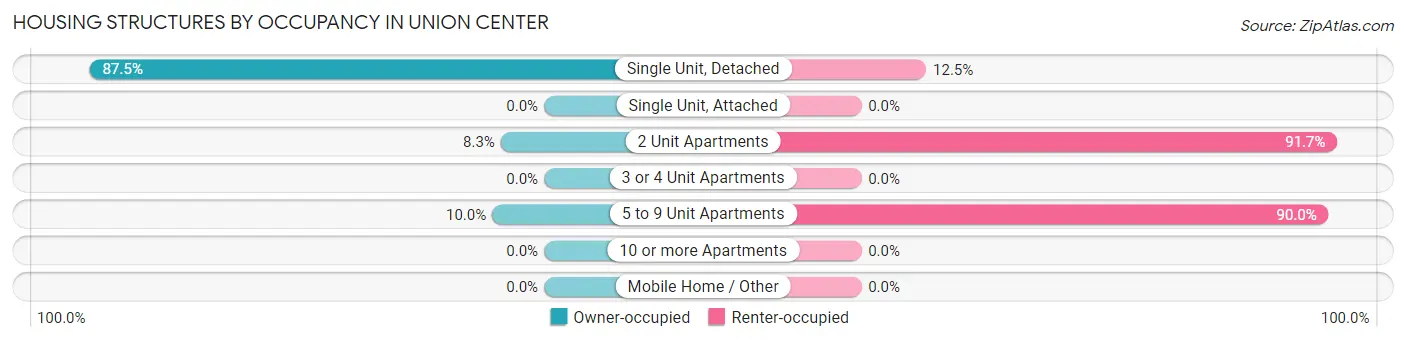
| Structure Type | Owner-occupied | Renter-occupied |
| Single Unit, Detached | 63 (87.5%) | 9 (12.5%) |
| Single Unit, Attached | 0 (0.0%) | 0 (0.0%) |
| 2 Unit Apartments | 1 (8.3%) | 11 (91.7%) |
| 3 or 4 Unit Apartments | 0 (0.0%) | 0 (0.0%) |
| 5 to 9 Unit Apartments | 1 (10.0%) | 9 (90.0%) |
| 10 or more Apartments | 0 (0.0%) | 0 (0.0%) |
| Mobile Home / Other | 0 (0.0%) | 0 (0.0%) |
| Total | 65 (69.2%) | 29 (30.8%) |
Housing Structures by Number of Rooms in Union Center
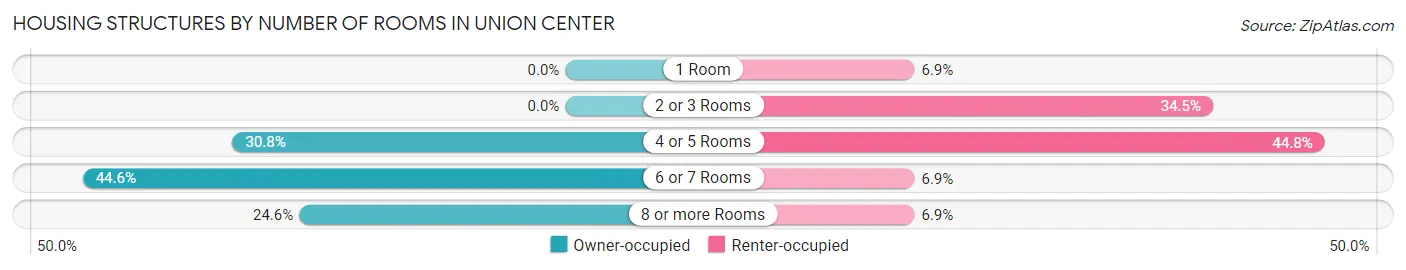
| Number of Rooms | Owner-occupied | Renter-occupied |
| 1 Room | 0 (0.0%) | 2 (6.9%) |
| 2 or 3 Rooms | 0 (0.0%) | 10 (34.5%) |
| 4 or 5 Rooms | 20 (30.8%) | 13 (44.8%) |
| 6 or 7 Rooms | 29 (44.6%) | 2 (6.9%) |
| 8 or more Rooms | 16 (24.6%) | 2 (6.9%) |
| Total | 65 (100.0%) | 29 (100.0%) |
Housing Structure by Heating Type in Union Center
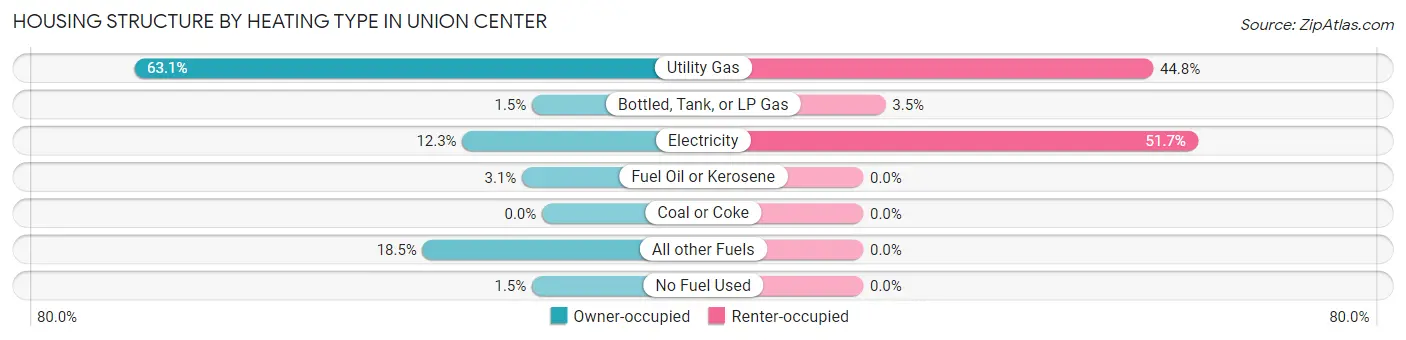
| Heating Type | Owner-occupied | Renter-occupied |
| Utility Gas | 41 (63.1%) | 13 (44.8%) |
| Bottled, Tank, or LP Gas | 1 (1.5%) | 1 (3.5%) |
| Electricity | 8 (12.3%) | 15 (51.7%) |
| Fuel Oil or Kerosene | 2 (3.1%) | 0 (0.0%) |
| Coal or Coke | 0 (0.0%) | 0 (0.0%) |
| All other Fuels | 12 (18.5%) | 0 (0.0%) |
| No Fuel Used | 1 (1.5%) | 0 (0.0%) |
| Total | 65 (100.0%) | 29 (100.0%) |
Household Vehicle Usage in Union Center
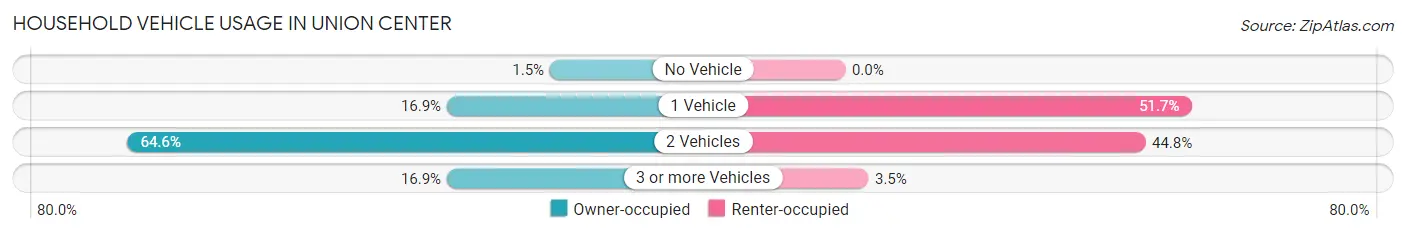
| Vehicles per Household | Owner-occupied | Renter-occupied |
| No Vehicle | 1 (1.5%) | 0 (0.0%) |
| 1 Vehicle | 11 (16.9%) | 15 (51.7%) |
| 2 Vehicles | 42 (64.6%) | 13 (44.8%) |
| 3 or more Vehicles | 11 (16.9%) | 1 (3.5%) |
| Total | 65 (100.0%) | 29 (100.0%) |
Real Estate & Mortgages in Union Center
Real Estate and Mortgage Overview in Union Center
| Characteristic | Without Mortgage | With Mortgage |
| Housing Units | 25 | 40 |
| Median Property Value | $137,500 | $100,000 |
| Median Household Income | $63,750 | $3 |
| Monthly Housing Costs | $450 | $2 |
| Real Estate Taxes | $2,250 | $0 |
Property Value by Mortgage Status in Union Center
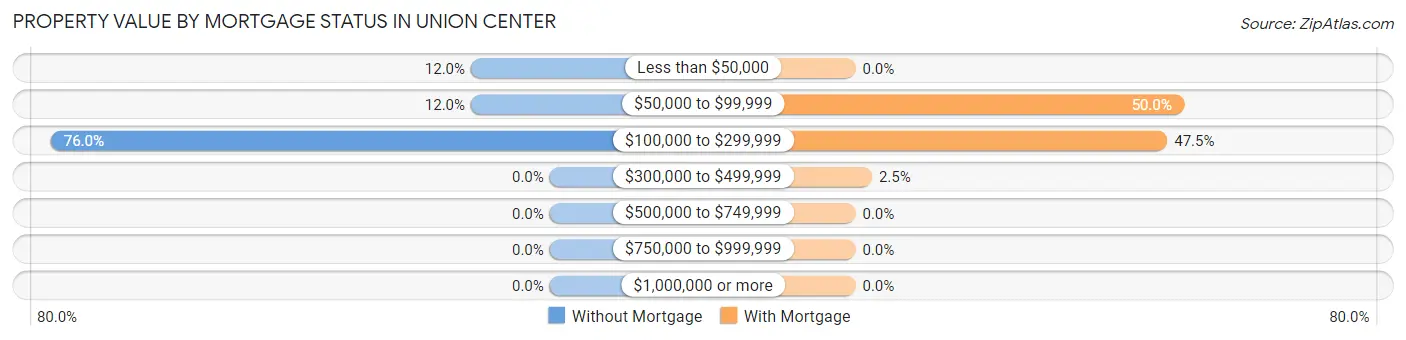
| Property Value | Without Mortgage | With Mortgage |
| Less than $50,000 | 3 (12.0%) | 0 (0.0%) |
| $50,000 to $99,999 | 3 (12.0%) | 20 (50.0%) |
| $100,000 to $299,999 | 19 (76.0%) | 19 (47.5%) |
| $300,000 to $499,999 | 0 (0.0%) | 1 (2.5%) |
| $500,000 to $749,999 | 0 (0.0%) | 0 (0.0%) |
| $750,000 to $999,999 | 0 (0.0%) | 0 (0.0%) |
| $1,000,000 or more | 0 (0.0%) | 0 (0.0%) |
| Total | 25 (100.0%) | 40 (100.0%) |
Household Income by Mortgage Status in Union Center
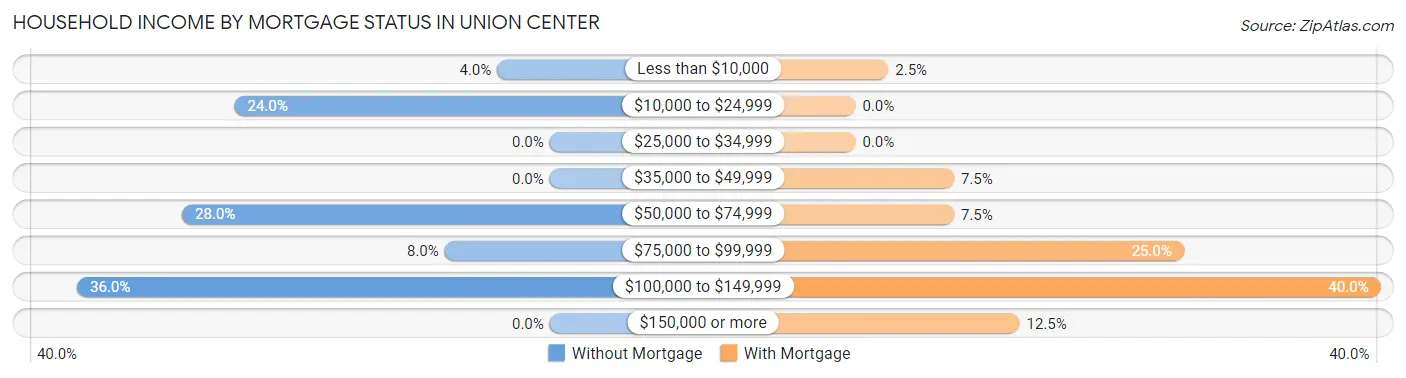
| Household Income | Without Mortgage | With Mortgage |
| Less than $10,000 | 1 (4.0%) | 1 (2.5%) |
| $10,000 to $24,999 | 6 (24.0%) | 0 (0.0%) |
| $25,000 to $34,999 | 0 (0.0%) | 0 (0.0%) |
| $35,000 to $49,999 | 0 (0.0%) | 3 (7.5%) |
| $50,000 to $74,999 | 7 (28.0%) | 3 (7.5%) |
| $75,000 to $99,999 | 2 (8.0%) | 10 (25.0%) |
| $100,000 to $149,999 | 9 (36.0%) | 16 (40.0%) |
| $150,000 or more | 0 (0.0%) | 5 (12.5%) |
| Total | 25 (100.0%) | 40 (100.0%) |
Property Value to Household Income Ratio in Union Center
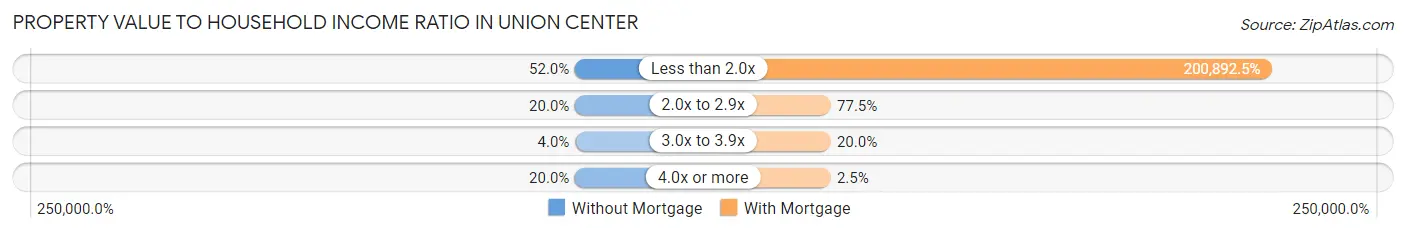
| Value-to-Income Ratio | Without Mortgage | With Mortgage |
| Less than 2.0x | 13 (52.0%) | 80,357 (200,892.5%) |
| 2.0x to 2.9x | 5 (20.0%) | 31 (77.5%) |
| 3.0x to 3.9x | 1 (4.0%) | 8 (20.0%) |
| 4.0x or more | 5 (20.0%) | 1 (2.5%) |
| Total | 25 (100.0%) | 40 (100.0%) |
Real Estate Taxes by Mortgage Status in Union Center
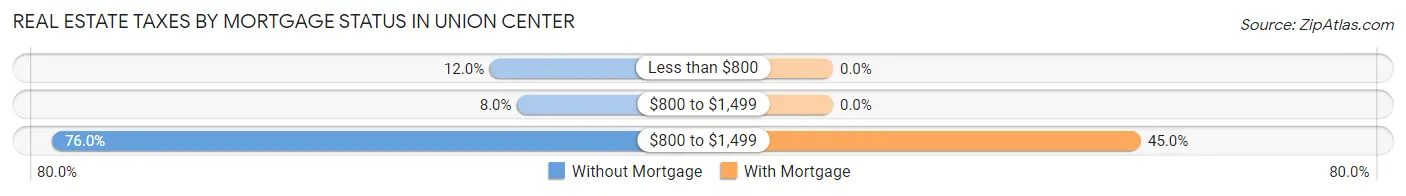
| Property Taxes | Without Mortgage | With Mortgage |
| Less than $800 | 3 (12.0%) | 0 (0.0%) |
| $800 to $1,499 | 2 (8.0%) | 0 (0.0%) |
| $800 to $1,499 | 19 (76.0%) | 18 (45.0%) |
| Total | 25 (100.0%) | 40 (100.0%) |
Health & Disability in Union Center
Health Insurance Coverage by Age in Union Center
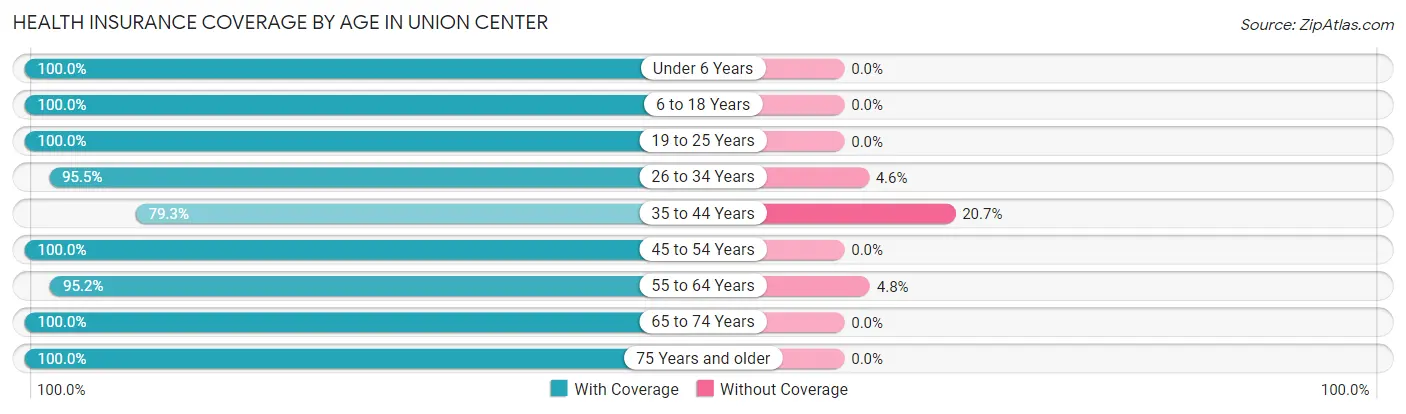
| Age Bracket | With Coverage | Without Coverage |
| Under 6 Years | 30 (100.0%) | 0 (0.0%) |
| 6 to 18 Years | 25 (100.0%) | 0 (0.0%) |
| 19 to 25 Years | 15 (100.0%) | 0 (0.0%) |
| 26 to 34 Years | 21 (95.5%) | 1 (4.5%) |
| 35 to 44 Years | 23 (79.3%) | 6 (20.7%) |
| 45 to 54 Years | 18 (100.0%) | 0 (0.0%) |
| 55 to 64 Years | 40 (95.2%) | 2 (4.8%) |
| 65 to 74 Years | 23 (100.0%) | 0 (0.0%) |
| 75 Years and older | 8 (100.0%) | 0 (0.0%) |
| Total | 203 (95.8%) | 9 (4.3%) |
Health Insurance Coverage by Citizenship Status in Union Center
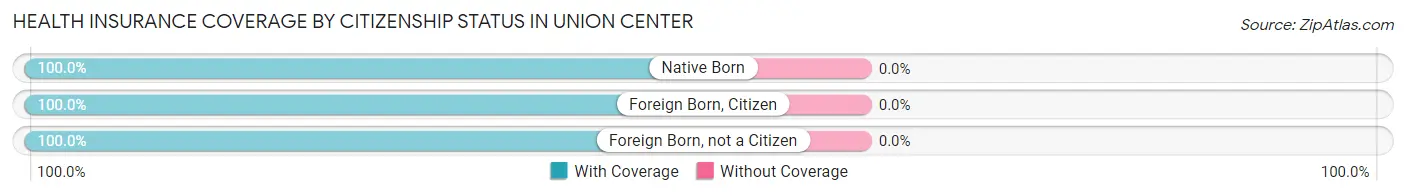
| Citizenship Status | With Coverage | Without Coverage |
| Native Born | 30 (100.0%) | 0 (0.0%) |
| Foreign Born, Citizen | 25 (100.0%) | 0 (0.0%) |
| Foreign Born, not a Citizen | 15 (100.0%) | 0 (0.0%) |
Health Insurance Coverage by Household Income in Union Center
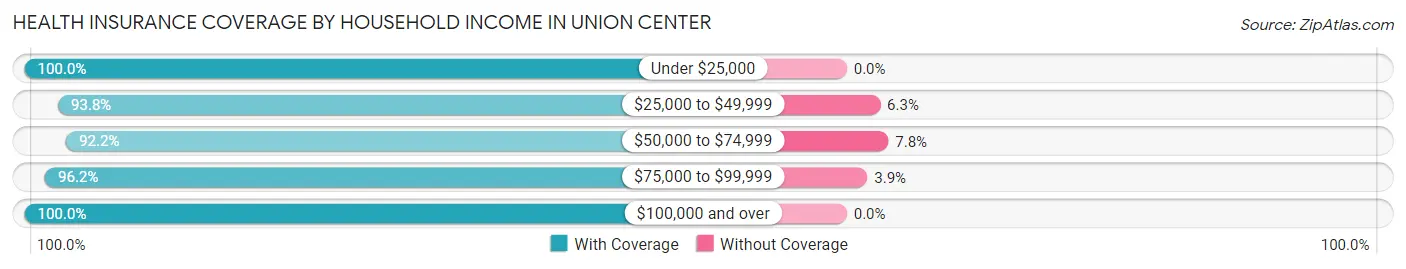
| Household Income | With Coverage | Without Coverage |
| Under $25,000 | 13 (100.0%) | 0 (0.0%) |
| $25,000 to $49,999 | 15 (93.8%) | 1 (6.2%) |
| $50,000 to $74,999 | 71 (92.2%) | 6 (7.8%) |
| $75,000 to $99,999 | 50 (96.2%) | 2 (3.8%) |
| $100,000 and over | 54 (100.0%) | 0 (0.0%) |
Public vs Private Health Insurance Coverage by Age in Union Center
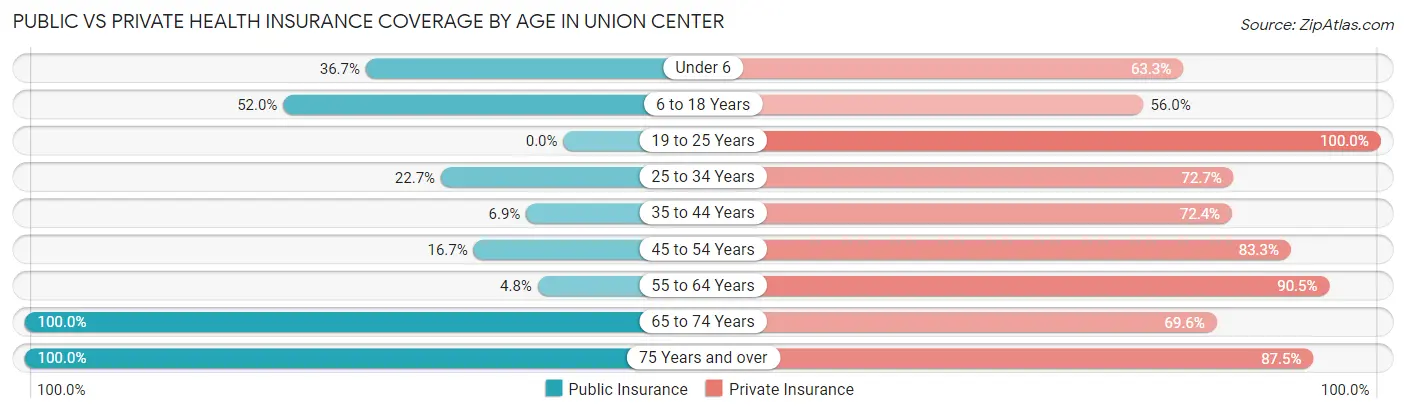
| Age Bracket | Public Insurance | Private Insurance |
| Under 6 | 11 (36.7%) | 19 (63.3%) |
| 6 to 18 Years | 13 (52.0%) | 14 (56.0%) |
| 19 to 25 Years | 0 (0.0%) | 15 (100.0%) |
| 25 to 34 Years | 5 (22.7%) | 16 (72.7%) |
| 35 to 44 Years | 2 (6.9%) | 21 (72.4%) |
| 45 to 54 Years | 3 (16.7%) | 15 (83.3%) |
| 55 to 64 Years | 2 (4.8%) | 38 (90.5%) |
| 65 to 74 Years | 23 (100.0%) | 16 (69.6%) |
| 75 Years and over | 8 (100.0%) | 7 (87.5%) |
| Total | 67 (31.6%) | 161 (75.9%) |
Disability Status by Sex by Age in Union Center
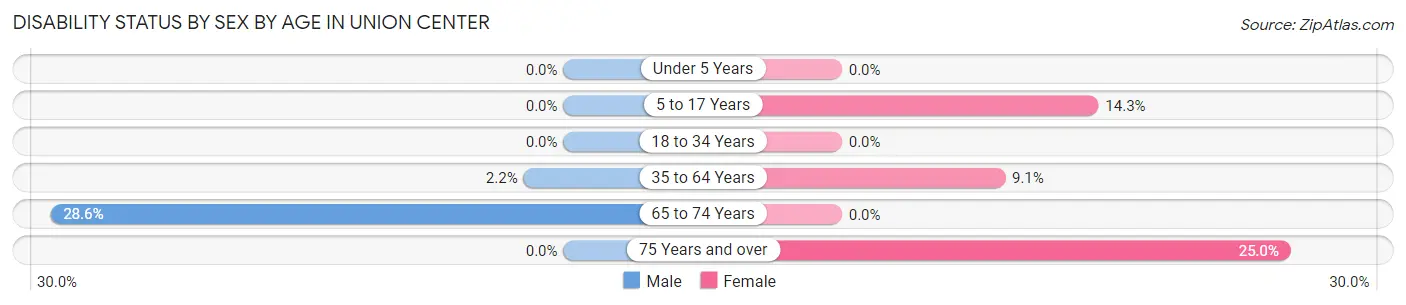
| Age Bracket | Male | Female |
| Under 5 Years | 0 (0.0%) | 0 (0.0%) |
| 5 to 17 Years | 0 (0.0%) | 2 (14.3%) |
| 18 to 34 Years | 0 (0.0%) | 0 (0.0%) |
| 35 to 64 Years | 1 (2.2%) | 4 (9.1%) |
| 65 to 74 Years | 4 (28.6%) | 0 (0.0%) |
| 75 Years and over | 0 (0.0%) | 1 (25.0%) |
Disability Class by Sex by Age in Union Center
Disability Class: Hearing Difficulty
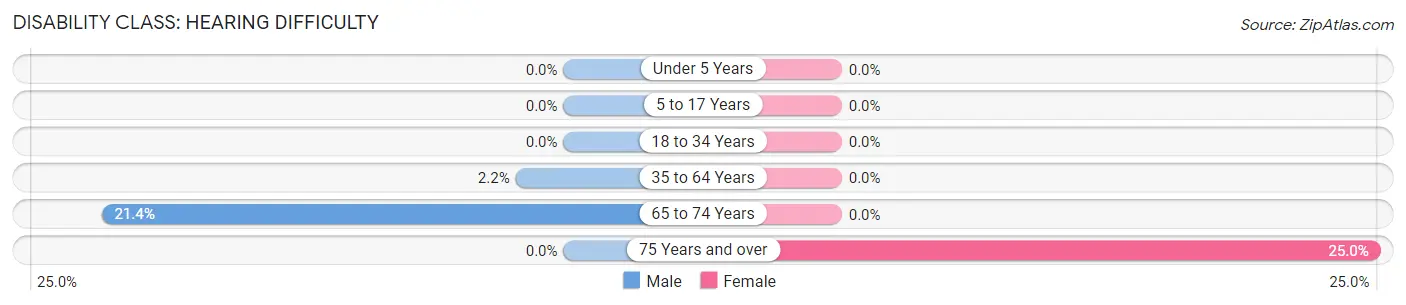
| Age Bracket | Male | Female |
| Under 5 Years | 0 (0.0%) | 0 (0.0%) |
| 5 to 17 Years | 0 (0.0%) | 0 (0.0%) |
| 18 to 34 Years | 0 (0.0%) | 0 (0.0%) |
| 35 to 64 Years | 1 (2.2%) | 0 (0.0%) |
| 65 to 74 Years | 3 (21.4%) | 0 (0.0%) |
| 75 Years and over | 0 (0.0%) | 1 (25.0%) |
Disability Class: Vision Difficulty
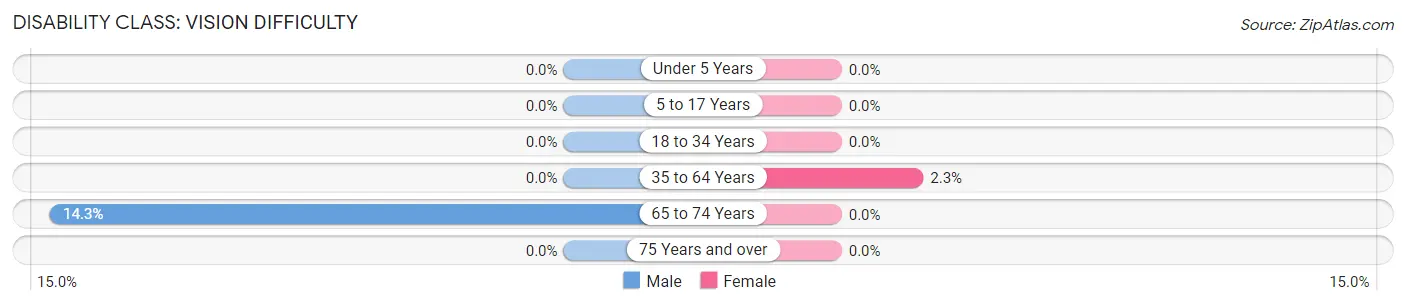
| Age Bracket | Male | Female |
| Under 5 Years | 0 (0.0%) | 0 (0.0%) |
| 5 to 17 Years | 0 (0.0%) | 0 (0.0%) |
| 18 to 34 Years | 0 (0.0%) | 0 (0.0%) |
| 35 to 64 Years | 0 (0.0%) | 1 (2.3%) |
| 65 to 74 Years | 2 (14.3%) | 0 (0.0%) |
| 75 Years and over | 0 (0.0%) | 0 (0.0%) |
Disability Class: Cognitive Difficulty
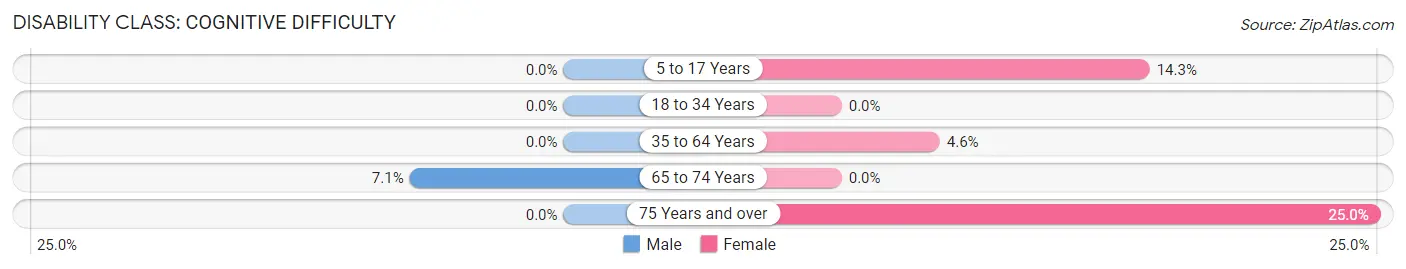
| Age Bracket | Male | Female |
| 5 to 17 Years | 0 (0.0%) | 2 (14.3%) |
| 18 to 34 Years | 0 (0.0%) | 0 (0.0%) |
| 35 to 64 Years | 0 (0.0%) | 2 (4.5%) |
| 65 to 74 Years | 1 (7.1%) | 0 (0.0%) |
| 75 Years and over | 0 (0.0%) | 1 (25.0%) |
Disability Class: Ambulatory Difficulty
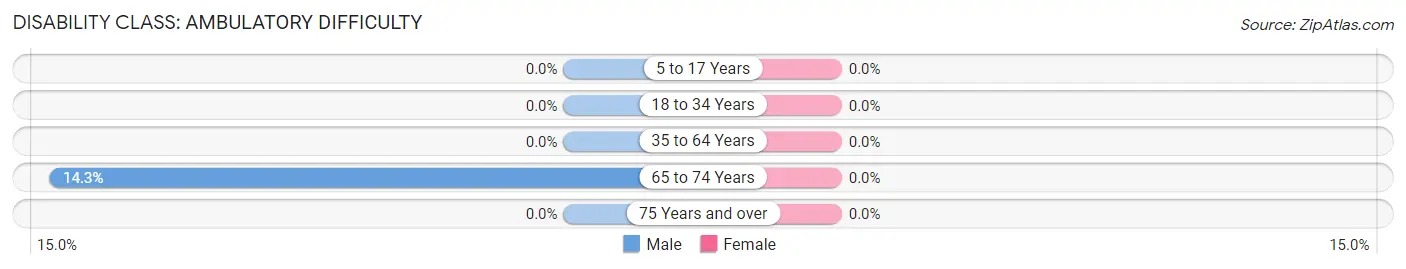
| Age Bracket | Male | Female |
| 5 to 17 Years | 0 (0.0%) | 0 (0.0%) |
| 18 to 34 Years | 0 (0.0%) | 0 (0.0%) |
| 35 to 64 Years | 0 (0.0%) | 0 (0.0%) |
| 65 to 74 Years | 2 (14.3%) | 0 (0.0%) |
| 75 Years and over | 0 (0.0%) | 0 (0.0%) |
Disability Class: Self-Care Difficulty
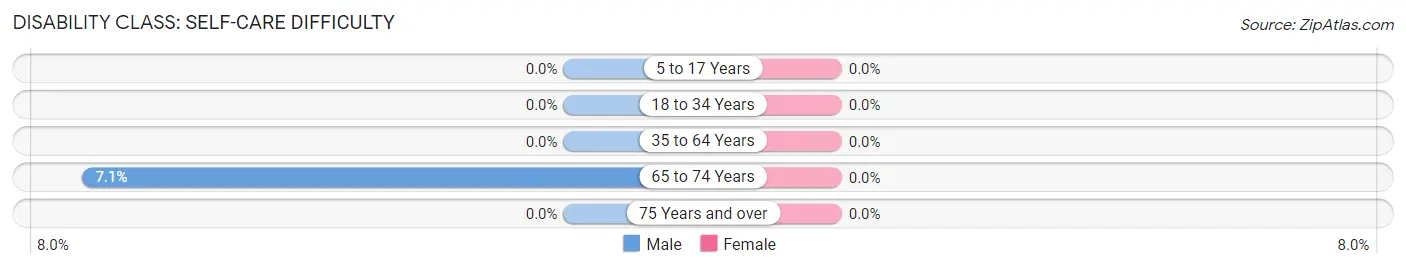
| Age Bracket | Male | Female |
| 5 to 17 Years | 0 (0.0%) | 0 (0.0%) |
| 18 to 34 Years | 0 (0.0%) | 0 (0.0%) |
| 35 to 64 Years | 0 (0.0%) | 0 (0.0%) |
| 65 to 74 Years | 1 (7.1%) | 0 (0.0%) |
| 75 Years and over | 0 (0.0%) | 0 (0.0%) |
Technology Access in Union Center
Computing Device Access in Union Center
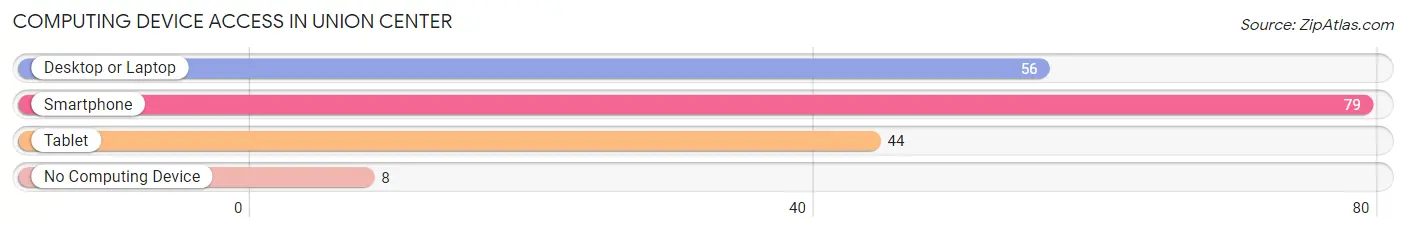
| Device Type | # Households | % Households |
| Desktop or Laptop | 56 | 59.6% |
| Smartphone | 79 | 84.0% |
| Tablet | 44 | 46.8% |
| No Computing Device | 8 | 8.5% |
| Total | 94 | 100.0% |
Internet Access in Union Center
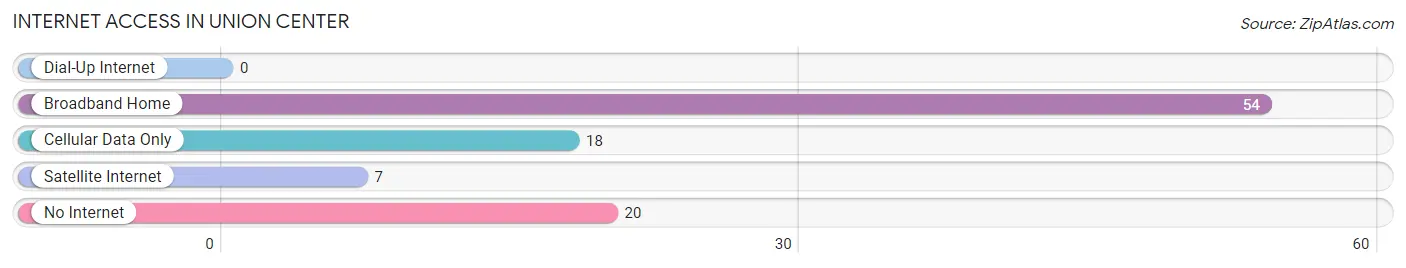
| Internet Type | # Households | % Households |
| Dial-Up Internet | 0 | 0.0% |
| Broadband Home | 54 | 57.5% |
| Cellular Data Only | 18 | 19.2% |
| Satellite Internet | 7 | 7.4% |
| No Internet | 20 | 21.3% |
| Total | 94 | 100.0% |
Union Center Summary
Union Center is a small unincorporated community located in Sauk County, Wisconsin, United States. It is situated in the Town of Union, approximately 8 miles south of Baraboo and 8 miles north of Reedsburg. The population of Union Center was estimated to be around 200 in 2020.
History
Union Center was first settled in the early 1840s by a group of German immigrants. The town was originally known as Unionville, but the name was changed to Union Center in 1856. The town was named for its location at the intersection of two major roads, the Wisconsin Central Railroad and the Wisconsin and Minnesota Railroad.
The town was a popular stop for travelers and settlers, and soon became a thriving community. In 1871, the Union Center post office was established, and the town was officially incorporated in 1876.
In the late 19th century, Union Center was a major center for the dairy industry. The town was home to several cheese factories, and the Union Center Creamery was one of the largest in the state. The creamery was destroyed by fire in 1895, but was rebuilt and continued to operate until the early 20th century.
Geography
Union Center is located in the Town of Union, in Sauk County, Wisconsin. It is situated at the intersection of two major roads, the Wisconsin Central Railroad and the Wisconsin and Minnesota Railroad. The town is located 8 miles south of Baraboo and 8 miles north of Reedsburg.
The terrain around Union Center is mostly flat, with some rolling hills. The town is located in the Baraboo Valley, which is part of the Driftless Area. The area is known for its scenic beauty, with rolling hills, valleys, and forests.
Economy
The economy of Union Center is largely based on agriculture. The town is home to several dairy farms, as well as a number of small businesses. The town is also home to a few small manufacturing companies, including a furniture factory and a woodworking shop.
The town is also home to a number of tourist attractions, including the Union Center Historical Museum, the Union Center Cheese Factory, and the Union Center Creamery.
Demographics
As of the 2010 census, the population of Union Center was estimated to be around 200. The racial makeup of the town was 97.5% White, 0.5% African American, 0.5% Native American, 0.5% Asian, and 1.0% from other races.
The median household income in Union Center was estimated to be $45,000 in 2020. The median home value was estimated to be $150,000. The town has a high rate of homeownership, with over 90% of residents owning their own homes.
Conclusion
Union Center is a small unincorporated community located in Sauk County, Wisconsin. It is situated at the intersection of two major roads, the Wisconsin Central Railroad and the Wisconsin and Minnesota Railroad. The town was first settled in the early 1840s by a group of German immigrants, and was officially incorporated in 1876. The economy of Union Center is largely based on agriculture, with several dairy farms and small businesses. The population of Union Center was estimated to be around 200 in 2020, with a median household income of $45,000 and a median home value of $150,000.
Common Questions
What is Per Capita Income in Union Center?
Per Capita income in Union Center is $35,500.
What is the Median Family Income in Union Center?
Median Family Income in Union Center is $80,833.
What is the Median Household income in Union Center?
Median Household Income in Union Center is $70,833.
What is Income or Wage Gap in Union Center?
Income or Wage Gap in Union Center is 25.9%.
Women in Union Center earn 74.1 cents for every dollar earned by a man.
What is Inequality or Gini Index in Union Center?
Inequality or Gini Index in Union Center is 0.32.
What is the Total Population of Union Center?
Total Population of Union Center is 212.
What is the Total Male Population of Union Center?
Total Male Population of Union Center is 94.
What is the Total Female Population of Union Center?
Total Female Population of Union Center is 118.
What is the Ratio of Males per 100 Females in Union Center?
There are 79.66 Males per 100 Females in Union Center.
What is the Ratio of Females per 100 Males in Union Center?
There are 125.53 Females per 100 Males in Union Center.
What is the Median Population Age in Union Center?
Median Population Age in Union Center is 40.1 Years.
What is the Average Family Size in Union Center
Average Family Size in Union Center is 2.9 People.
What is the Average Household Size in Union Center
Average Household Size in Union Center is 2.3 People.
How Large is the Labor Force in Union Center?
There are 123 People in the Labor Forcein in Union Center.
What is the Percentage of People in the Labor Force in Union Center?
78.3% of People are in the Labor Force in Union Center.