Newburg, WI Map & Demographics
Newburg Map
Newburg Overview
$36,630
PER CAPITA INCOME
$91,389
AVG FAMILY INCOME
$68,882
AVG HOUSEHOLD INCOME
47.8%
WAGE / INCOME GAP [ % ]
52.2¢/ $1
WAGE / INCOME GAP [ $ ]
0.36
INEQUALITY / GINI INDEX
1,306
TOTAL POPULATION
591
MALE POPULATION
715
FEMALE POPULATION
82.66
MALES / 100 FEMALES
120.98
FEMALES / 100 MALES
39.3
MEDIAN AGE
3.0
AVG FAMILY SIZE
2.5
AVG HOUSEHOLD SIZE
742
LABOR FORCE [ PEOPLE ]
74.0%
PERCENT IN LABOR FORCE
3.5%
UNEMPLOYMENT RATE
Newburg Area Codes
Income in Newburg
Income Overview in Newburg
Per Capita Income in Newburg is $36,630, while median incomes of families and households are $91,389 and $68,882 respectively.
| Characteristic | Number | Measure |
| Per Capita Income | 1,306 | $36,630 |
| Median Family Income | 378 | $91,389 |
| Mean Family Income | 378 | $102,173 |
| Median Household Income | 515 | $68,882 |
| Mean Household Income | 515 | $91,986 |
| Income Deficit | 378 | $0 |
| Wage / Income Gap (%) | 1,306 | 47.75% |
| Wage / Income Gap ($) | 1,306 | 52.25¢ per $1 |
| Gini / Inequality Index | 1,306 | 0.36 |
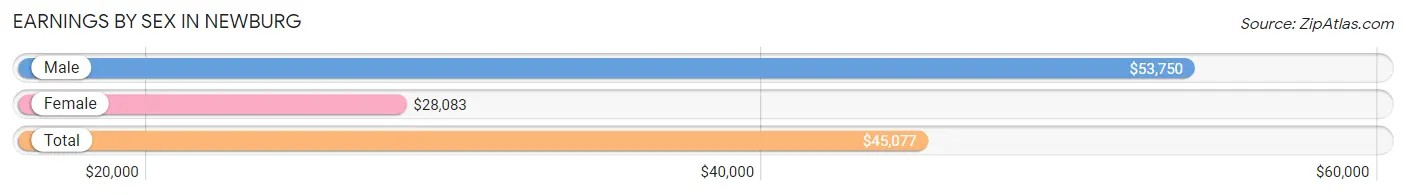
Earnings by Sex in Newburg
Average Earnings in Newburg are $45,077, $53,750 for men and $28,083 for women, a difference of 47.7%.
| Sex | Number | Average Earnings |
| Male | 414 (51.4%) | $53,750 |
| Female | 391 (48.6%) | $28,083 |
| Total | 805 (100.0%) | $45,077 |
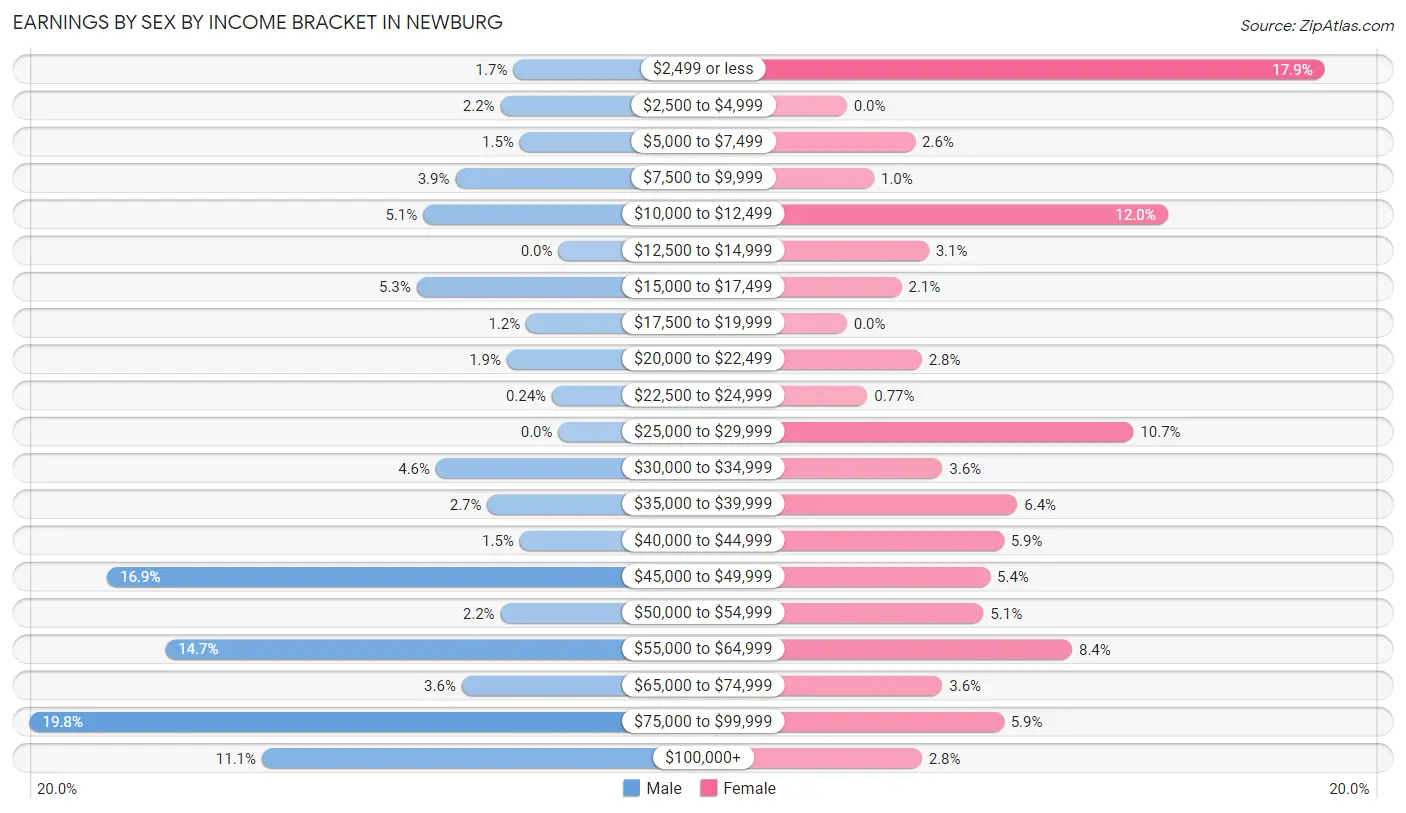
Earnings by Sex by Income Bracket in Newburg
The most common earnings brackets in Newburg are $75,000 to $99,999 for men (82 | 19.8%) and $2,499 or less for women (70 | 17.9%).
| Income | Male | Female |
| $2,499 or less | 7 (1.7%) | 70 (17.9%) |
| $2,500 to $4,999 | 9 (2.2%) | 0 (0.0%) |
| $5,000 to $7,499 | 6 (1.5%) | 10 (2.6%) |
| $7,500 to $9,999 | 16 (3.9%) | 4 (1.0%) |
| $10,000 to $12,499 | 21 (5.1%) | 47 (12.0%) |
| $12,500 to $14,999 | 0 (0.0%) | 12 (3.1%) |
| $15,000 to $17,499 | 22 (5.3%) | 8 (2.1%) |
| $17,500 to $19,999 | 5 (1.2%) | 0 (0.0%) |
| $20,000 to $22,499 | 8 (1.9%) | 11 (2.8%) |
| $22,500 to $24,999 | 1 (0.2%) | 3 (0.8%) |
| $25,000 to $29,999 | 0 (0.0%) | 42 (10.7%) |
| $30,000 to $34,999 | 19 (4.6%) | 14 (3.6%) |
| $35,000 to $39,999 | 11 (2.7%) | 25 (6.4%) |
| $40,000 to $44,999 | 6 (1.5%) | 23 (5.9%) |
| $45,000 to $49,999 | 70 (16.9%) | 21 (5.4%) |
| $50,000 to $54,999 | 9 (2.2%) | 20 (5.1%) |
| $55,000 to $64,999 | 61 (14.7%) | 33 (8.4%) |
| $65,000 to $74,999 | 15 (3.6%) | 14 (3.6%) |
| $75,000 to $99,999 | 82 (19.8%) | 23 (5.9%) |
| $100,000+ | 46 (11.1%) | 11 (2.8%) |
| Total | 414 (100.0%) | 391 (100.0%) |
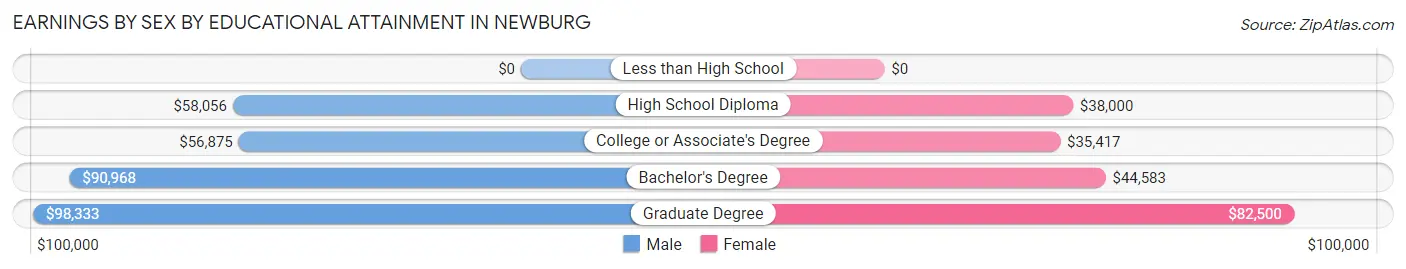
Earnings by Sex by Educational Attainment in Newburg
Average earnings in Newburg are $63,393 for men and $38,816 for women, a difference of 38.8%. Men with an educational attainment of graduate degree enjoy the highest average annual earnings of $98,333, while those with college or associate's degree education earn the least with $56,875. Women with an educational attainment of graduate degree earn the most with the average annual earnings of $82,500, while those with college or associate's degree education have the smallest earnings of $35,417.
| Educational Attainment | Male Income | Female Income |
| Less than High School | - | - |
| High School Diploma | $58,056 | $38,000 |
| College or Associate's Degree | $56,875 | $35,417 |
| Bachelor's Degree | $90,968 | $44,583 |
| Graduate Degree | $98,333 | $82,500 |
| Total | $63,393 | $38,816 |
Family Income in Newburg
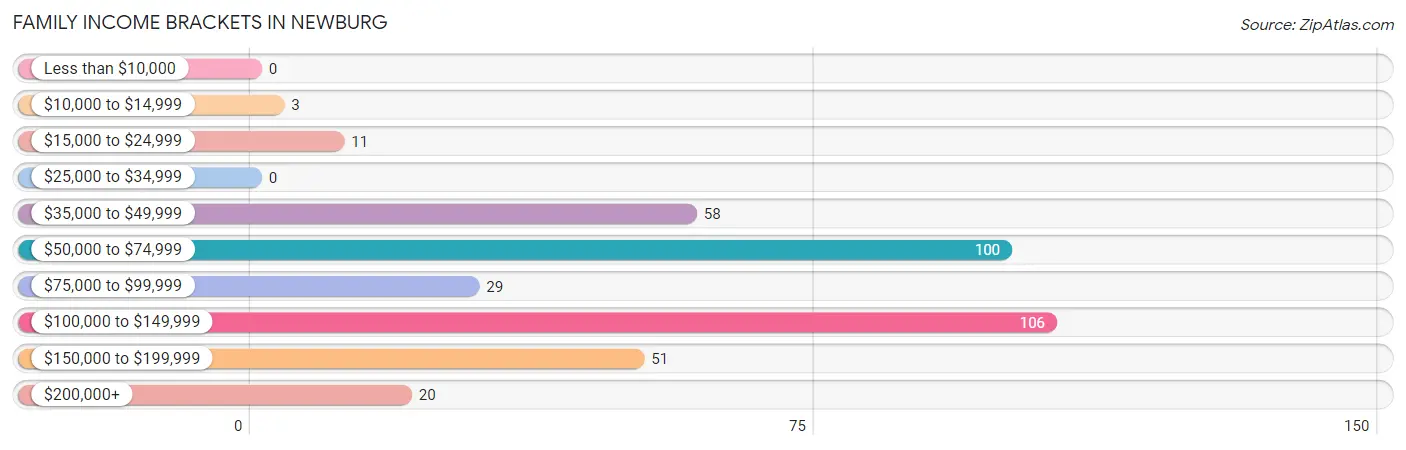
Family Income Brackets in Newburg
According to the Newburg family income data, there are 106 families falling into the $100,000 to $149,999 income range, which is the most common income bracket and makes up 28.0% of all families.
| Income Bracket | # Families | % Families |
| Less than $10,000 | 0 | 0.0% |
| $10,000 to $14,999 | 3 | 0.8% |
| $15,000 to $24,999 | 11 | 2.9% |
| $25,000 to $34,999 | 0 | 0.0% |
| $35,000 to $49,999 | 58 | 15.3% |
| $50,000 to $74,999 | 100 | 26.5% |
| $75,000 to $99,999 | 29 | 7.7% |
| $100,000 to $149,999 | 106 | 28.0% |
| $150,000 to $199,999 | 51 | 13.5% |
| $200,000+ | 20 | 5.3% |
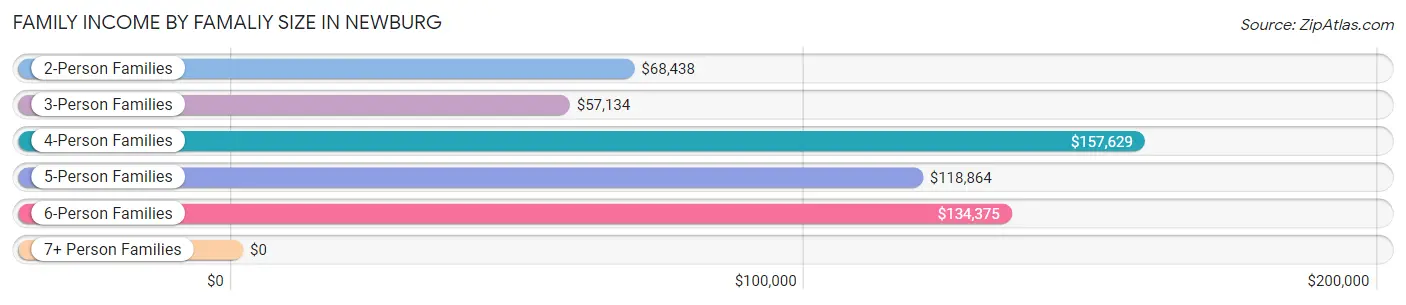
Family Income by Famaliy Size in Newburg
4-person families (73 | 19.3%) account for the highest median family income in Newburg with $157,629 per family, while 4-person families (73 | 19.3%) have the highest median income of $39,407 per family member.
| Income Bracket | # Families | Median Income |
| 2-Person Families | 172 (45.5%) | $68,438 |
| 3-Person Families | 98 (25.9%) | $57,134 |
| 4-Person Families | 73 (19.3%) | $157,629 |
| 5-Person Families | 26 (6.9%) | $118,864 |
| 6-Person Families | 9 (2.4%) | $134,375 |
| 7+ Person Families | 0 (0.0%) | $0 |
| Total | 378 (100.0%) | $91,389 |
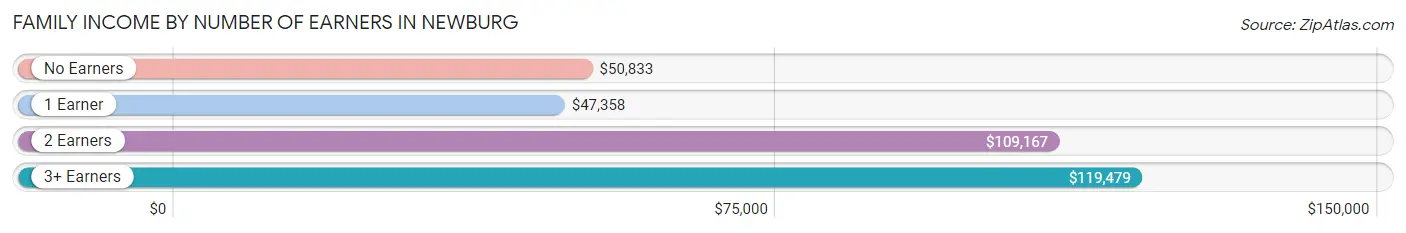
Family Income by Number of Earners in Newburg
The median family income in Newburg is $91,389, with families comprising 3+ earners (47) having the highest median family income of $119,479, while families with 1 earner (89) have the lowest median family income of $47,358, accounting for 12.4% and 23.5% of families, respectively.
| Number of Earners | # Families | Median Income |
| No Earners | 24 (6.4%) | $50,833 |
| 1 Earner | 89 (23.5%) | $47,358 |
| 2 Earners | 218 (57.7%) | $109,167 |
| 3+ Earners | 47 (12.4%) | $119,479 |
| Total | 378 (100.0%) | $91,389 |
Household Income in Newburg
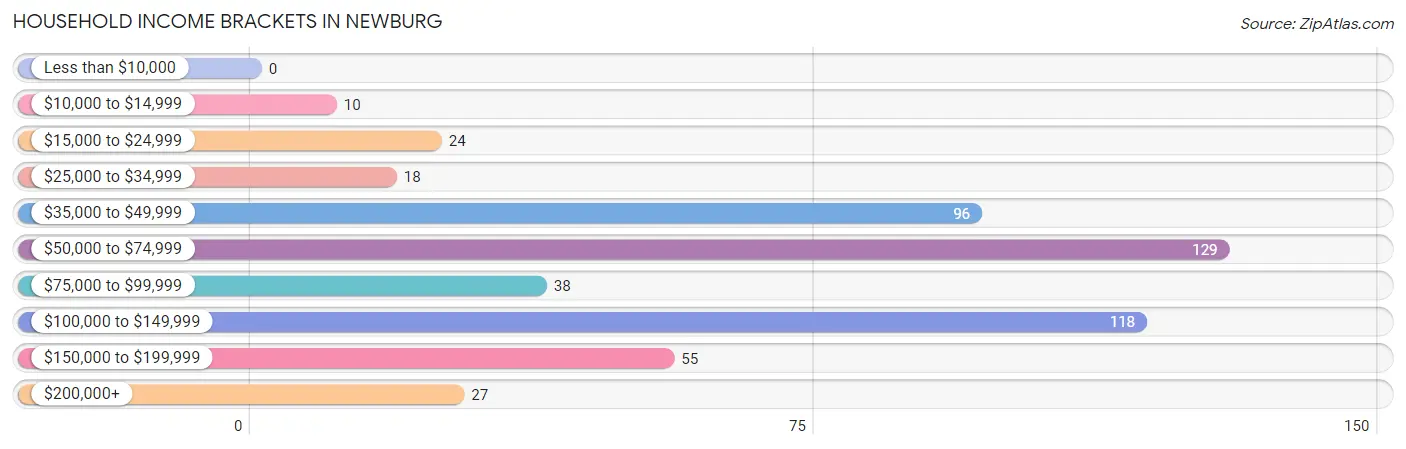
Household Income Brackets in Newburg
With 129 households falling in the category, the $50,000 to $74,999 income range is the most frequent in Newburg, accounting for 25.1% of all households.
| Income Bracket | # Households | % Households |
| Less than $10,000 | 0 | 0.0% |
| $10,000 to $14,999 | 10 | 1.9% |
| $15,000 to $24,999 | 24 | 4.7% |
| $25,000 to $34,999 | 18 | 3.5% |
| $35,000 to $49,999 | 96 | 18.6% |
| $50,000 to $74,999 | 129 | 25.0% |
| $75,000 to $99,999 | 38 | 7.4% |
| $100,000 to $149,999 | 118 | 22.9% |
| $150,000 to $199,999 | 55 | 10.7% |
| $200,000+ | 27 | 5.2% |
Household Income by Householder Age in Newburg
The median household income in Newburg is $68,882, with the highest median household income of $117,500 found in the 45 to 64 years age bracket for the primary householder. A total of 214 households (41.5%) fall into this category. Meanwhile, the 15 to 24 years age bracket for the primary householder has the lowest median household income of $0, with 41 households (8.0%) in this group.
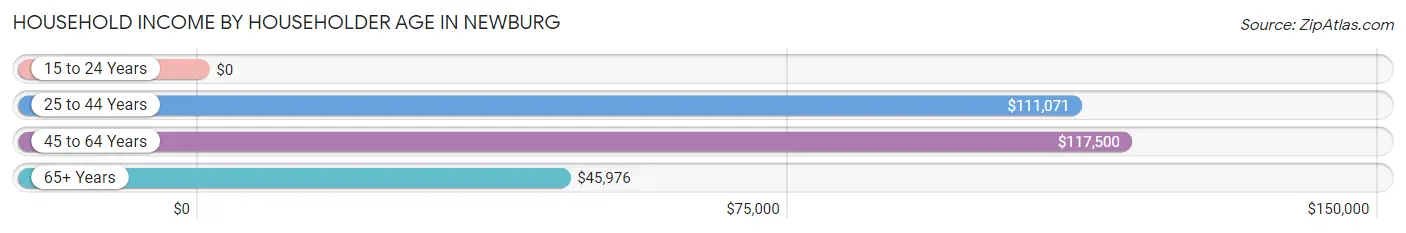
| Income Bracket | # Households | Median Income |
| 15 to 24 Years | 41 (8.0%) | $0 |
| 25 to 44 Years | 96 (18.6%) | $111,071 |
| 45 to 64 Years | 214 (41.5%) | $117,500 |
| 65+ Years | 164 (31.8%) | $45,976 |
| Total | 515 (100.0%) | $68,882 |
Poverty in Newburg
Income Below Poverty by Sex and Age in Newburg
With 3.7% poverty level for males and 4.3% for females among the residents of Newburg, 5 year old males and 16 and 17 year old females are the most vulnerable to poverty, with 9 males (100.0%) and 10 females (71.4%) in their respective age groups living below the poverty level.
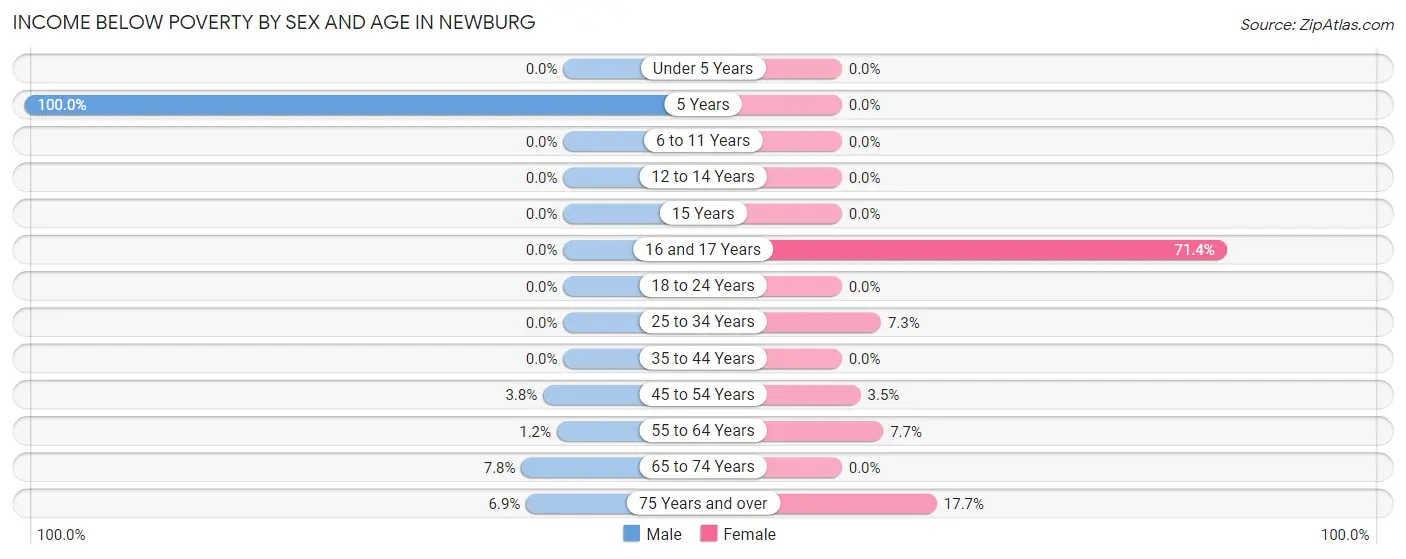
| Age Bracket | Male | Female |
| Under 5 Years | 0 (0.0%) | 0 (0.0%) |
| 5 Years | 9 (100.0%) | 0 (0.0%) |
| 6 to 11 Years | 0 (0.0%) | 0 (0.0%) |
| 12 to 14 Years | 0 (0.0%) | 0 (0.0%) |
| 15 Years | 0 (0.0%) | 0 (0.0%) |
| 16 and 17 Years | 0 (0.0%) | 10 (71.4%) |
| 18 to 24 Years | 0 (0.0%) | 0 (0.0%) |
| 25 to 34 Years | 0 (0.0%) | 4 (7.3%) |
| 35 to 44 Years | 0 (0.0%) | 0 (0.0%) |
| 45 to 54 Years | 4 (3.8%) | 3 (3.5%) |
| 55 to 64 Years | 1 (1.2%) | 8 (7.7%) |
| 65 to 74 Years | 6 (7.8%) | 0 (0.0%) |
| 75 Years and over | 2 (6.9%) | 6 (17.6%) |
| Total | 22 (3.7%) | 31 (4.3%) |
Income Above Poverty by Sex and Age in Newburg
According to the poverty statistics in Newburg, males aged under 5 years and females aged under 5 years are the age groups that are most secure financially, with 100.0% of males and 100.0% of females in these age groups living above the poverty line.
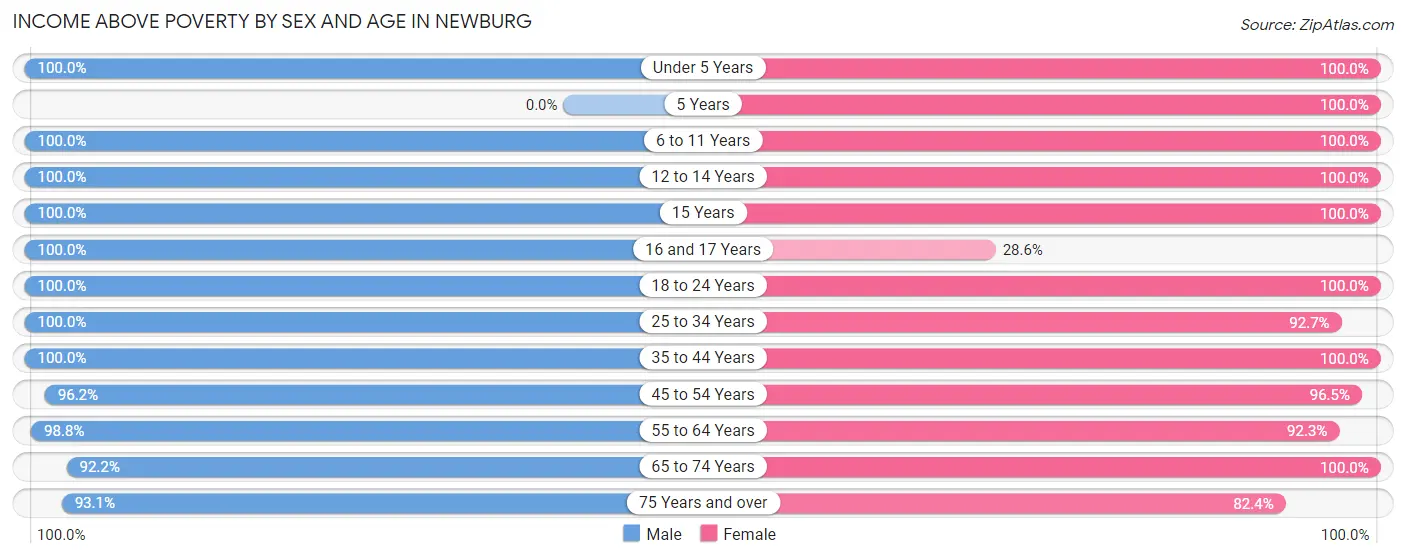
| Age Bracket | Male | Female |
| Under 5 Years | 16 (100.0%) | 140 (100.0%) |
| 5 Years | 0 (0.0%) | 3 (100.0%) |
| 6 to 11 Years | 29 (100.0%) | 43 (100.0%) |
| 12 to 14 Years | 27 (100.0%) | 26 (100.0%) |
| 15 Years | 3 (100.0%) | 5 (100.0%) |
| 16 and 17 Years | 12 (100.0%) | 4 (28.6%) |
| 18 to 24 Years | 103 (100.0%) | 75 (100.0%) |
| 25 to 34 Years | 44 (100.0%) | 51 (92.7%) |
| 35 to 44 Years | 53 (100.0%) | 50 (100.0%) |
| 45 to 54 Years | 102 (96.2%) | 83 (96.5%) |
| 55 to 64 Years | 82 (98.8%) | 96 (92.3%) |
| 65 to 74 Years | 71 (92.2%) | 78 (100.0%) |
| 75 Years and over | 27 (93.1%) | 28 (82.4%) |
| Total | 569 (96.3%) | 682 (95.7%) |
Income Below Poverty Among Married-Couple Families in Newburg
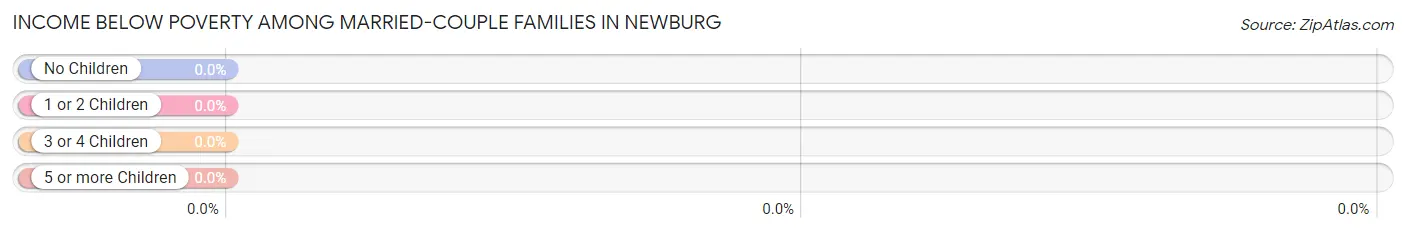
| Children | Above Poverty | Below Poverty |
| No Children | 174 (100.0%) | 0 (0.0%) |
| 1 or 2 Children | 145 (100.0%) | 0 (0.0%) |
| 3 or 4 Children | 11 (100.0%) | 0 (0.0%) |
| 5 or more Children | 0 (0.0%) | 0 (0.0%) |
| Total | 330 (100.0%) | 0 (0.0%) |
Income Below Poverty Among Single-Parent Households in Newburg
According to the poverty data in Newburg, 31.6% or 6 single-father households and 27.6% or 8 single-mother households are living below the poverty line. Among single-father households, those with no children have the highest poverty rate, with 6 households (60.0%) experiencing poverty. Likewise, among single-mother households, those with 1 or 2 children have the highest poverty rate, with 8 households (80.0%) falling below the poverty line.
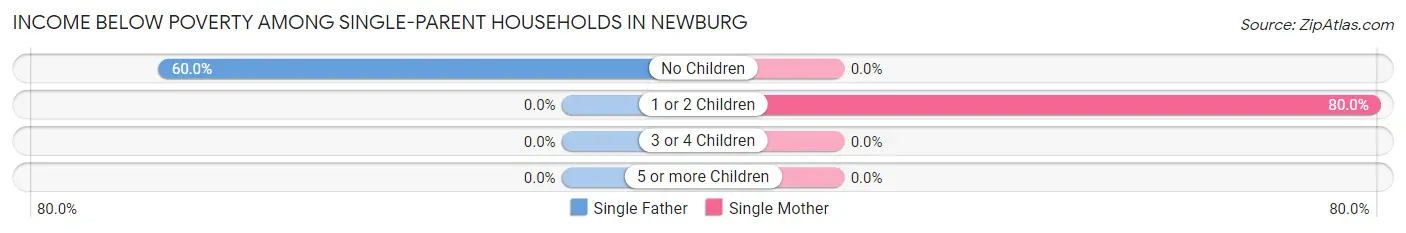
| Children | Single Father | Single Mother |
| No Children | 6 (60.0%) | 0 (0.0%) |
| 1 or 2 Children | 0 (0.0%) | 8 (80.0%) |
| 3 or 4 Children | 0 (0.0%) | 0 (0.0%) |
| 5 or more Children | 0 (0.0%) | 0 (0.0%) |
| Total | 6 (31.6%) | 8 (27.6%) |
Income Below Poverty Among Married-Couple vs Single-Parent Households in Newburg
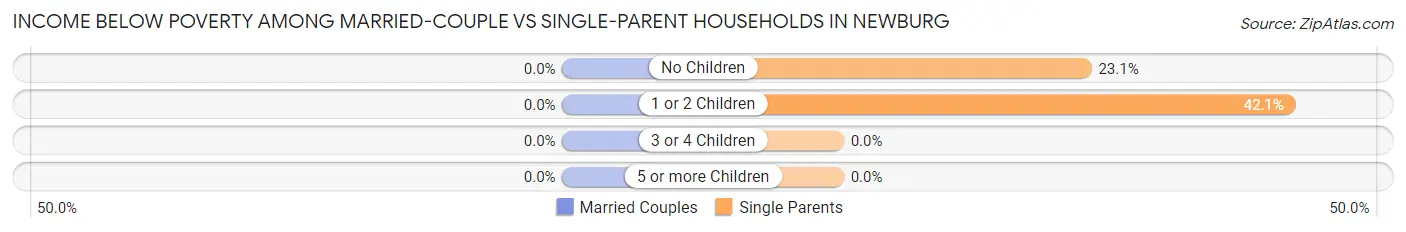
| Children | Married-Couple Families | Single-Parent Households |
| No Children | 0 (0.0%) | 6 (23.1%) |
| 1 or 2 Children | 0 (0.0%) | 8 (42.1%) |
| 3 or 4 Children | 0 (0.0%) | 0 (0.0%) |
| 5 or more Children | 0 (0.0%) | 0 (0.0%) |
| Total | 0 (0.0%) | 14 (29.2%) |
Race in Newburg
The most populous races in Newburg are White / Caucasian (1,269 | 97.2%), Hispanic or Latino (179 | 13.7%), and Two or more Races (20 | 1.5%).
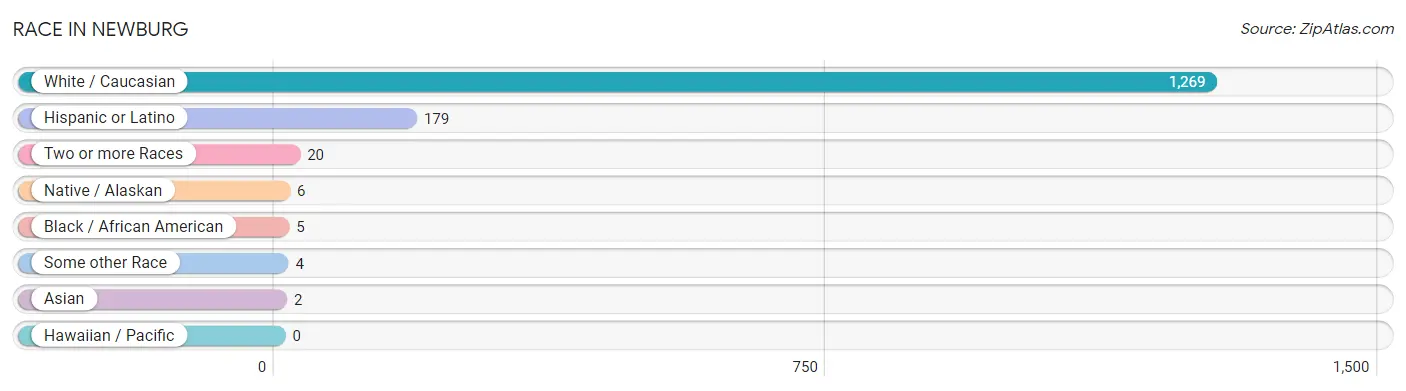
| Race | # Population | % Population |
| Asian | 2 | 0.2% |
| Black / African American | 5 | 0.4% |
| Hawaiian / Pacific | 0 | 0.0% |
| Hispanic or Latino | 179 | 13.7% |
| Native / Alaskan | 6 | 0.5% |
| White / Caucasian | 1,269 | 97.2% |
| Two or more Races | 20 | 1.5% |
| Some other Race | 4 | 0.3% |
| Total | 1,306 | 100.0% |
Ancestry in Newburg
The most populous ancestries reported in Newburg are German (613 | 46.9%), Mexican (179 | 13.7%), Irish (174 | 13.3%), Polish (125 | 9.6%), and English (75 | 5.7%), together accounting for 89.3% of all Newburg residents.
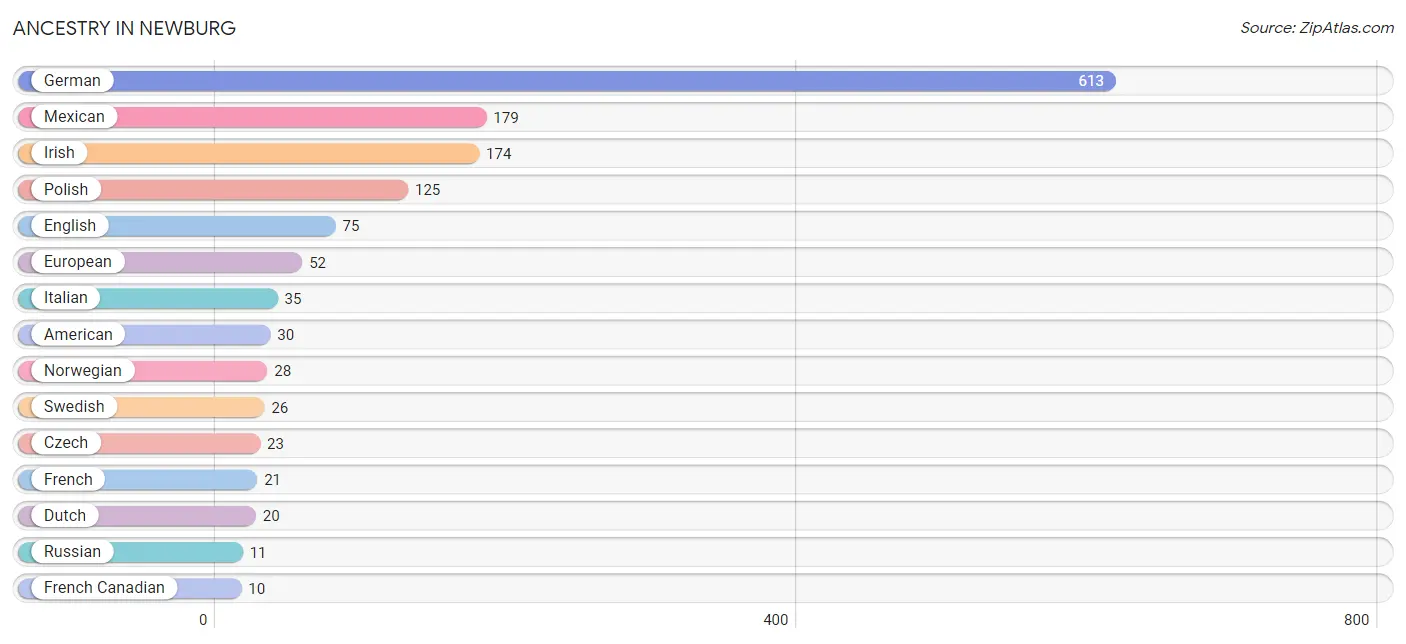
| Ancestry | # Population | % Population |
| American | 30 | 2.3% |
| Austrian | 3 | 0.2% |
| Chippewa | 2 | 0.2% |
| Croatian | 6 | 0.5% |
| Czech | 23 | 1.8% |
| Danish | 5 | 0.4% |
| Dutch | 20 | 1.5% |
| English | 75 | 5.7% |
| European | 52 | 4.0% |
| Finnish | 3 | 0.2% |
| French | 21 | 1.6% |
| French Canadian | 10 | 0.8% |
| German | 613 | 46.9% |
| Greek | 5 | 0.4% |
| Irish | 174 | 13.3% |
| Iroquois | 4 | 0.3% |
| Italian | 35 | 2.7% |
| Korean | 4 | 0.3% |
| Lithuanian | 3 | 0.2% |
| Mexican | 179 | 13.7% |
| Norwegian | 28 | 2.1% |
| Polish | 125 | 9.6% |
| Russian | 11 | 0.8% |
| Scandinavian | 3 | 0.2% |
| Scottish | 8 | 0.6% |
| Slavic | 4 | 0.3% |
| Slovak | 6 | 0.5% |
| Slovene | 5 | 0.4% |
| Swedish | 26 | 2.0% |
| Welsh | 3 | 0.2% | View All 30 Rows |
Immigrants in Newburg
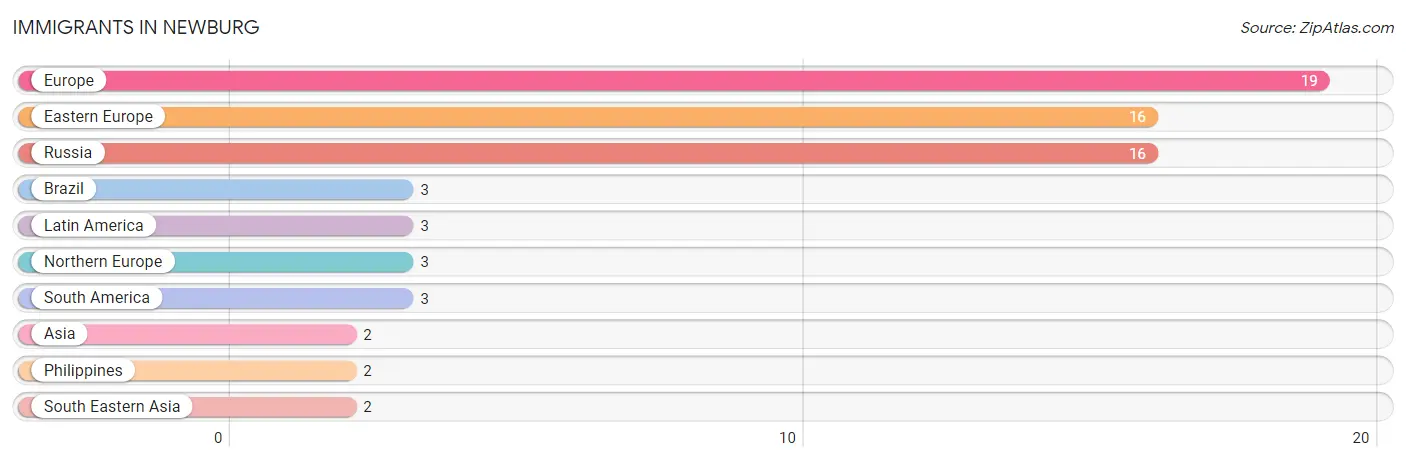
The most numerous immigrant groups reported in Newburg came from Europe (19 | 1.5%), Eastern Europe (16 | 1.2%), Russia (16 | 1.2%), Brazil (3 | 0.2%), and Latin America (3 | 0.2%), together accounting for 4.4% of all Newburg residents.
| Immigration Origin | # Population | % Population |
| Asia | 2 | 0.2% |
| Brazil | 3 | 0.2% |
| Eastern Europe | 16 | 1.2% |
| Europe | 19 | 1.5% |
| Latin America | 3 | 0.2% |
| Northern Europe | 3 | 0.2% |
| Philippines | 2 | 0.2% |
| Russia | 16 | 1.2% |
| South America | 3 | 0.2% |
| South Eastern Asia | 2 | 0.2% | View All 10 Rows |
Sex and Age in Newburg
Sex and Age in Newburg
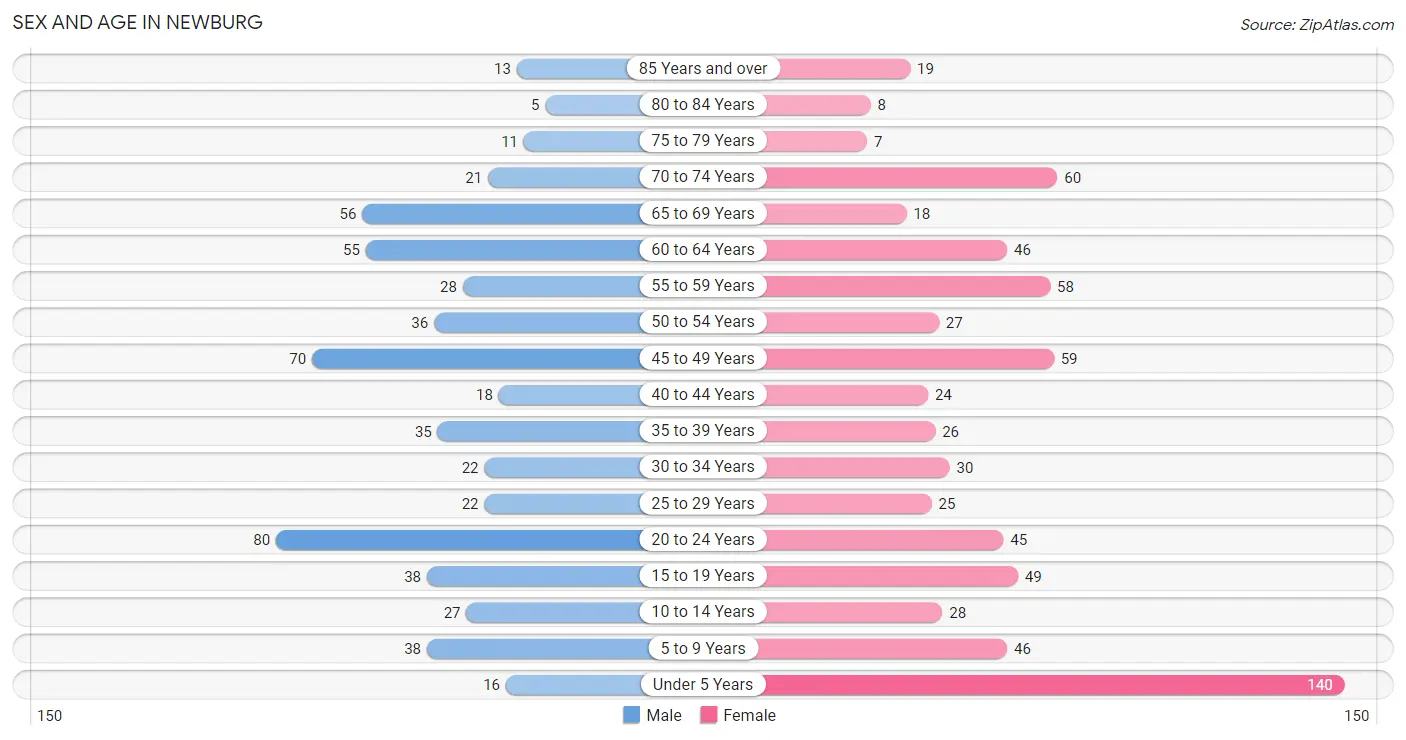
The most populous age groups in Newburg are 20 to 24 Years (80 | 13.5%) for men and Under 5 Years (140 | 19.6%) for women.
| Age Bracket | Male | Female |
| Under 5 Years | 16 (2.7%) | 140 (19.6%) |
| 5 to 9 Years | 38 (6.4%) | 46 (6.4%) |
| 10 to 14 Years | 27 (4.6%) | 28 (3.9%) |
| 15 to 19 Years | 38 (6.4%) | 49 (6.9%) |
| 20 to 24 Years | 80 (13.5%) | 45 (6.3%) |
| 25 to 29 Years | 22 (3.7%) | 25 (3.5%) |
| 30 to 34 Years | 22 (3.7%) | 30 (4.2%) |
| 35 to 39 Years | 35 (5.9%) | 26 (3.6%) |
| 40 to 44 Years | 18 (3.0%) | 24 (3.4%) |
| 45 to 49 Years | 70 (11.8%) | 59 (8.3%) |
| 50 to 54 Years | 36 (6.1%) | 27 (3.8%) |
| 55 to 59 Years | 28 (4.7%) | 58 (8.1%) |
| 60 to 64 Years | 55 (9.3%) | 46 (6.4%) |
| 65 to 69 Years | 56 (9.5%) | 18 (2.5%) |
| 70 to 74 Years | 21 (3.5%) | 60 (8.4%) |
| 75 to 79 Years | 11 (1.9%) | 7 (1.0%) |
| 80 to 84 Years | 5 (0.9%) | 8 (1.1%) |
| 85 Years and over | 13 (2.2%) | 19 (2.7%) |
| Total | 591 (100.0%) | 715 (100.0%) |
Families and Households in Newburg
Median Family Size in Newburg
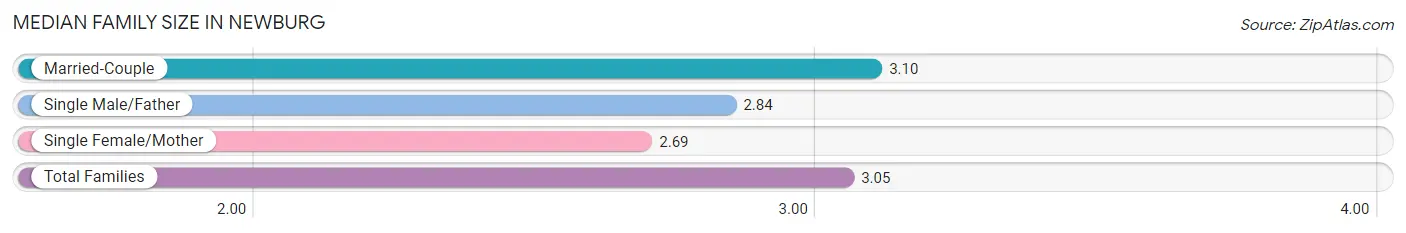
The median family size in Newburg is 3.05 persons per family, with married-couple families (330 | 87.3%) accounting for the largest median family size of 3.1 persons per family. On the other hand, single female/mother families (29 | 7.7%) represent the smallest median family size with 2.69 persons per family.
| Family Type | # Families | Family Size |
| Married-Couple | 330 (87.3%) | 3.10 |
| Single Male/Father | 19 (5.0%) | 2.84 |
| Single Female/Mother | 29 (7.7%) | 2.69 |
| Total Families | 378 (100.0%) | 3.05 |
Median Household Size in Newburg
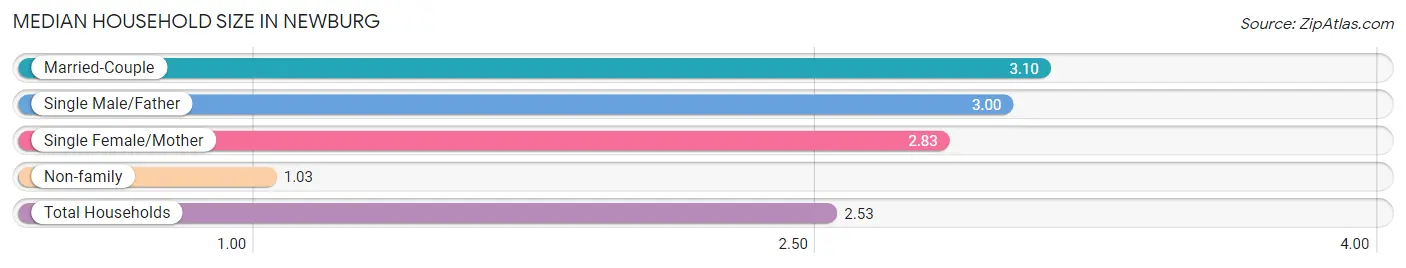
The median household size in Newburg is 2.53 persons per household, with married-couple households (330 | 64.1%) accounting for the largest median household size of 3.1 persons per household. non-family households (137 | 26.6%) represent the smallest median household size with 1.03 persons per household.
| Household Type | # Households | Household Size |
| Married-Couple | 330 (64.1%) | 3.10 |
| Single Male/Father | 19 (3.7%) | 3.00 |
| Single Female/Mother | 29 (5.6%) | 2.83 |
| Non-family | 137 (26.6%) | 1.03 |
| Total Households | 515 (100.0%) | 2.53 |
Household Size by Marriage Status in Newburg
Out of a total of 515 households in Newburg, 378 (73.4%) are family households, while 137 (26.6%) are nonfamily households. The most numerous type of family households are 2-person households, comprising 170, and the most common type of nonfamily households are 1-person households, comprising 130.
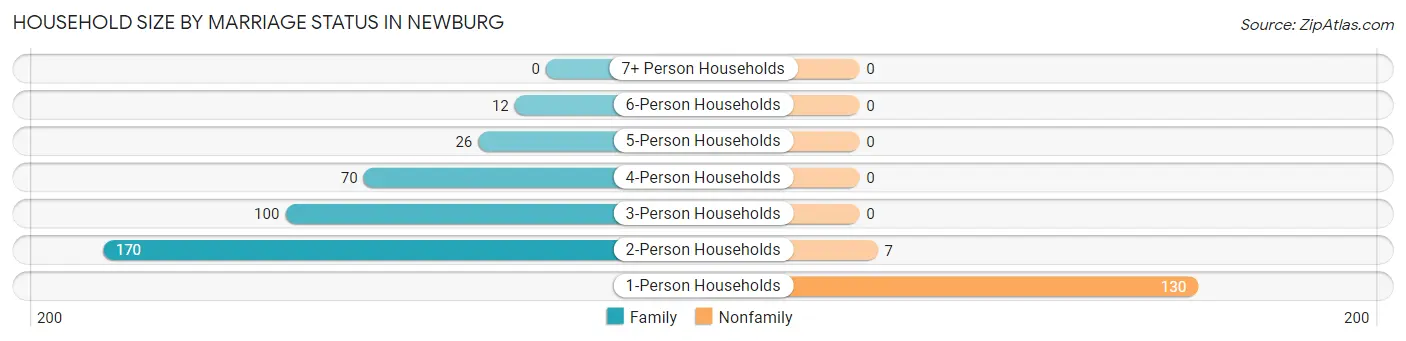
| Household Size | Family Households | Nonfamily Households |
| 1-Person Households | - | 130 (25.2%) |
| 2-Person Households | 170 (33.0%) | 7 (1.4%) |
| 3-Person Households | 100 (19.4%) | 0 (0.0%) |
| 4-Person Households | 70 (13.6%) | 0 (0.0%) |
| 5-Person Households | 26 (5.1%) | 0 (0.0%) |
| 6-Person Households | 12 (2.3%) | 0 (0.0%) |
| 7+ Person Households | 0 (0.0%) | 0 (0.0%) |
| Total | 378 (73.4%) | 137 (26.6%) |
Female Fertility in Newburg
Fertility by Age in Newburg
Average fertility rate in Newburg is 208.0 births per 1,000 women. Women in the age bracket of 20 to 34 years have the highest fertility rate with 500.0 births per 1,000 women. Women in the age bracket of 20 to 34 years acount for 90.9% of all women with births.
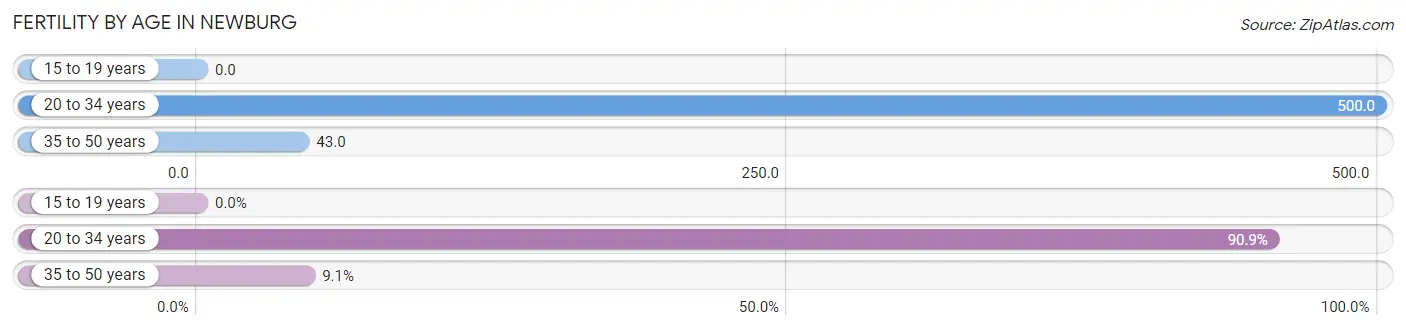
| Age Bracket | Women with Births | Births / 1,000 Women |
| 15 to 19 years | 0 (0.0%) | 0.0 |
| 20 to 34 years | 50 (90.9%) | 500.0 |
| 35 to 50 years | 5 (9.1%) | 43.0 |
| Total | 55 (100.0%) | 208.0 |
Fertility by Age by Marriage Status in Newburg
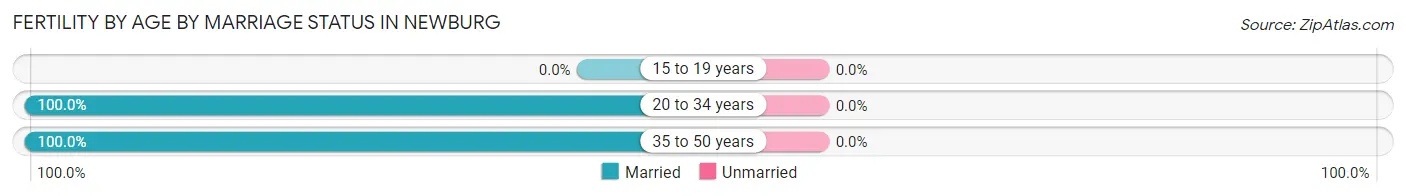
| Age Bracket | Married | Unmarried |
| 15 to 19 years | 0 (0.0%) | 0 (0.0%) |
| 20 to 34 years | 50 (100.0%) | 0 (0.0%) |
| 35 to 50 years | 5 (100.0%) | 0 (0.0%) |
| Total | 55 (100.0%) | 0 (0.0%) |
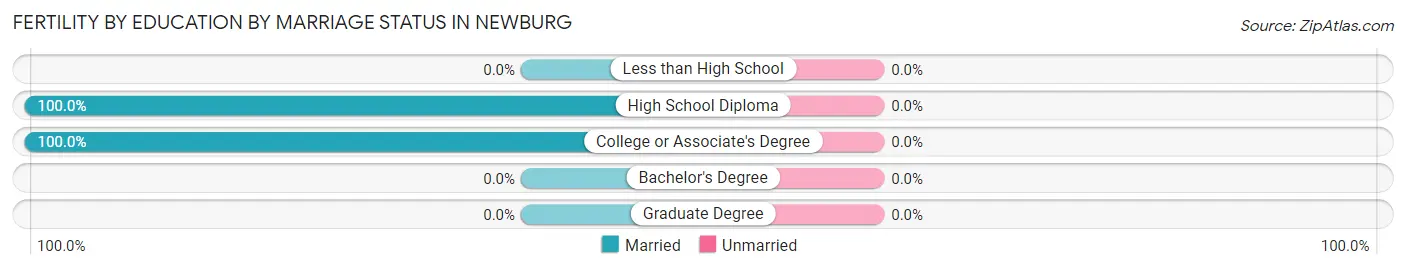
Fertility by Education in Newburg
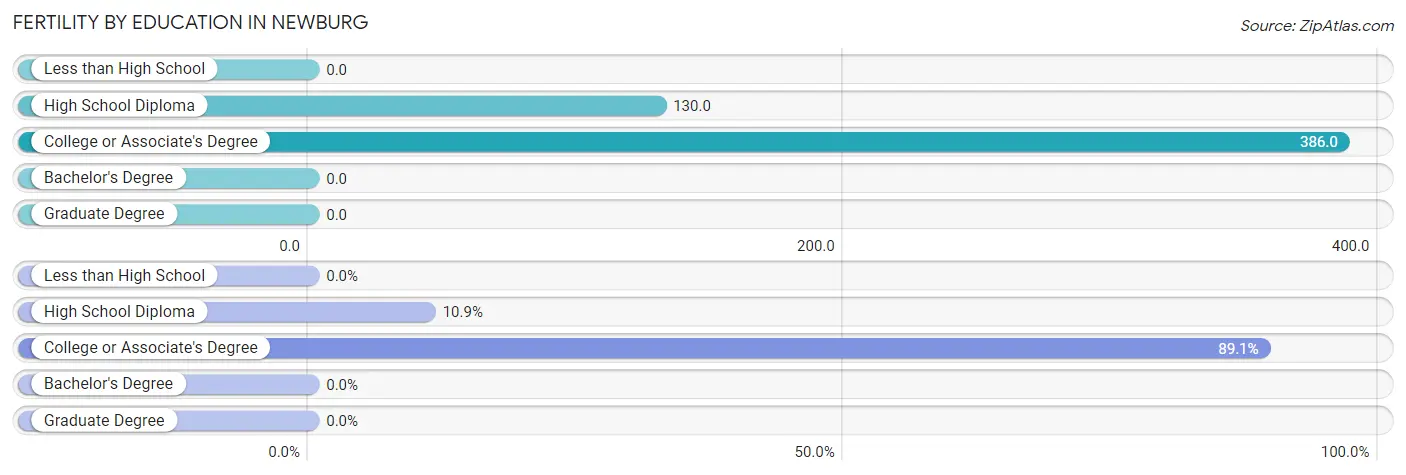
| Educational Attainment | Women with Births | Births / 1,000 Women |
| Less than High School | 0 (0.0%) | 0.0 |
| High School Diploma | 6 (10.9%) | 130.0 |
| College or Associate's Degree | 49 (89.1%) | 386.0 |
| Bachelor's Degree | 0 (0.0%) | 0.0 |
| Graduate Degree | 0 (0.0%) | 0.0 |
| Total | 55 (100.0%) | 208.0 |
Fertility by Education by Marriage Status in Newburg
| Educational Attainment | Married | Unmarried |
| Less than High School | 0 (0.0%) | 0 (0.0%) |
| High School Diploma | 6 (100.0%) | 0 (0.0%) |
| College or Associate's Degree | 49 (100.0%) | 0 (0.0%) |
| Bachelor's Degree | 0 (0.0%) | 0 (0.0%) |
| Graduate Degree | 0 (0.0%) | 0 (0.0%) |
| Total | 55 (100.0%) | 0 (0.0%) |
Employment Characteristics in Newburg
Employment by Class of Employer in Newburg
Among the 711 employed individuals in Newburg, private company employees (526 | 74.0%), not-for-profit organizations (79 | 11.1%), and federal government employees (41 | 5.8%) make up the most common classes of employment.
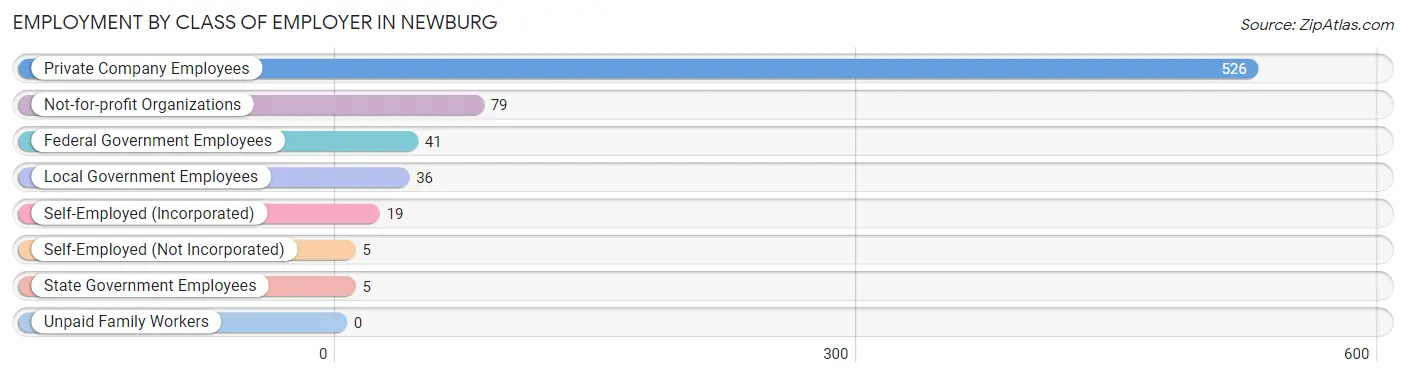
| Employer Class | # Employees | % Employees |
| Private Company Employees | 526 | 74.0% |
| Self-Employed (Incorporated) | 19 | 2.7% |
| Self-Employed (Not Incorporated) | 5 | 0.7% |
| Not-for-profit Organizations | 79 | 11.1% |
| Local Government Employees | 36 | 5.1% |
| State Government Employees | 5 | 0.7% |
| Federal Government Employees | 41 | 5.8% |
| Unpaid Family Workers | 0 | 0.0% |
| Total | 711 | 100.0% |
Employment Status by Age in Newburg
According to the labor force statistics for Newburg, out of the total population over 16 years of age (1,003), 74.0% or 742 individuals are in the labor force, with 3.5% or 26 of them unemployed. The age group with the highest labor force participation rate is 20 to 24 years, with 100.0% or 125 individuals in the labor force. Within the labor force, the 20 to 24 years age range has the highest percentage of unemployed individuals, with 10.4% or 13 of them being unemployed.
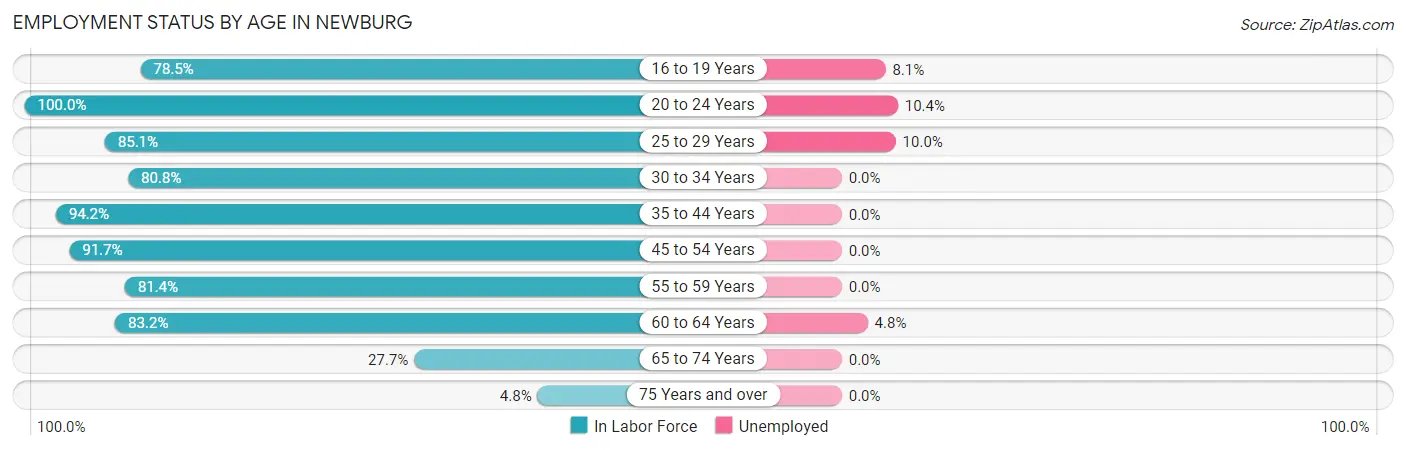
| Age Bracket | In Labor Force | Unemployed |
| 16 to 19 Years | 62 (78.5%) | 5 (8.1%) |
| 20 to 24 Years | 125 (100.0%) | 13 (10.4%) |
| 25 to 29 Years | 40 (85.1%) | 4 (10.0%) |
| 30 to 34 Years | 42 (80.8%) | 0 (0.0%) |
| 35 to 44 Years | 97 (94.2%) | 0 (0.0%) |
| 45 to 54 Years | 176 (91.7%) | 0 (0.0%) |
| 55 to 59 Years | 70 (81.4%) | 0 (0.0%) |
| 60 to 64 Years | 84 (83.2%) | 4 (4.8%) |
| 65 to 74 Years | 43 (27.7%) | 0 (0.0%) |
| 75 Years and over | 3 (4.8%) | 0 (0.0%) |
| Total | 742 (74.0%) | 26 (3.5%) |
Employment Status by Educational Attainment in Newburg
According to labor force statistics for Newburg, 87.6% of individuals (509) out of the total population between 25 and 64 years of age (581) are in the labor force, with 1.6% or 8 of them being unemployed. The group with the highest labor force participation rate are those with the educational attainment of high school diploma, with 92.8% or 180 individuals in the labor force. Within the labor force, individuals with high school diploma education have the highest percentage of unemployment, with 3.9% or 7 of them being unemployed.
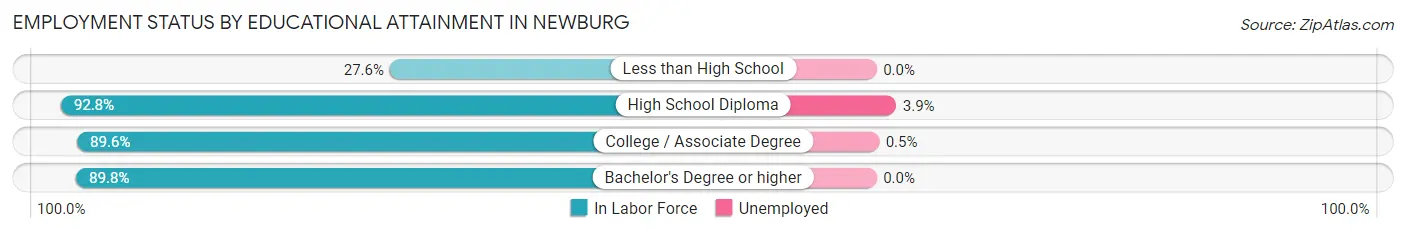
| Educational Attainment | In Labor Force | Unemployed |
| Less than High School | 8 (27.6%) | 0 (0.0%) |
| High School Diploma | 180 (92.8%) | 8 (3.9%) |
| College / Associate Degree | 189 (89.6%) | 1 (0.5%) |
| Bachelor's Degree or higher | 132 (89.8%) | 0 (0.0%) |
| Total | 509 (87.6%) | 9 (1.6%) |
Employment Occupations by Sex in Newburg
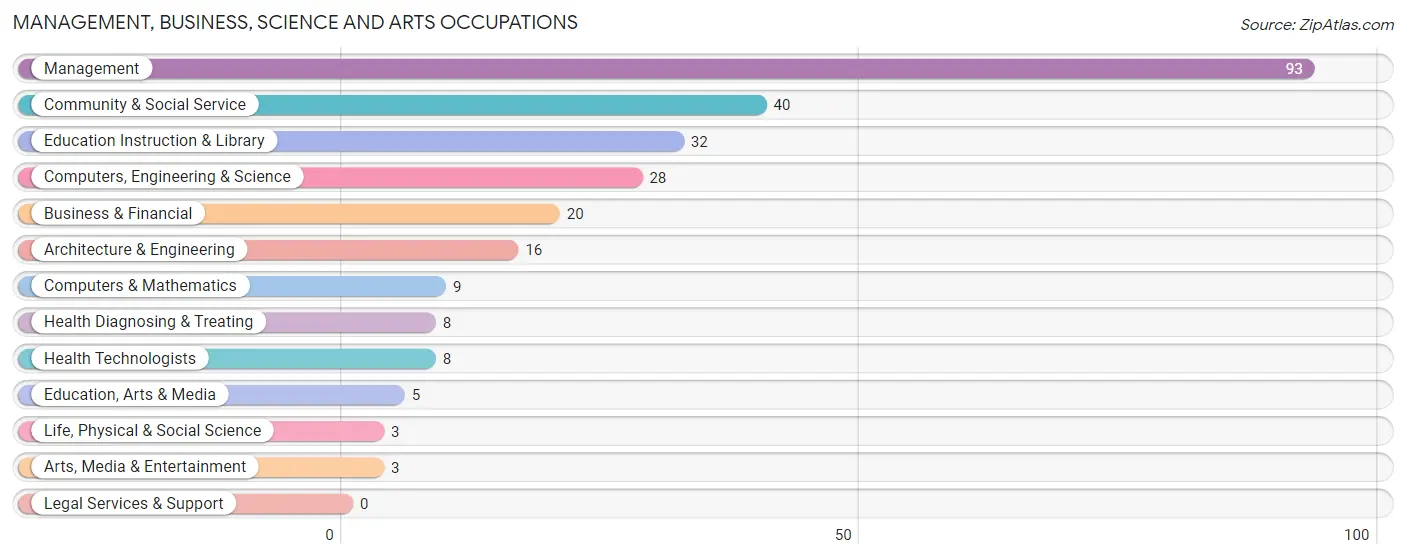
Management, Business, Science and Arts Occupations
The most common Management, Business, Science and Arts occupations in Newburg are Management (93 | 13.0%), Community & Social Service (40 | 5.6%), Education Instruction & Library (32 | 4.5%), Computers, Engineering & Science (28 | 3.9%), and Business & Financial (20 | 2.8%).
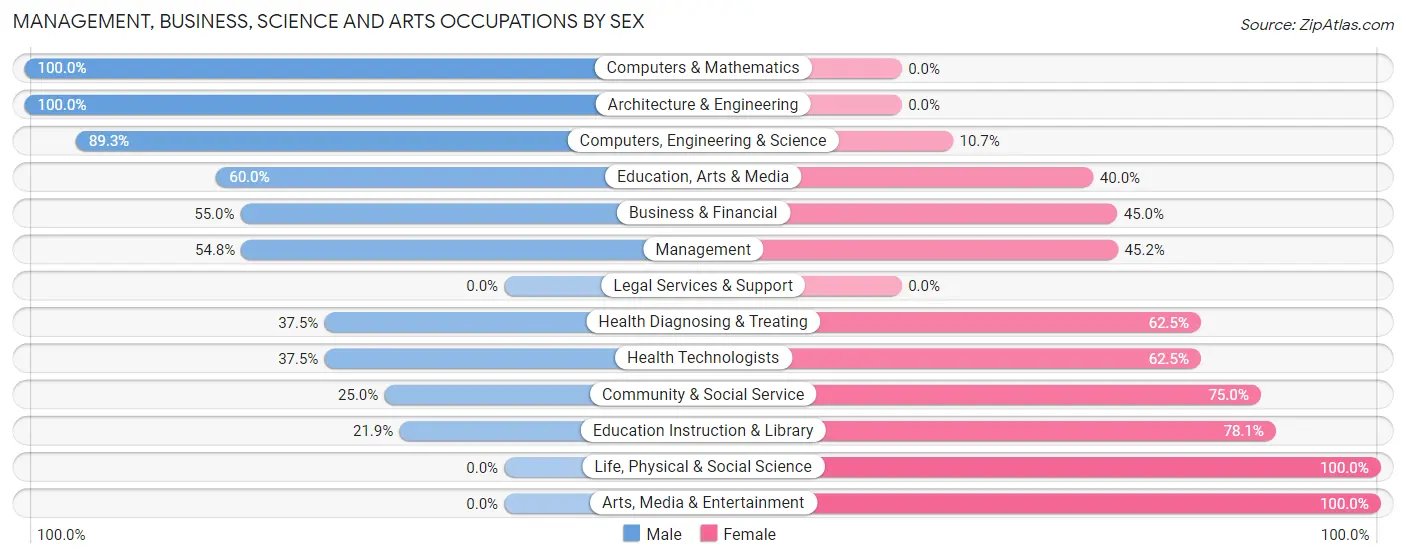
Management, Business, Science and Arts Occupations by Sex
Within the Management, Business, Science and Arts occupations in Newburg, the most male-oriented occupations are Computers & Mathematics (100.0%), Architecture & Engineering (100.0%), and Computers, Engineering & Science (89.3%), while the most female-oriented occupations are Life, Physical & Social Science (100.0%), Arts, Media & Entertainment (100.0%), and Education Instruction & Library (78.1%).
| Occupation | Male | Female |
| Management | 51 (54.8%) | 42 (45.2%) |
| Business & Financial | 11 (55.0%) | 9 (45.0%) |
| Computers, Engineering & Science | 25 (89.3%) | 3 (10.7%) |
| Computers & Mathematics | 9 (100.0%) | 0 (0.0%) |
| Architecture & Engineering | 16 (100.0%) | 0 (0.0%) |
| Life, Physical & Social Science | 0 (0.0%) | 3 (100.0%) |
| Community & Social Service | 10 (25.0%) | 30 (75.0%) |
| Education, Arts & Media | 3 (60.0%) | 2 (40.0%) |
| Legal Services & Support | 0 (0.0%) | 0 (0.0%) |
| Education Instruction & Library | 7 (21.9%) | 25 (78.1%) |
| Arts, Media & Entertainment | 0 (0.0%) | 3 (100.0%) |
| Health Diagnosing & Treating | 3 (37.5%) | 5 (62.5%) |
| Health Technologists | 3 (37.5%) | 5 (62.5%) |
| Total (Category) | 100 (52.9%) | 89 (47.1%) |
| Total (Overall) | 387 (54.0%) | 329 (46.0%) |
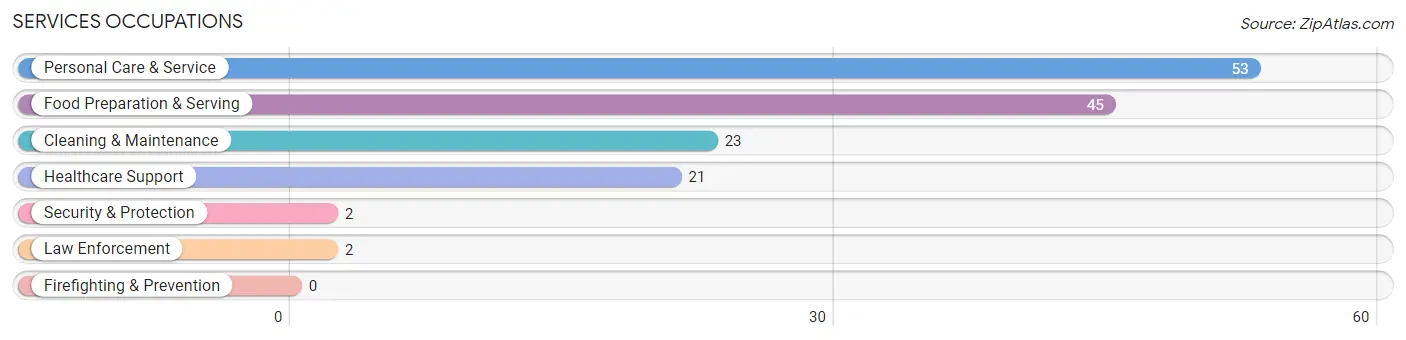
Services Occupations
The most common Services occupations in Newburg are Personal Care & Service (53 | 7.4%), Food Preparation & Serving (45 | 6.3%), Cleaning & Maintenance (23 | 3.2%), Healthcare Support (21 | 2.9%), and Security & Protection (2 | 0.3%).
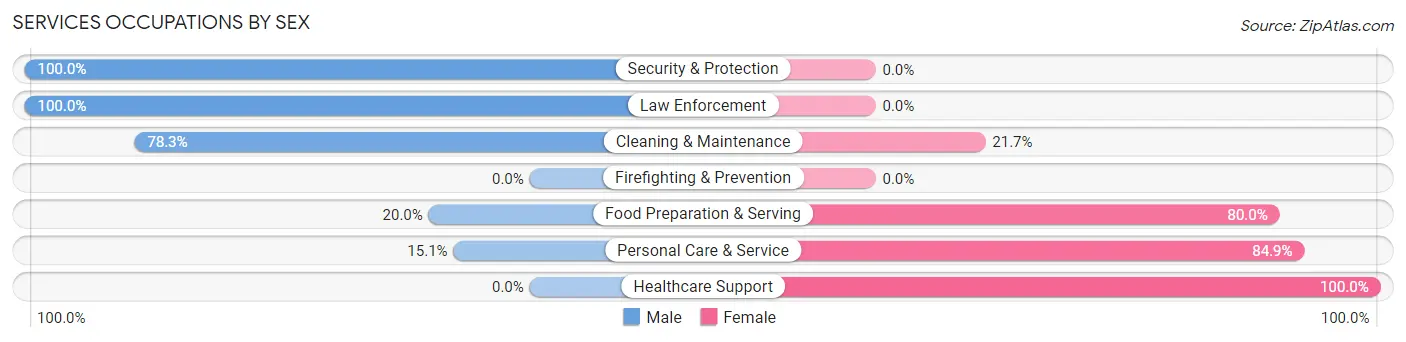
Services Occupations by Sex
Within the Services occupations in Newburg, the most male-oriented occupations are Security & Protection (100.0%), Law Enforcement (100.0%), and Cleaning & Maintenance (78.3%), while the most female-oriented occupations are Healthcare Support (100.0%), Personal Care & Service (84.9%), and Food Preparation & Serving (80.0%).
| Occupation | Male | Female |
| Healthcare Support | 0 (0.0%) | 21 (100.0%) |
| Security & Protection | 2 (100.0%) | 0 (0.0%) |
| Firefighting & Prevention | 0 (0.0%) | 0 (0.0%) |
| Law Enforcement | 2 (100.0%) | 0 (0.0%) |
| Food Preparation & Serving | 9 (20.0%) | 36 (80.0%) |
| Cleaning & Maintenance | 18 (78.3%) | 5 (21.7%) |
| Personal Care & Service | 8 (15.1%) | 45 (84.9%) |
| Total (Category) | 37 (25.7%) | 107 (74.3%) |
| Total (Overall) | 387 (54.0%) | 329 (46.0%) |
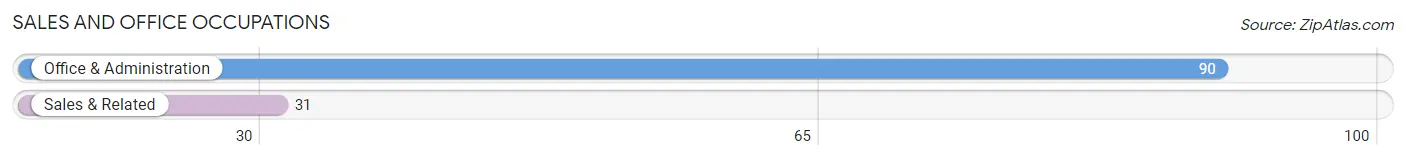
Sales and Office Occupations
The most common Sales and Office occupations in Newburg are Office & Administration (90 | 12.6%), and Sales & Related (31 | 4.3%).
Sales and Office Occupations by Sex
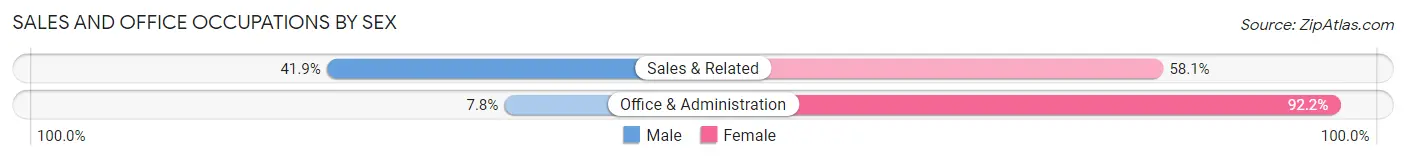
| Occupation | Male | Female |
| Sales & Related | 13 (41.9%) | 18 (58.1%) |
| Office & Administration | 7 (7.8%) | 83 (92.2%) |
| Total (Category) | 20 (16.5%) | 101 (83.5%) |
| Total (Overall) | 387 (54.0%) | 329 (46.0%) |
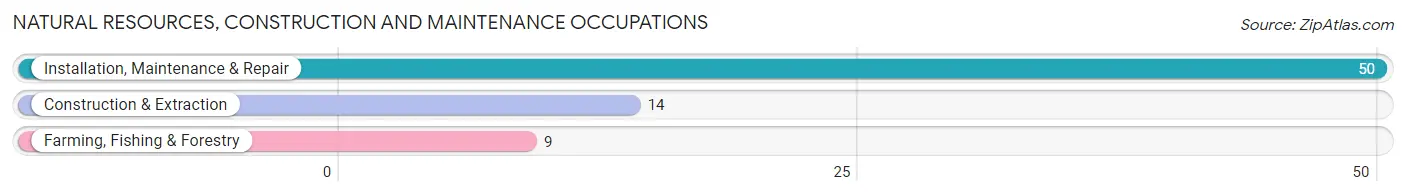
Natural Resources, Construction and Maintenance Occupations
The most common Natural Resources, Construction and Maintenance occupations in Newburg are Installation, Maintenance & Repair (50 | 7.0%), Construction & Extraction (14 | 2.0%), and Farming, Fishing & Forestry (9 | 1.3%).
Natural Resources, Construction and Maintenance Occupations by Sex
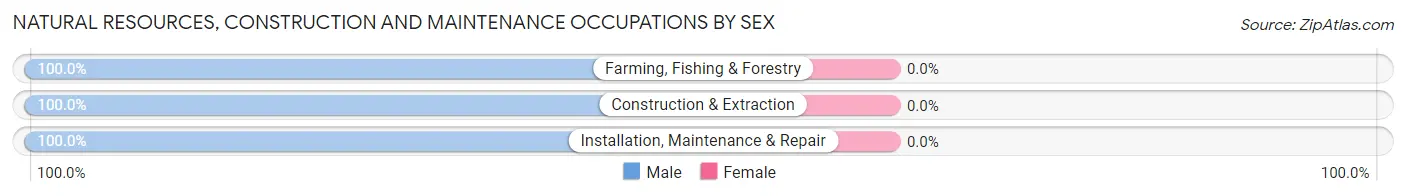
| Occupation | Male | Female |
| Farming, Fishing & Forestry | 9 (100.0%) | 0 (0.0%) |
| Construction & Extraction | 14 (100.0%) | 0 (0.0%) |
| Installation, Maintenance & Repair | 50 (100.0%) | 0 (0.0%) |
| Total (Category) | 73 (100.0%) | 0 (0.0%) |
| Total (Overall) | 387 (54.0%) | 329 (46.0%) |
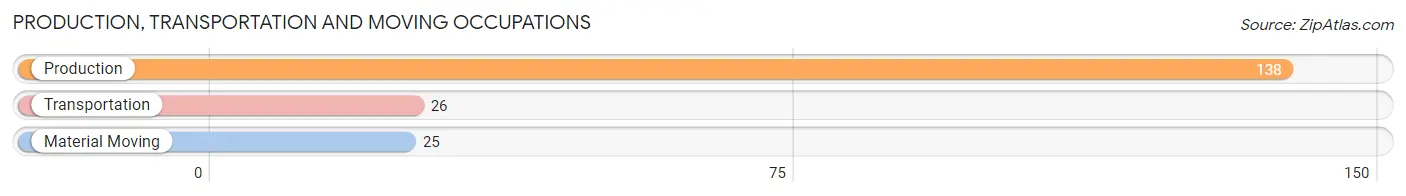
Production, Transportation and Moving Occupations
The most common Production, Transportation and Moving occupations in Newburg are Production (138 | 19.3%), Transportation (26 | 3.6%), and Material Moving (25 | 3.5%).
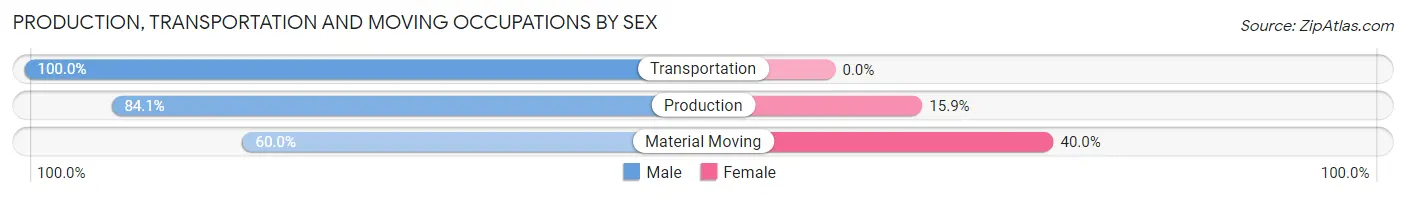
Production, Transportation and Moving Occupations by Sex
| Occupation | Male | Female |
| Production | 116 (84.1%) | 22 (15.9%) |
| Transportation | 26 (100.0%) | 0 (0.0%) |
| Material Moving | 15 (60.0%) | 10 (40.0%) |
| Total (Category) | 157 (83.1%) | 32 (16.9%) |
| Total (Overall) | 387 (54.0%) | 329 (46.0%) |
Employment Industries by Sex in Newburg
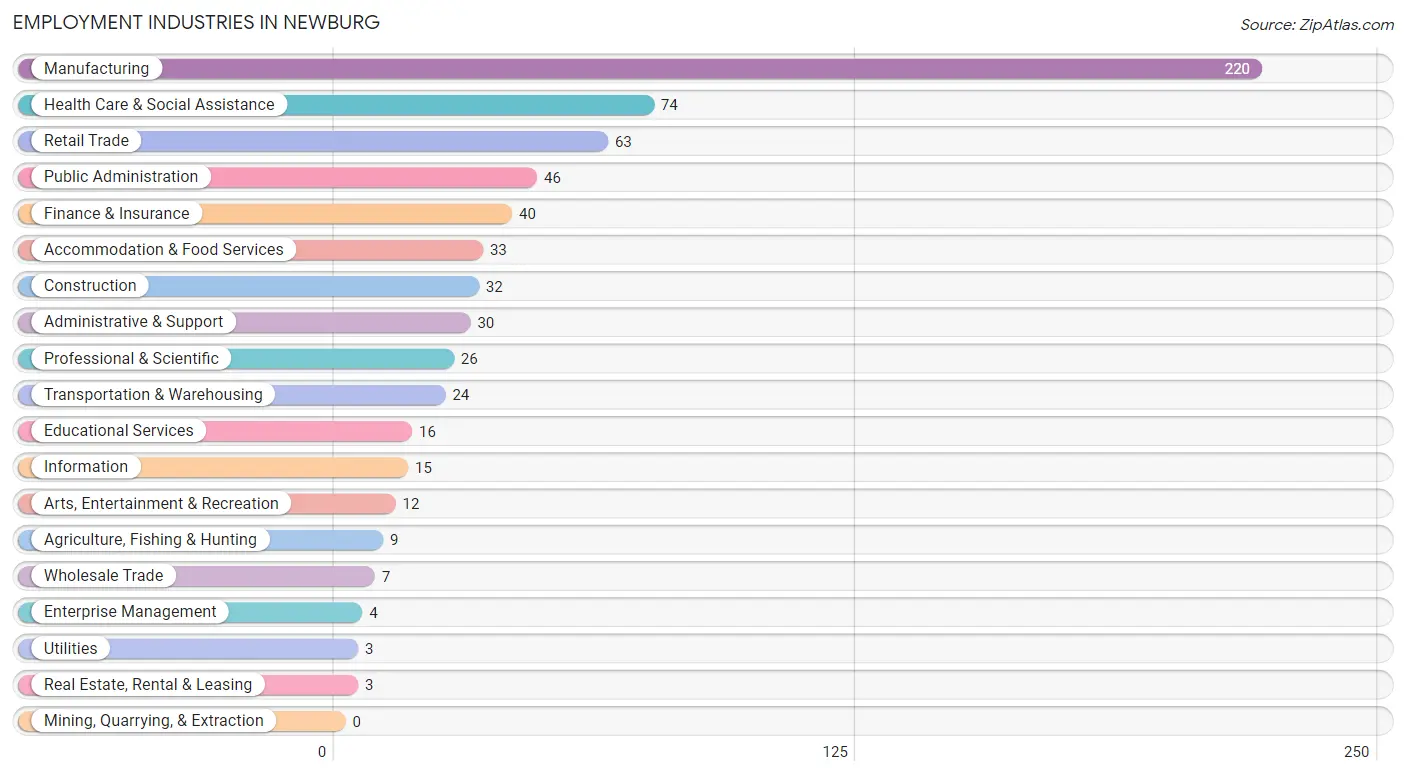
Employment Industries in Newburg
The major employment industries in Newburg include Manufacturing (220 | 30.7%), Health Care & Social Assistance (74 | 10.3%), Retail Trade (63 | 8.8%), Public Administration (46 | 6.4%), and Finance & Insurance (40 | 5.6%).
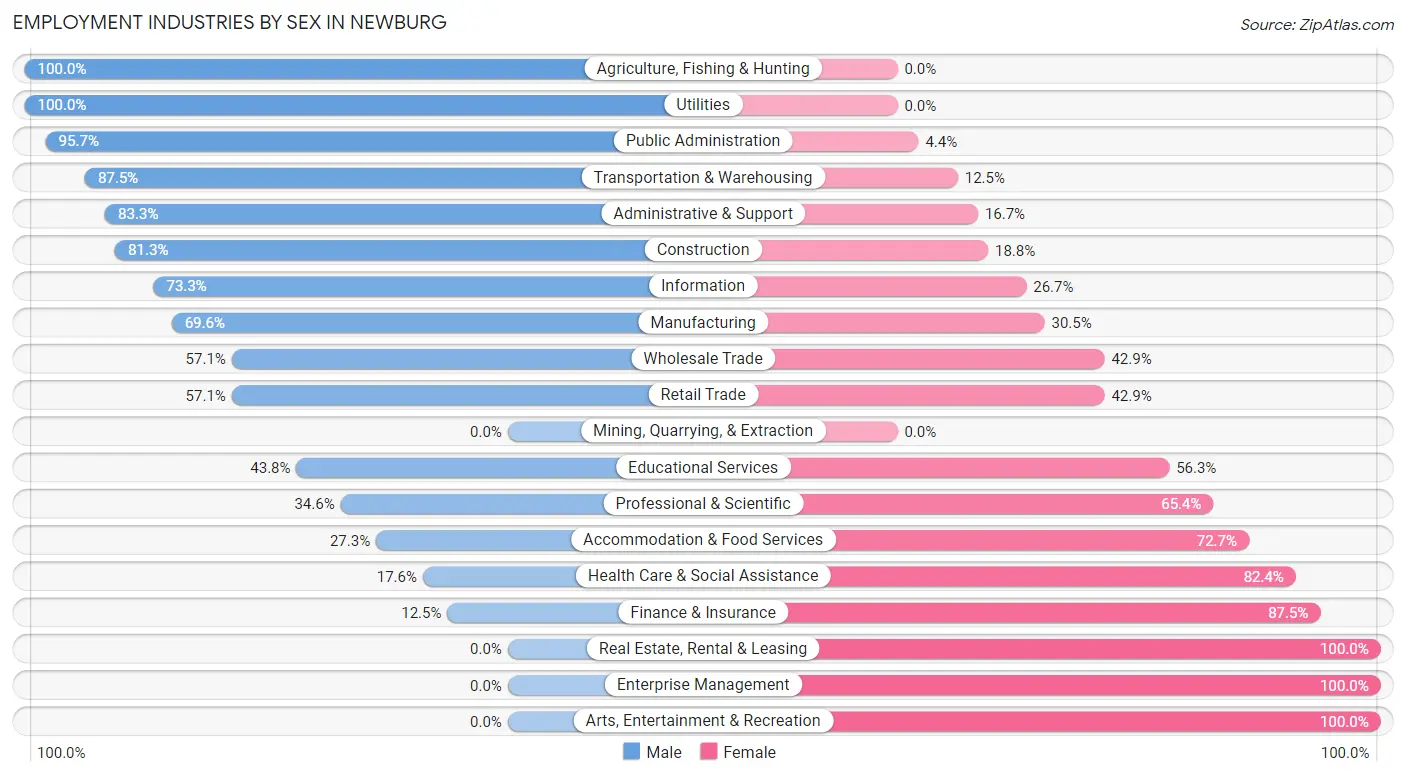
Employment Industries by Sex in Newburg
The Newburg industries that see more men than women are Agriculture, Fishing & Hunting (100.0%), Utilities (100.0%), and Public Administration (95.7%), whereas the industries that tend to have a higher number of women are Real Estate, Rental & Leasing (100.0%), Enterprise Management (100.0%), and Arts, Entertainment & Recreation (100.0%).
| Industry | Male | Female |
| Agriculture, Fishing & Hunting | 9 (100.0%) | 0 (0.0%) |
| Mining, Quarrying, & Extraction | 0 (0.0%) | 0 (0.0%) |
| Construction | 26 (81.2%) | 6 (18.8%) |
| Manufacturing | 153 (69.6%) | 67 (30.4%) |
| Wholesale Trade | 4 (57.1%) | 3 (42.9%) |
| Retail Trade | 36 (57.1%) | 27 (42.9%) |
| Transportation & Warehousing | 21 (87.5%) | 3 (12.5%) |
| Utilities | 3 (100.0%) | 0 (0.0%) |
| Information | 11 (73.3%) | 4 (26.7%) |
| Finance & Insurance | 5 (12.5%) | 35 (87.5%) |
| Real Estate, Rental & Leasing | 0 (0.0%) | 3 (100.0%) |
| Professional & Scientific | 9 (34.6%) | 17 (65.4%) |
| Enterprise Management | 0 (0.0%) | 4 (100.0%) |
| Administrative & Support | 25 (83.3%) | 5 (16.7%) |
| Educational Services | 7 (43.8%) | 9 (56.2%) |
| Health Care & Social Assistance | 13 (17.6%) | 61 (82.4%) |
| Arts, Entertainment & Recreation | 0 (0.0%) | 12 (100.0%) |
| Accommodation & Food Services | 9 (27.3%) | 24 (72.7%) |
| Public Administration | 44 (95.7%) | 2 (4.3%) |
| Total | 387 (54.0%) | 329 (46.0%) |
Education in Newburg
School Enrollment in Newburg
The most common levels of schooling among the 222 students in Newburg are high school (53 | 23.9%), elementary school (47 | 21.2%), and middle school (45 | 20.3%).
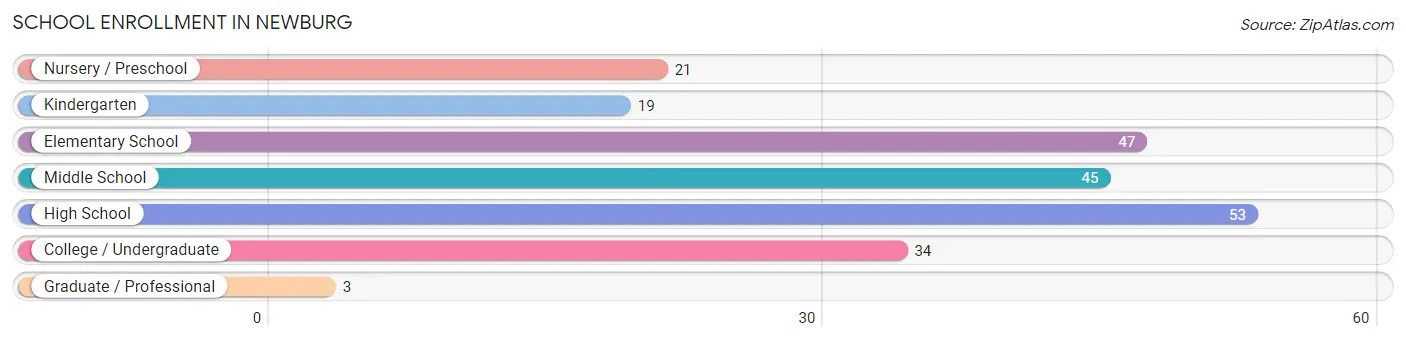
| School Level | # Students | % Students |
| Nursery / Preschool | 21 | 9.5% |
| Kindergarten | 19 | 8.6% |
| Elementary School | 47 | 21.2% |
| Middle School | 45 | 20.3% |
| High School | 53 | 23.9% |
| College / Undergraduate | 34 | 15.3% |
| Graduate / Professional | 3 | 1.3% |
| Total | 222 | 100.0% |
School Enrollment by Age by Funding Source in Newburg
Out of a total of 222 students who are enrolled in schools in Newburg, 93 (41.9%) attend a private institution, while the remaining 129 (58.1%) are enrolled in public schools. The age group of 3 to 4 year olds has the highest likelihood of being enrolled in private schools, with 7 (77.8% in the age bracket) enrolled. Conversely, the age group of 25 to 34 year olds has the lowest likelihood of being enrolled in a private school, with 7 (100.0% in the age bracket) attending a public institution.
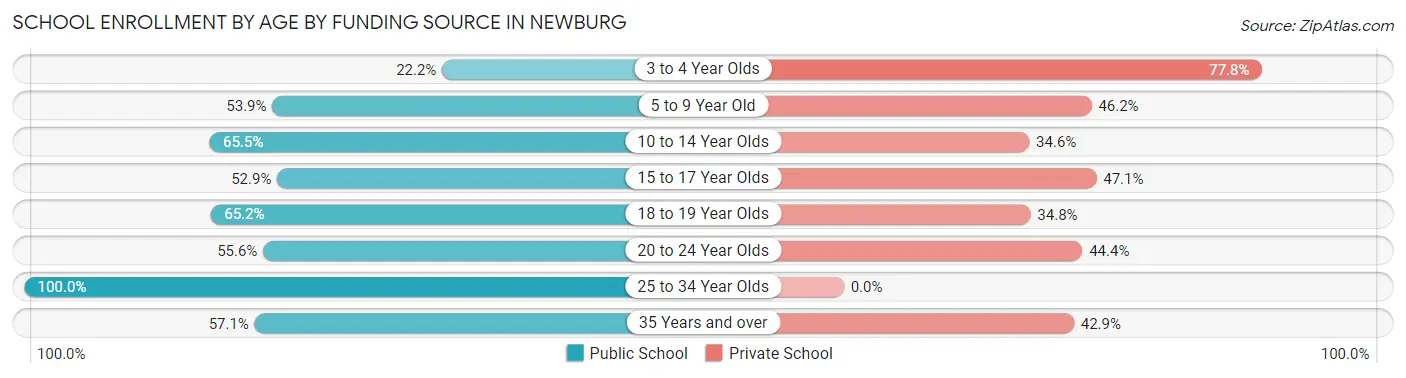
| Age Bracket | Public School | Private School |
| 3 to 4 Year Olds | 2 (22.2%) | 7 (77.8%) |
| 5 to 9 Year Old | 42 (53.8%) | 36 (46.2%) |
| 10 to 14 Year Olds | 36 (65.4%) | 19 (34.5%) |
| 15 to 17 Year Olds | 18 (52.9%) | 16 (47.1%) |
| 18 to 19 Year Olds | 15 (65.2%) | 8 (34.8%) |
| 20 to 24 Year Olds | 5 (55.6%) | 4 (44.4%) |
| 25 to 34 Year Olds | 7 (100.0%) | 0 (0.0%) |
| 35 Years and over | 4 (57.1%) | 3 (42.9%) |
| Total | 129 (58.1%) | 93 (41.9%) |
Educational Attainment by Field of Study in Newburg
Engineering (42 | 22.7%), arts & humanities (41 | 22.2%), business (31 | 16.8%), physical & health sciences (11 | 5.9%), and education (11 | 5.9%) are the most common fields of study among 185 individuals in Newburg who have obtained a bachelor's degree or higher.
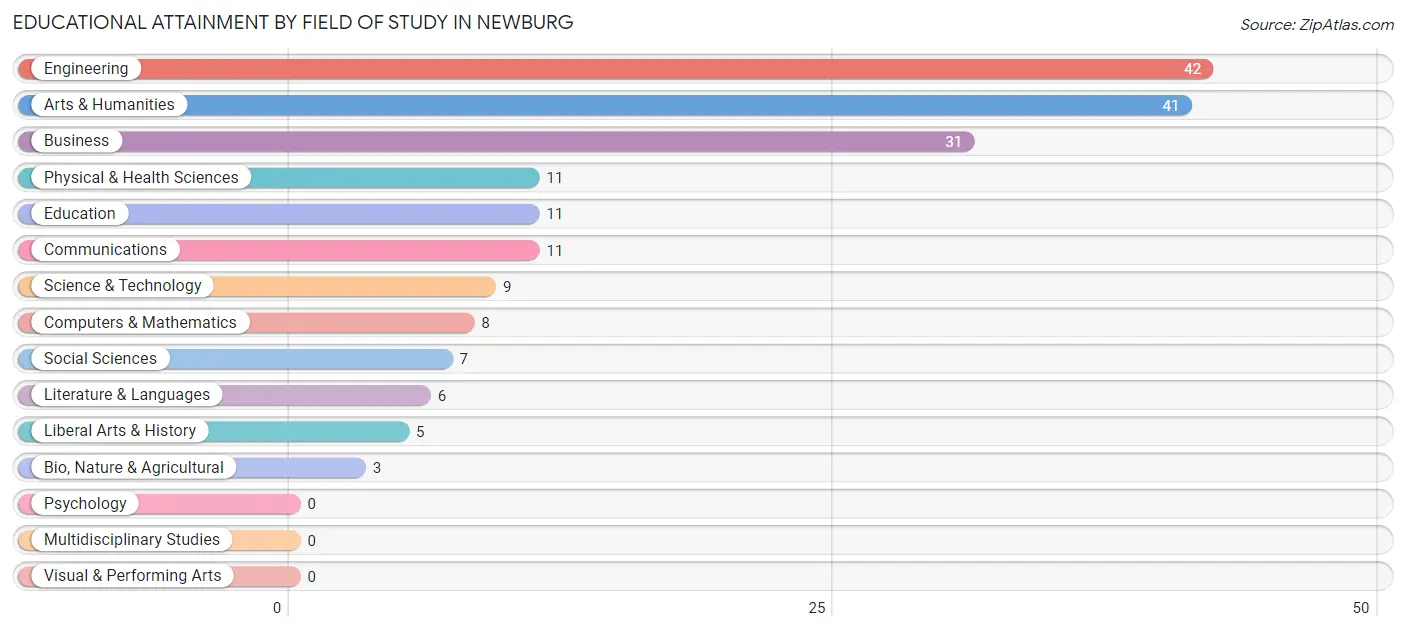
| Field of Study | # Graduates | % Graduates |
| Computers & Mathematics | 8 | 4.3% |
| Bio, Nature & Agricultural | 3 | 1.6% |
| Physical & Health Sciences | 11 | 5.9% |
| Psychology | 0 | 0.0% |
| Social Sciences | 7 | 3.8% |
| Engineering | 42 | 22.7% |
| Multidisciplinary Studies | 0 | 0.0% |
| Science & Technology | 9 | 4.9% |
| Business | 31 | 16.8% |
| Education | 11 | 5.9% |
| Literature & Languages | 6 | 3.2% |
| Liberal Arts & History | 5 | 2.7% |
| Visual & Performing Arts | 0 | 0.0% |
| Communications | 11 | 5.9% |
| Arts & Humanities | 41 | 22.2% |
| Total | 185 | 100.0% |
Transportation & Commute in Newburg
Vehicle Availability by Sex in Newburg
The most prevalent vehicle ownership categories in Newburg are males with 2 vehicles (201, accounting for 52.8%) and females with 2 vehicles (177, making up 61.1%).
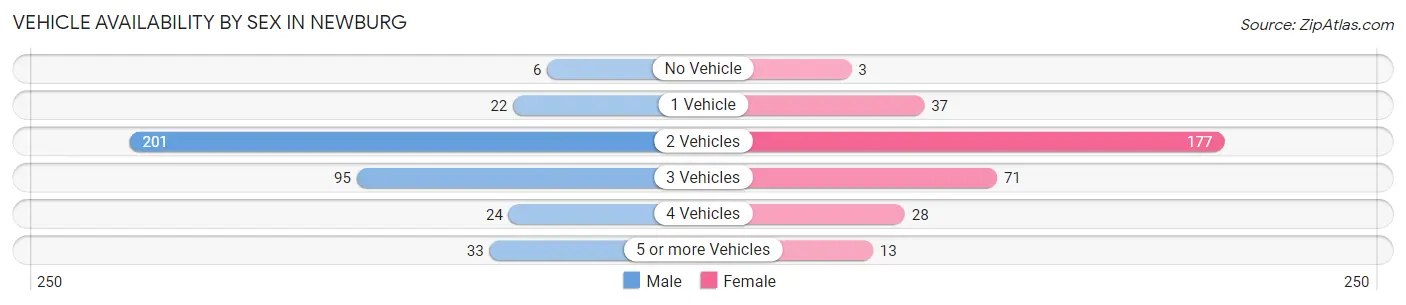
| Vehicles Available | Male | Female |
| No Vehicle | 6 (1.6%) | 3 (0.9%) |
| 1 Vehicle | 22 (5.8%) | 37 (11.3%) |
| 2 Vehicles | 201 (52.8%) | 177 (53.8%) |
| 3 Vehicles | 95 (24.9%) | 71 (21.6%) |
| 4 Vehicles | 24 (6.3%) | 28 (8.5%) |
| 5 or more Vehicles | 33 (8.7%) | 13 (4.0%) |
| Total | 381 (100.0%) | 329 (100.0%) |
Commute Time in Newburg
The most frequently occuring commute durations in Newburg are 15 to 19 minutes (117 commuters, 17.4%), 40 to 44 minutes (91 commuters, 13.5%), and 20 to 24 minutes (86 commuters, 12.8%).
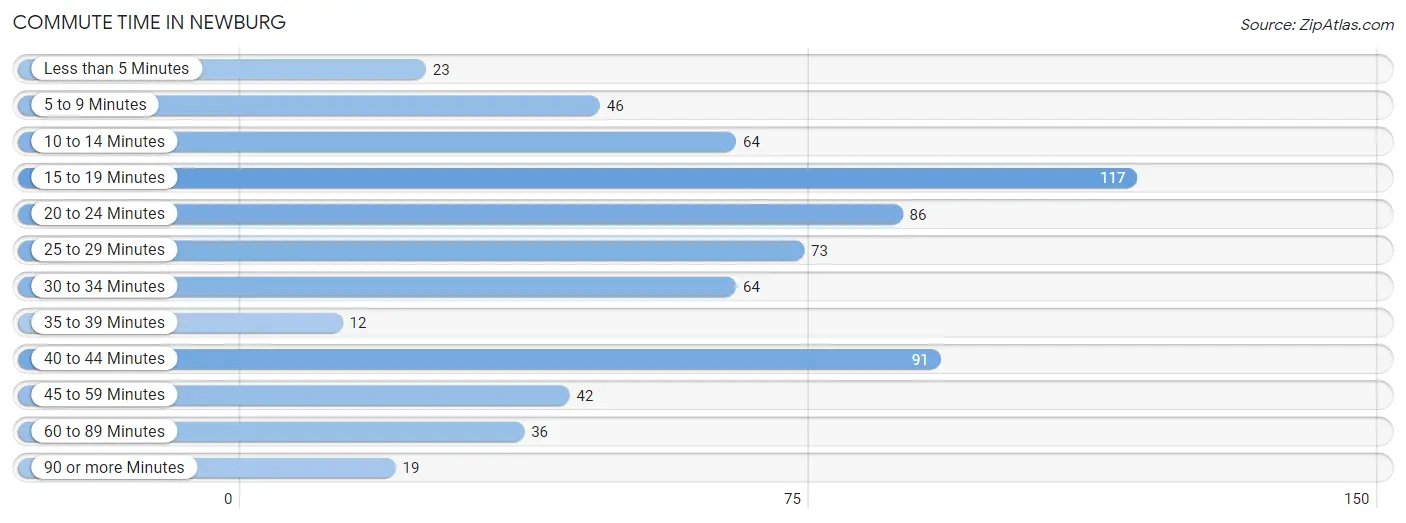
| Commute Time | # Commuters | % Commuters |
| Less than 5 Minutes | 23 | 3.4% |
| 5 to 9 Minutes | 46 | 6.8% |
| 10 to 14 Minutes | 64 | 9.5% |
| 15 to 19 Minutes | 117 | 17.4% |
| 20 to 24 Minutes | 86 | 12.8% |
| 25 to 29 Minutes | 73 | 10.8% |
| 30 to 34 Minutes | 64 | 9.5% |
| 35 to 39 Minutes | 12 | 1.8% |
| 40 to 44 Minutes | 91 | 13.5% |
| 45 to 59 Minutes | 42 | 6.2% |
| 60 to 89 Minutes | 36 | 5.3% |
| 90 or more Minutes | 19 | 2.8% |
Commute Time by Sex in Newburg
The most common commute times in Newburg are 40 to 44 minutes (83 commuters, 23.6%) for males and 15 to 19 minutes (75 commuters, 23.4%) for females.
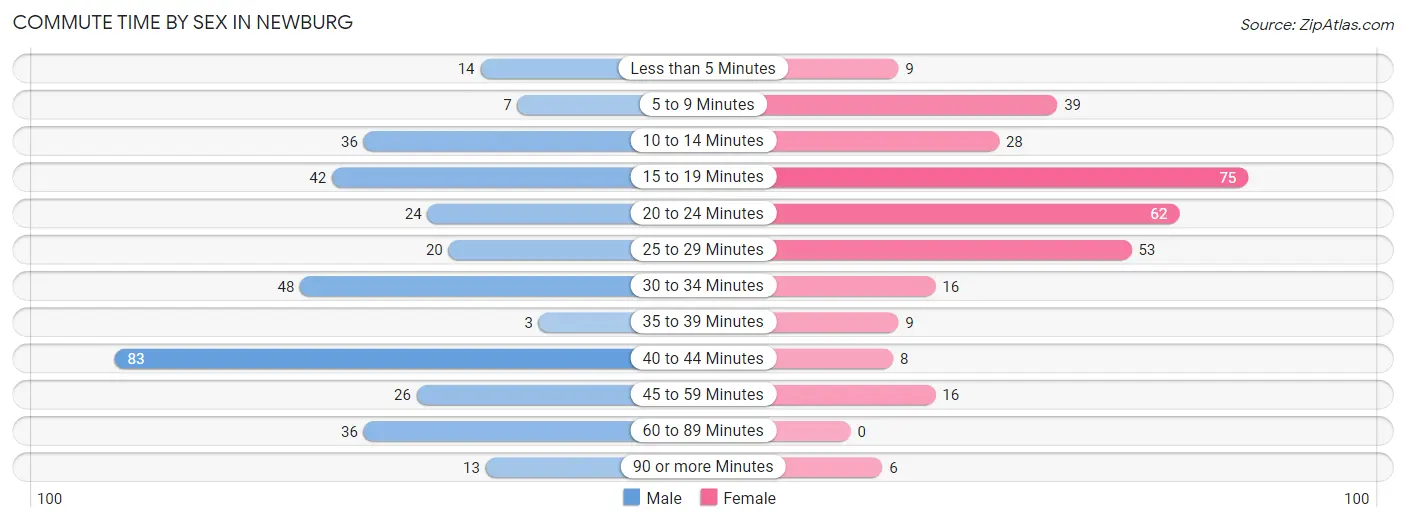
| Commute Time | Male | Female |
| Less than 5 Minutes | 14 (4.0%) | 9 (2.8%) |
| 5 to 9 Minutes | 7 (2.0%) | 39 (12.1%) |
| 10 to 14 Minutes | 36 (10.2%) | 28 (8.7%) |
| 15 to 19 Minutes | 42 (11.9%) | 75 (23.4%) |
| 20 to 24 Minutes | 24 (6.8%) | 62 (19.3%) |
| 25 to 29 Minutes | 20 (5.7%) | 53 (16.5%) |
| 30 to 34 Minutes | 48 (13.6%) | 16 (5.0%) |
| 35 to 39 Minutes | 3 (0.9%) | 9 (2.8%) |
| 40 to 44 Minutes | 83 (23.6%) | 8 (2.5%) |
| 45 to 59 Minutes | 26 (7.4%) | 16 (5.0%) |
| 60 to 89 Minutes | 36 (10.2%) | 0 (0.0%) |
| 90 or more Minutes | 13 (3.7%) | 6 (1.9%) |
Time of Departure to Work by Sex in Newburg
The most frequent times of departure to work in Newburg are 5:00 AM to 5:29 AM (93, 26.4%) for males and 7:00 AM to 7:29 AM (56, 17.4%) for females.
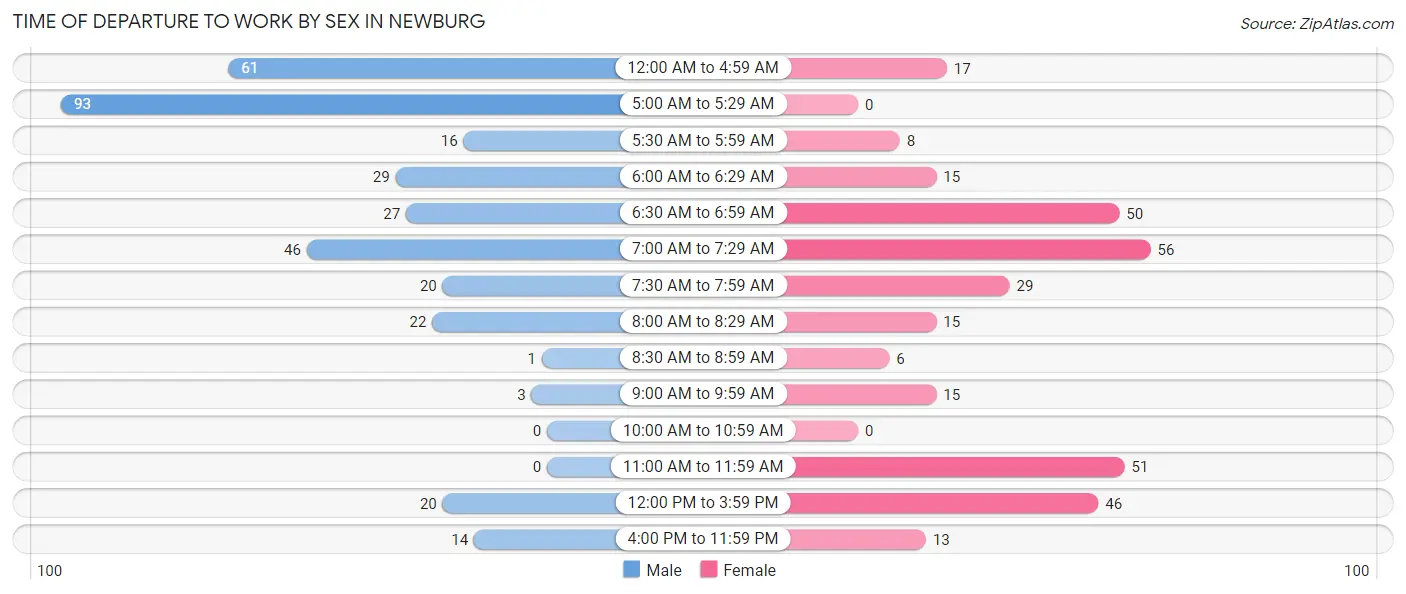
| Time of Departure | Male | Female |
| 12:00 AM to 4:59 AM | 61 (17.3%) | 17 (5.3%) |
| 5:00 AM to 5:29 AM | 93 (26.4%) | 0 (0.0%) |
| 5:30 AM to 5:59 AM | 16 (4.5%) | 8 (2.5%) |
| 6:00 AM to 6:29 AM | 29 (8.2%) | 15 (4.7%) |
| 6:30 AM to 6:59 AM | 27 (7.7%) | 50 (15.6%) |
| 7:00 AM to 7:29 AM | 46 (13.1%) | 56 (17.4%) |
| 7:30 AM to 7:59 AM | 20 (5.7%) | 29 (9.0%) |
| 8:00 AM to 8:29 AM | 22 (6.2%) | 15 (4.7%) |
| 8:30 AM to 8:59 AM | 1 (0.3%) | 6 (1.9%) |
| 9:00 AM to 9:59 AM | 3 (0.9%) | 15 (4.7%) |
| 10:00 AM to 10:59 AM | 0 (0.0%) | 0 (0.0%) |
| 11:00 AM to 11:59 AM | 0 (0.0%) | 51 (15.9%) |
| 12:00 PM to 3:59 PM | 20 (5.7%) | 46 (14.3%) |
| 4:00 PM to 11:59 PM | 14 (4.0%) | 13 (4.1%) |
| Total | 352 (100.0%) | 321 (100.0%) |
Housing Occupancy in Newburg
Occupancy by Ownership in Newburg
Of the total 515 dwellings in Newburg, owner-occupied units account for 375 (72.8%), while renter-occupied units make up 140 (27.2%).
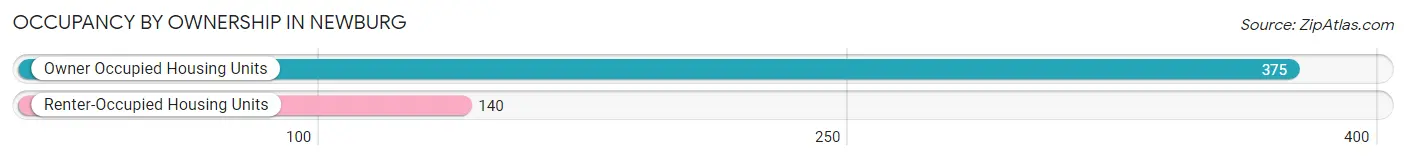
| Occupancy | # Housing Units | % Housing Units |
| Owner Occupied Housing Units | 375 | 72.8% |
| Renter-Occupied Housing Units | 140 | 27.2% |
| Total Occupied Housing Units | 515 | 100.0% |
Occupancy by Household Size in Newburg
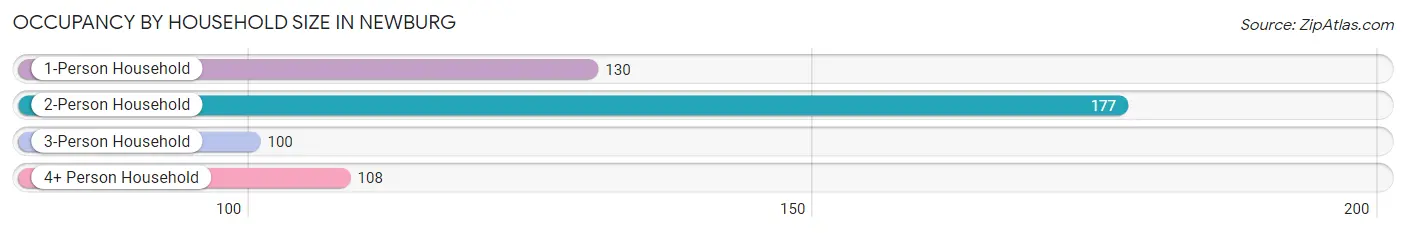
| Household Size | # Housing Units | % Housing Units |
| 1-Person Household | 130 | 25.2% |
| 2-Person Household | 177 | 34.4% |
| 3-Person Household | 100 | 19.4% |
| 4+ Person Household | 108 | 21.0% |
| Total Housing Units | 515 | 100.0% |
Occupancy by Ownership by Household Size in Newburg
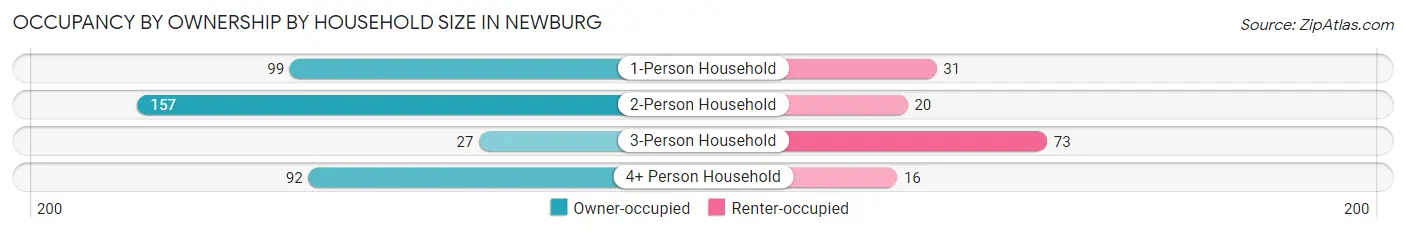
| Household Size | Owner-occupied | Renter-occupied |
| 1-Person Household | 99 (76.1%) | 31 (23.8%) |
| 2-Person Household | 157 (88.7%) | 20 (11.3%) |
| 3-Person Household | 27 (27.0%) | 73 (73.0%) |
| 4+ Person Household | 92 (85.2%) | 16 (14.8%) |
| Total Housing Units | 375 (72.8%) | 140 (27.2%) |
Occupancy by Educational Attainment in Newburg
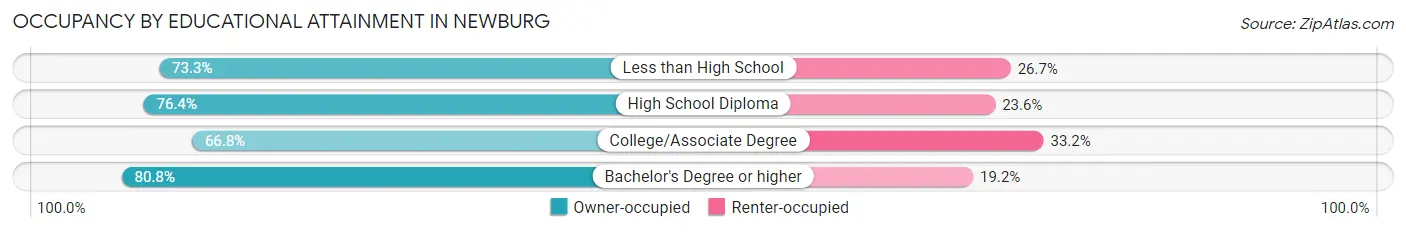
| Household Size | Owner-occupied | Renter-occupied |
| Less than High School | 11 (73.3%) | 4 (26.7%) |
| High School Diploma | 123 (76.4%) | 38 (23.6%) |
| College/Associate Degree | 157 (66.8%) | 78 (33.2%) |
| Bachelor's Degree or higher | 84 (80.8%) | 20 (19.2%) |
Occupancy by Age of Householder in Newburg
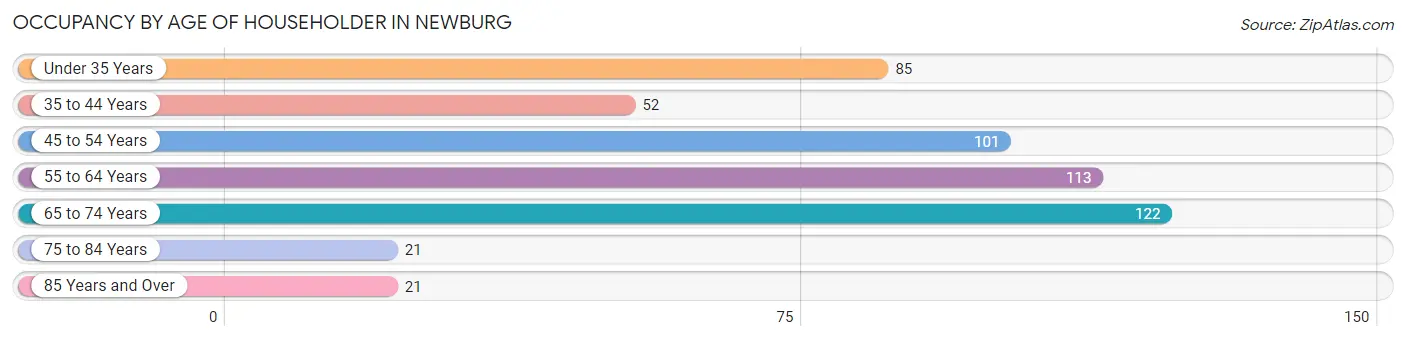
| Age Bracket | # Households | % Households |
| Under 35 Years | 85 | 16.5% |
| 35 to 44 Years | 52 | 10.1% |
| 45 to 54 Years | 101 | 19.6% |
| 55 to 64 Years | 113 | 21.9% |
| 65 to 74 Years | 122 | 23.7% |
| 75 to 84 Years | 21 | 4.1% |
| 85 Years and Over | 21 | 4.1% |
| Total | 515 | 100.0% |
Housing Finances in Newburg
Median Income by Occupancy in Newburg
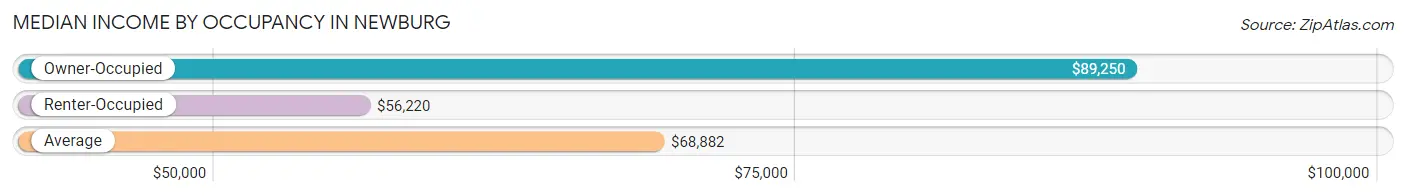
| Occupancy Type | # Households | Median Income |
| Owner-Occupied | 375 (72.8%) | $89,250 |
| Renter-Occupied | 140 (27.2%) | $56,220 |
| Average | 515 (100.0%) | $68,882 |
Occupancy by Householder Income Bracket in Newburg
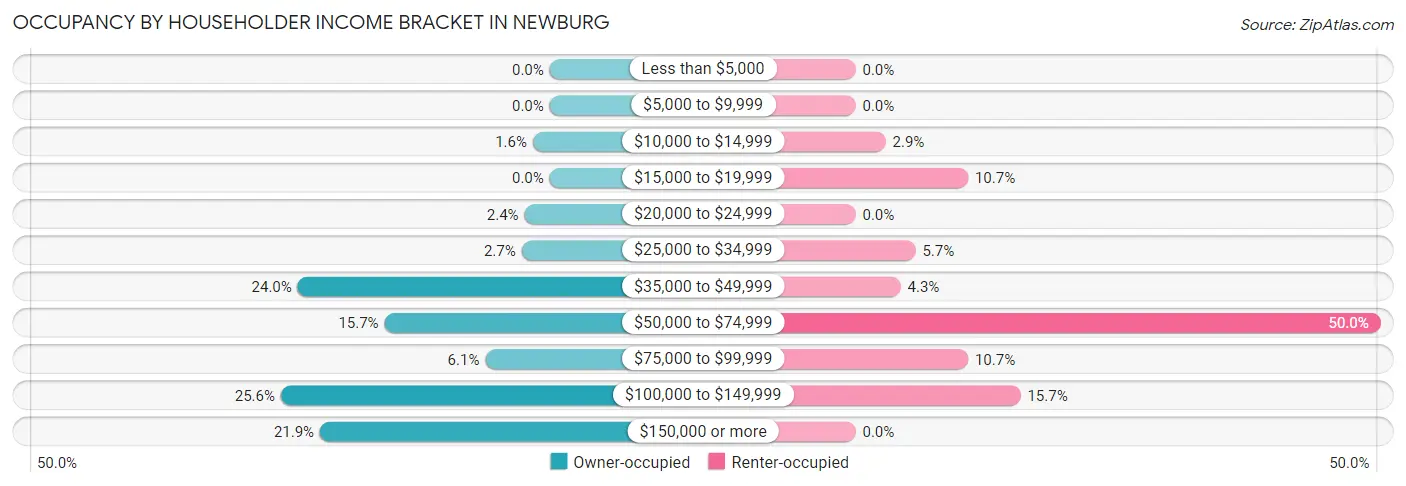
| Income Bracket | Owner-occupied | Renter-occupied |
| Less than $5,000 | 0 (0.0%) | 0 (0.0%) |
| $5,000 to $9,999 | 0 (0.0%) | 0 (0.0%) |
| $10,000 to $14,999 | 6 (1.6%) | 4 (2.9%) |
| $15,000 to $19,999 | 0 (0.0%) | 15 (10.7%) |
| $20,000 to $24,999 | 9 (2.4%) | 0 (0.0%) |
| $25,000 to $34,999 | 10 (2.7%) | 8 (5.7%) |
| $35,000 to $49,999 | 90 (24.0%) | 6 (4.3%) |
| $50,000 to $74,999 | 59 (15.7%) | 70 (50.0%) |
| $75,000 to $99,999 | 23 (6.1%) | 15 (10.7%) |
| $100,000 to $149,999 | 96 (25.6%) | 22 (15.7%) |
| $150,000 or more | 82 (21.9%) | 0 (0.0%) |
| Total | 375 (100.0%) | 140 (100.0%) |
Monthly Housing Cost Tiers in Newburg
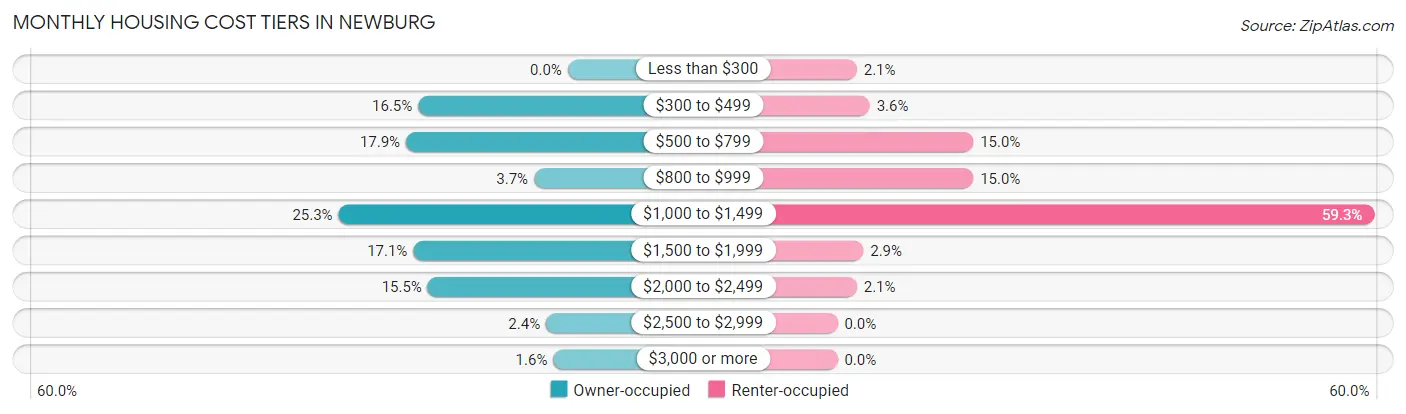
| Monthly Cost | Owner-occupied | Renter-occupied |
| Less than $300 | 0 (0.0%) | 3 (2.1%) |
| $300 to $499 | 62 (16.5%) | 5 (3.6%) |
| $500 to $799 | 67 (17.9%) | 21 (15.0%) |
| $800 to $999 | 14 (3.7%) | 21 (15.0%) |
| $1,000 to $1,499 | 95 (25.3%) | 83 (59.3%) |
| $1,500 to $1,999 | 64 (17.1%) | 4 (2.9%) |
| $2,000 to $2,499 | 58 (15.5%) | 3 (2.1%) |
| $2,500 to $2,999 | 9 (2.4%) | 0 (0.0%) |
| $3,000 or more | 6 (1.6%) | 0 (0.0%) |
| Total | 375 (100.0%) | 140 (100.0%) |
Physical Housing Characteristics in Newburg
Housing Structures in Newburg
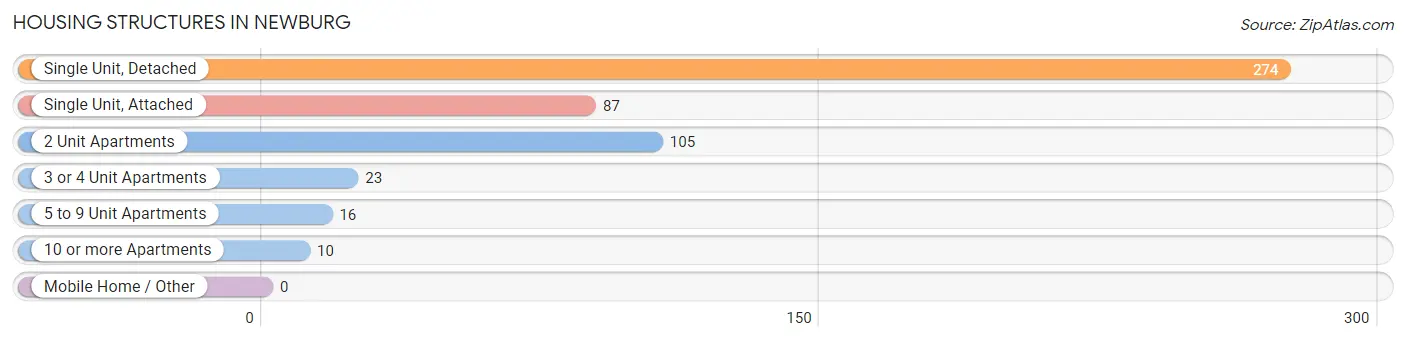
| Structure Type | # Housing Units | % Housing Units |
| Single Unit, Detached | 274 | 53.2% |
| Single Unit, Attached | 87 | 16.9% |
| 2 Unit Apartments | 105 | 20.4% |
| 3 or 4 Unit Apartments | 23 | 4.5% |
| 5 to 9 Unit Apartments | 16 | 3.1% |
| 10 or more Apartments | 10 | 1.9% |
| Mobile Home / Other | 0 | 0.0% |
| Total | 515 | 100.0% |
Housing Structures by Occupancy in Newburg
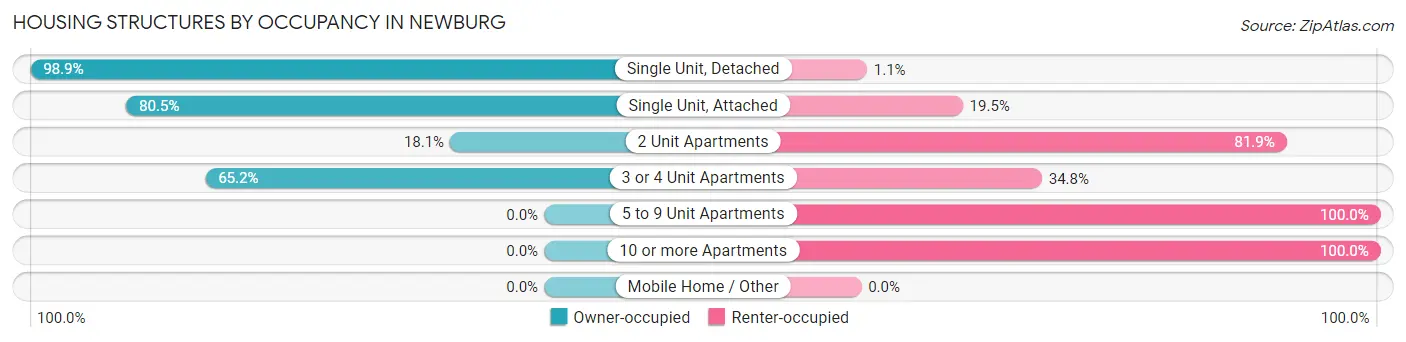
| Structure Type | Owner-occupied | Renter-occupied |
| Single Unit, Detached | 271 (98.9%) | 3 (1.1%) |
| Single Unit, Attached | 70 (80.5%) | 17 (19.5%) |
| 2 Unit Apartments | 19 (18.1%) | 86 (81.9%) |
| 3 or 4 Unit Apartments | 15 (65.2%) | 8 (34.8%) |
| 5 to 9 Unit Apartments | 0 (0.0%) | 16 (100.0%) |
| 10 or more Apartments | 0 (0.0%) | 10 (100.0%) |
| Mobile Home / Other | 0 (0.0%) | 0 (0.0%) |
| Total | 375 (72.8%) | 140 (27.2%) |
Housing Structures by Number of Rooms in Newburg
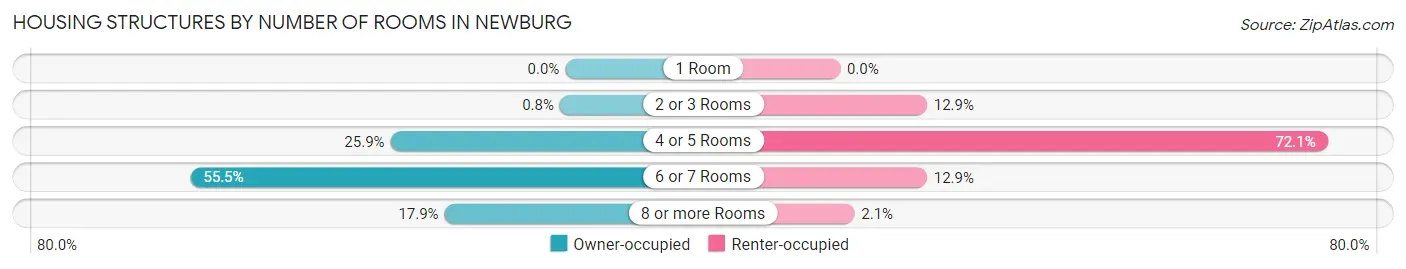
| Number of Rooms | Owner-occupied | Renter-occupied |
| 1 Room | 0 (0.0%) | 0 (0.0%) |
| 2 or 3 Rooms | 3 (0.8%) | 18 (12.9%) |
| 4 or 5 Rooms | 97 (25.9%) | 101 (72.1%) |
| 6 or 7 Rooms | 208 (55.5%) | 18 (12.9%) |
| 8 or more Rooms | 67 (17.9%) | 3 (2.1%) |
| Total | 375 (100.0%) | 140 (100.0%) |
Housing Structure by Heating Type in Newburg
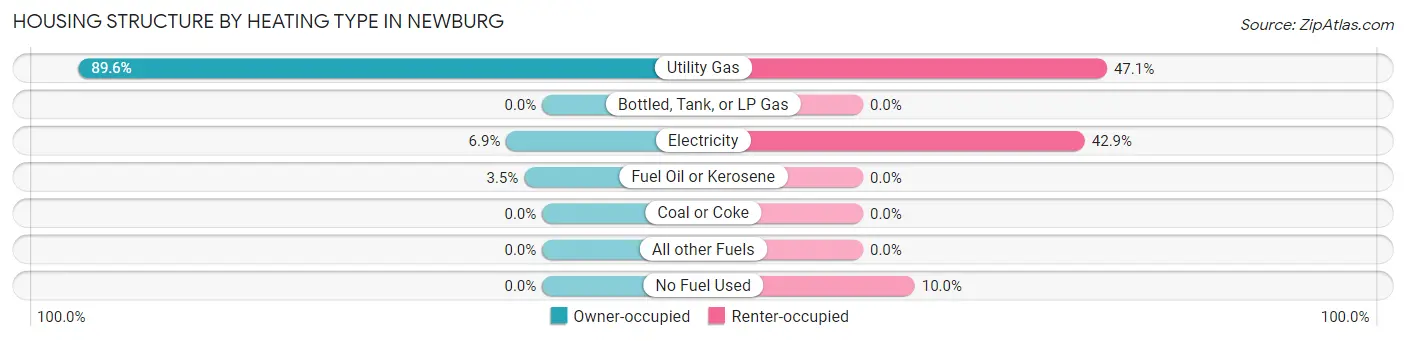
| Heating Type | Owner-occupied | Renter-occupied |
| Utility Gas | 336 (89.6%) | 66 (47.1%) |
| Bottled, Tank, or LP Gas | 0 (0.0%) | 0 (0.0%) |
| Electricity | 26 (6.9%) | 60 (42.9%) |
| Fuel Oil or Kerosene | 13 (3.5%) | 0 (0.0%) |
| Coal or Coke | 0 (0.0%) | 0 (0.0%) |
| All other Fuels | 0 (0.0%) | 0 (0.0%) |
| No Fuel Used | 0 (0.0%) | 14 (10.0%) |
| Total | 375 (100.0%) | 140 (100.0%) |
Household Vehicle Usage in Newburg
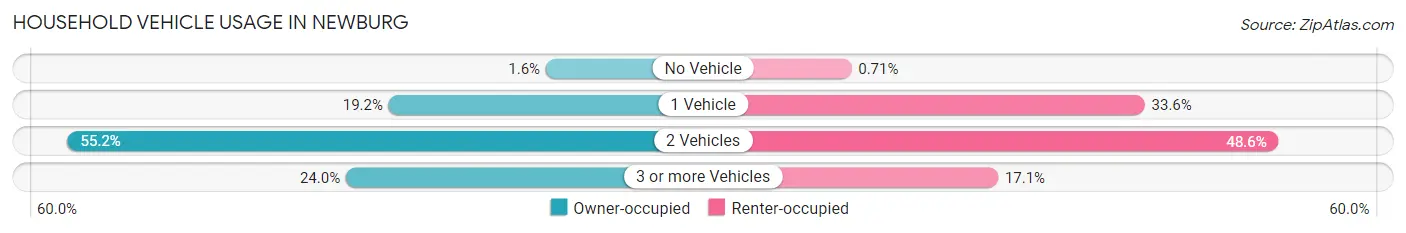
| Vehicles per Household | Owner-occupied | Renter-occupied |
| No Vehicle | 6 (1.6%) | 1 (0.7%) |
| 1 Vehicle | 72 (19.2%) | 47 (33.6%) |
| 2 Vehicles | 207 (55.2%) | 68 (48.6%) |
| 3 or more Vehicles | 90 (24.0%) | 24 (17.1%) |
| Total | 375 (100.0%) | 140 (100.0%) |
Real Estate & Mortgages in Newburg
Real Estate and Mortgage Overview in Newburg
| Characteristic | Without Mortgage | With Mortgage |
| Housing Units | 128 | 247 |
| Median Property Value | $251,900 | $225,700 |
| Median Household Income | $47,317 | $71 |
| Monthly Housing Costs | $510 | $6 |
| Real Estate Taxes | $3,493 | $3 |
Property Value by Mortgage Status in Newburg
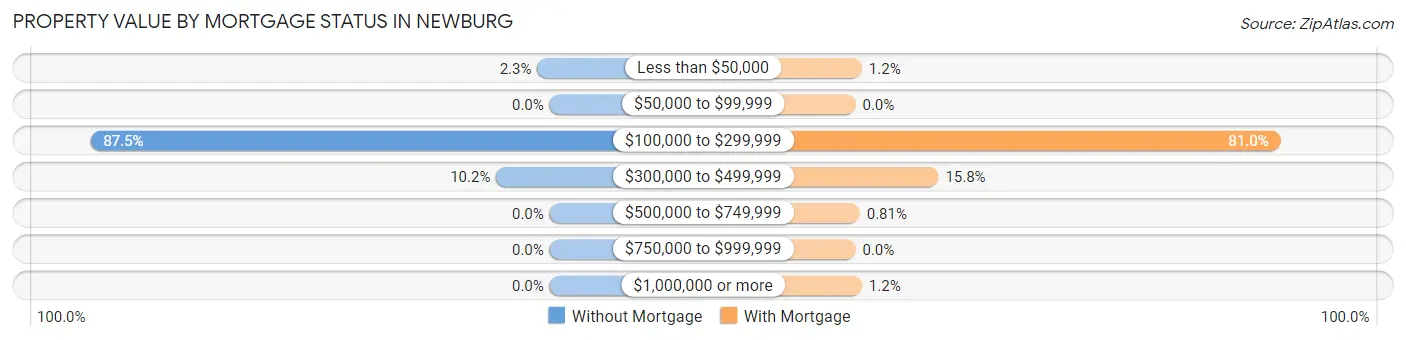
| Property Value | Without Mortgage | With Mortgage |
| Less than $50,000 | 3 (2.3%) | 3 (1.2%) |
| $50,000 to $99,999 | 0 (0.0%) | 0 (0.0%) |
| $100,000 to $299,999 | 112 (87.5%) | 200 (81.0%) |
| $300,000 to $499,999 | 13 (10.2%) | 39 (15.8%) |
| $500,000 to $749,999 | 0 (0.0%) | 2 (0.8%) |
| $750,000 to $999,999 | 0 (0.0%) | 0 (0.0%) |
| $1,000,000 or more | 0 (0.0%) | 3 (1.2%) |
| Total | 128 (100.0%) | 247 (100.0%) |
Household Income by Mortgage Status in Newburg
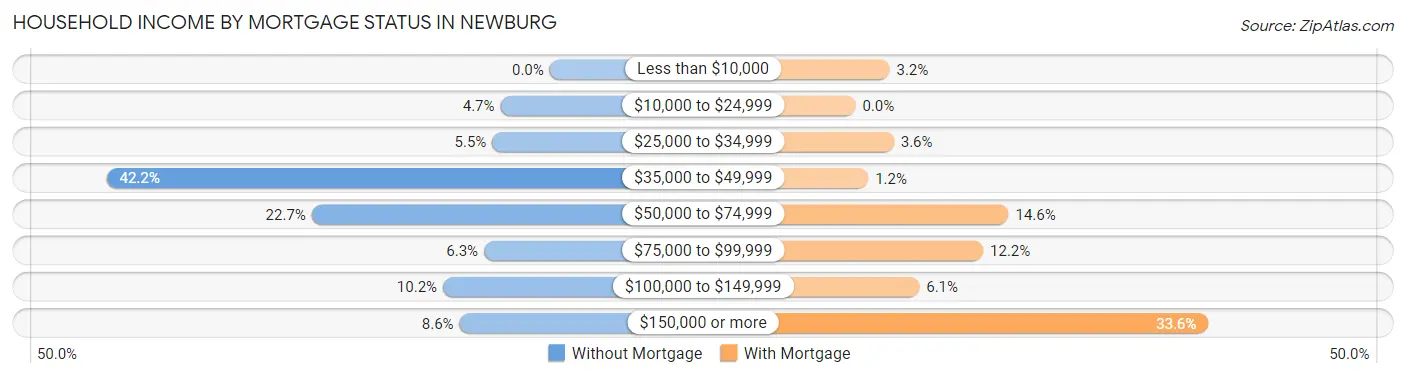
| Household Income | Without Mortgage | With Mortgage |
| Less than $10,000 | 0 (0.0%) | 8 (3.2%) |
| $10,000 to $24,999 | 6 (4.7%) | 0 (0.0%) |
| $25,000 to $34,999 | 7 (5.5%) | 9 (3.6%) |
| $35,000 to $49,999 | 54 (42.2%) | 3 (1.2%) |
| $50,000 to $74,999 | 29 (22.7%) | 36 (14.6%) |
| $75,000 to $99,999 | 8 (6.2%) | 30 (12.1%) |
| $100,000 to $149,999 | 13 (10.2%) | 15 (6.1%) |
| $150,000 or more | 11 (8.6%) | 83 (33.6%) |
| Total | 128 (100.0%) | 247 (100.0%) |
Property Value to Household Income Ratio in Newburg
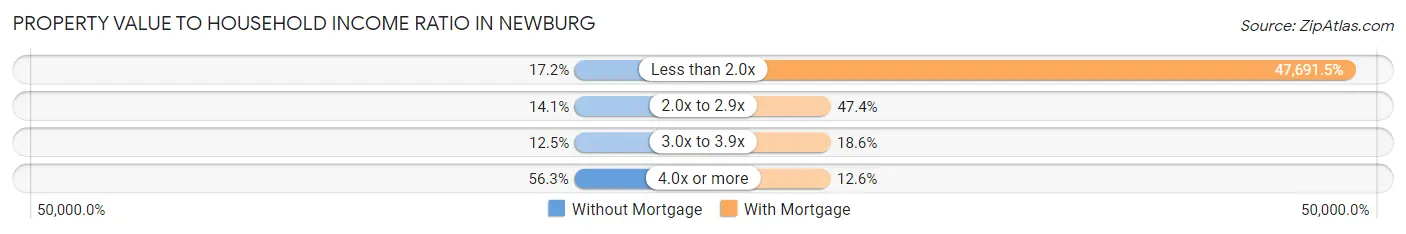
| Value-to-Income Ratio | Without Mortgage | With Mortgage |
| Less than 2.0x | 22 (17.2%) | 117,798 (47,691.5%) |
| 2.0x to 2.9x | 18 (14.1%) | 117 (47.4%) |
| 3.0x to 3.9x | 16 (12.5%) | 46 (18.6%) |
| 4.0x or more | 72 (56.2%) | 31 (12.6%) |
| Total | 128 (100.0%) | 247 (100.0%) |
Real Estate Taxes by Mortgage Status in Newburg
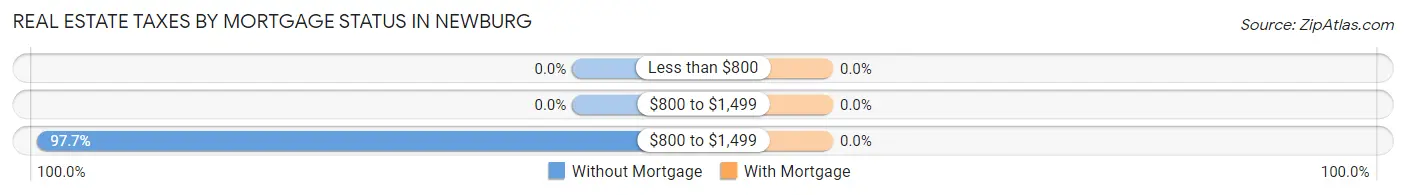
| Property Taxes | Without Mortgage | With Mortgage |
| Less than $800 | 0 (0.0%) | 0 (0.0%) |
| $800 to $1,499 | 0 (0.0%) | 0 (0.0%) |
| $800 to $1,499 | 125 (97.7%) | 0 (0.0%) |
| Total | 128 (100.0%) | 247 (100.0%) |
Health & Disability in Newburg
Health Insurance Coverage by Age in Newburg
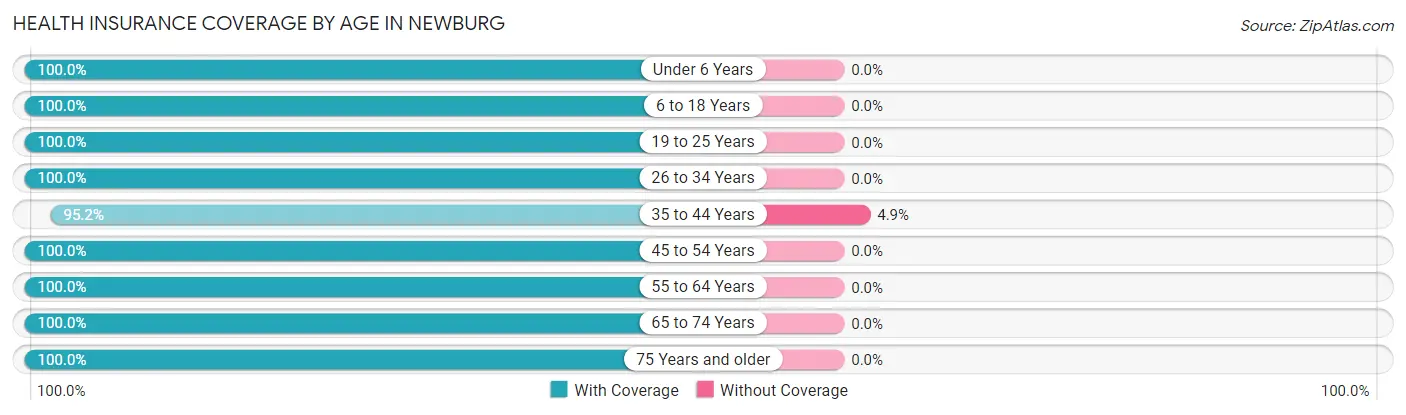
| Age Bracket | With Coverage | Without Coverage |
| Under 6 Years | 168 (100.0%) | 0 (0.0%) |
| 6 to 18 Years | 194 (100.0%) | 0 (0.0%) |
| 19 to 25 Years | 145 (100.0%) | 0 (0.0%) |
| 26 to 34 Years | 99 (100.0%) | 0 (0.0%) |
| 35 to 44 Years | 98 (95.2%) | 5 (4.9%) |
| 45 to 54 Years | 192 (100.0%) | 0 (0.0%) |
| 55 to 64 Years | 187 (100.0%) | 0 (0.0%) |
| 65 to 74 Years | 155 (100.0%) | 0 (0.0%) |
| 75 Years and older | 63 (100.0%) | 0 (0.0%) |
| Total | 1,301 (99.6%) | 5 (0.4%) |
Health Insurance Coverage by Citizenship Status in Newburg
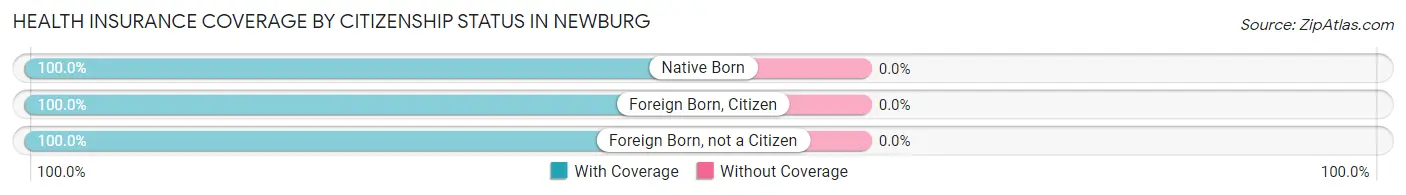
| Citizenship Status | With Coverage | Without Coverage |
| Native Born | 168 (100.0%) | 0 (0.0%) |
| Foreign Born, Citizen | 194 (100.0%) | 0 (0.0%) |
| Foreign Born, not a Citizen | 145 (100.0%) | 0 (0.0%) |
Health Insurance Coverage by Household Income in Newburg
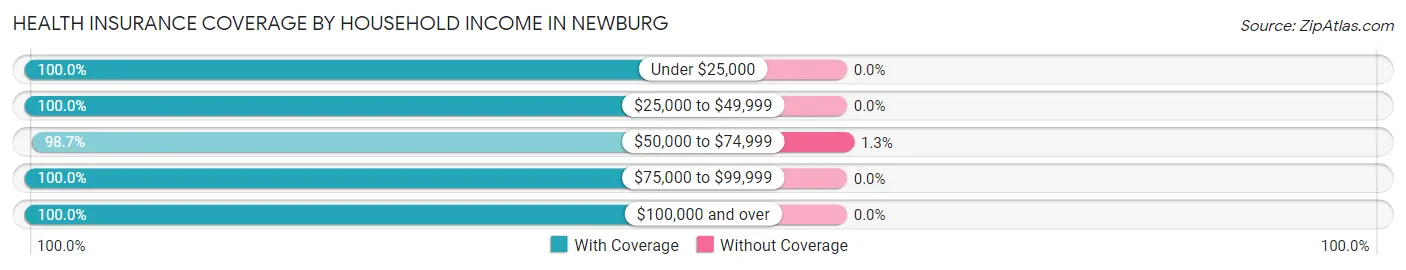
| Household Income | With Coverage | Without Coverage |
| Under $25,000 | 62 (100.0%) | 0 (0.0%) |
| $25,000 to $49,999 | 148 (100.0%) | 0 (0.0%) |
| $50,000 to $74,999 | 368 (98.7%) | 5 (1.3%) |
| $75,000 to $99,999 | 95 (100.0%) | 0 (0.0%) |
| $100,000 and over | 624 (100.0%) | 0 (0.0%) |
Public vs Private Health Insurance Coverage by Age in Newburg
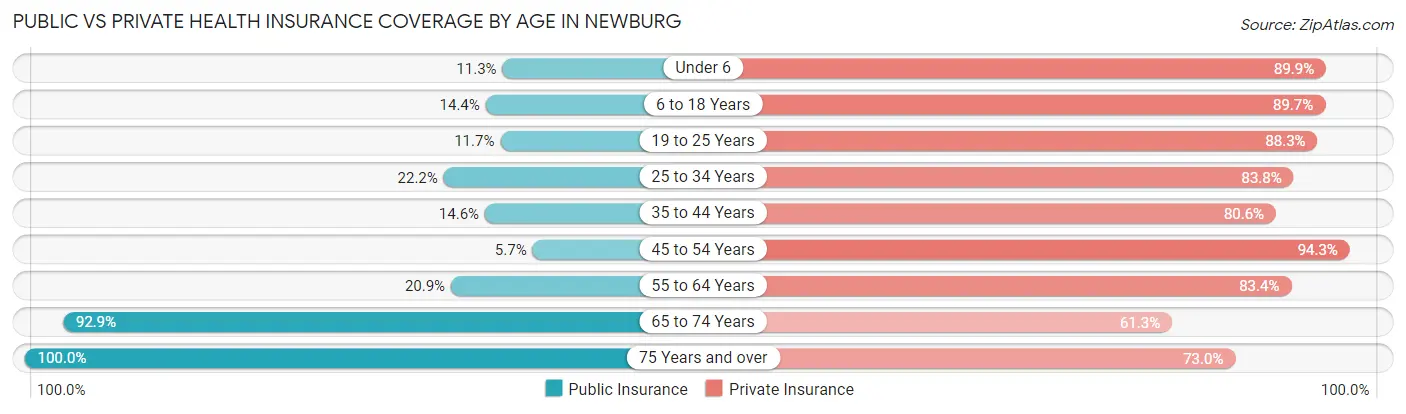
| Age Bracket | Public Insurance | Private Insurance |
| Under 6 | 19 (11.3%) | 151 (89.9%) |
| 6 to 18 Years | 28 (14.4%) | 174 (89.7%) |
| 19 to 25 Years | 17 (11.7%) | 128 (88.3%) |
| 25 to 34 Years | 22 (22.2%) | 83 (83.8%) |
| 35 to 44 Years | 15 (14.6%) | 83 (80.6%) |
| 45 to 54 Years | 11 (5.7%) | 181 (94.3%) |
| 55 to 64 Years | 39 (20.9%) | 156 (83.4%) |
| 65 to 74 Years | 144 (92.9%) | 95 (61.3%) |
| 75 Years and over | 63 (100.0%) | 46 (73.0%) |
| Total | 358 (27.4%) | 1,097 (84.0%) |
Disability Status by Sex by Age in Newburg

| Age Bracket | Male | Female |
| Under 5 Years | 0 (0.0%) | 0 (0.0%) |
| 5 to 17 Years | 7 (8.7%) | 0 (0.0%) |
| 18 to 34 Years | 0 (0.0%) | 10 (7.7%) |
| 35 to 64 Years | 18 (7.4%) | 29 (12.1%) |
| 65 to 74 Years | 23 (29.9%) | 10 (12.8%) |
| 75 Years and over | 20 (69.0%) | 23 (67.6%) |
Disability Class by Sex by Age in Newburg
Disability Class: Hearing Difficulty
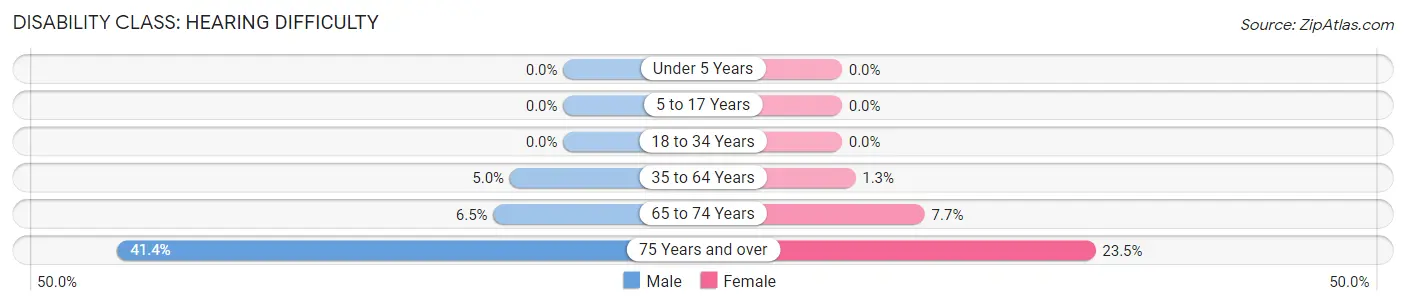
| Age Bracket | Male | Female |
| Under 5 Years | 0 (0.0%) | 0 (0.0%) |
| 5 to 17 Years | 0 (0.0%) | 0 (0.0%) |
| 18 to 34 Years | 0 (0.0%) | 0 (0.0%) |
| 35 to 64 Years | 12 (5.0%) | 3 (1.3%) |
| 65 to 74 Years | 5 (6.5%) | 6 (7.7%) |
| 75 Years and over | 12 (41.4%) | 8 (23.5%) |
Disability Class: Vision Difficulty
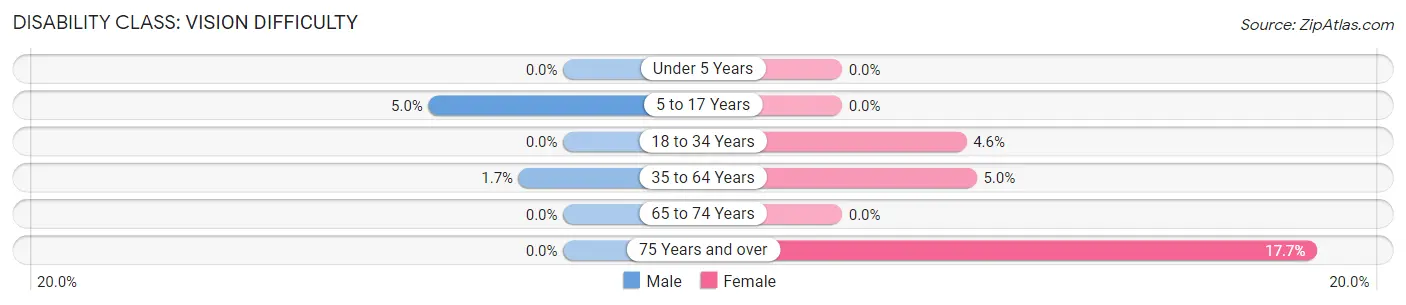
| Age Bracket | Male | Female |
| Under 5 Years | 0 (0.0%) | 0 (0.0%) |
| 5 to 17 Years | 4 (5.0%) | 0 (0.0%) |
| 18 to 34 Years | 0 (0.0%) | 6 (4.6%) |
| 35 to 64 Years | 4 (1.7%) | 12 (5.0%) |
| 65 to 74 Years | 0 (0.0%) | 0 (0.0%) |
| 75 Years and over | 0 (0.0%) | 6 (17.6%) |
Disability Class: Cognitive Difficulty
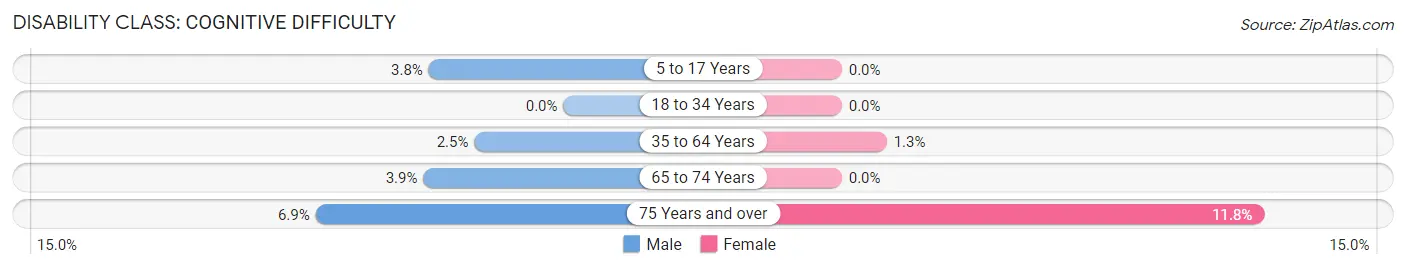
| Age Bracket | Male | Female |
| 5 to 17 Years | 3 (3.7%) | 0 (0.0%) |
| 18 to 34 Years | 0 (0.0%) | 0 (0.0%) |
| 35 to 64 Years | 6 (2.5%) | 3 (1.3%) |
| 65 to 74 Years | 3 (3.9%) | 0 (0.0%) |
| 75 Years and over | 2 (6.9%) | 4 (11.8%) |
Disability Class: Ambulatory Difficulty
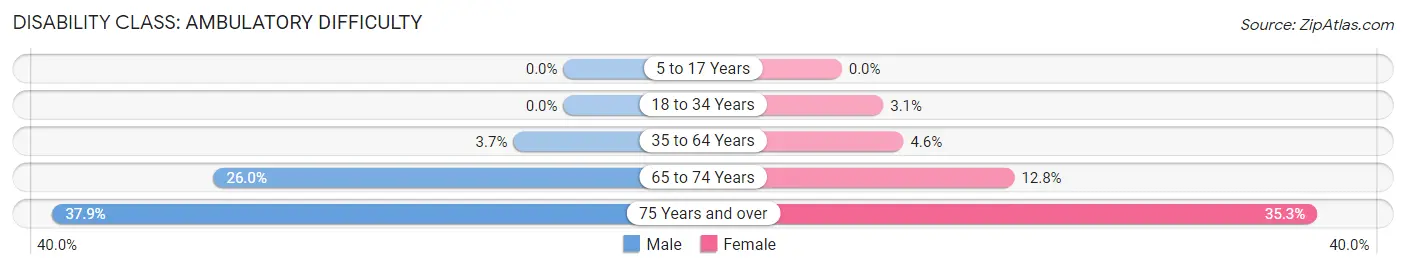
| Age Bracket | Male | Female |
| 5 to 17 Years | 0 (0.0%) | 0 (0.0%) |
| 18 to 34 Years | 0 (0.0%) | 4 (3.1%) |
| 35 to 64 Years | 9 (3.7%) | 11 (4.6%) |
| 65 to 74 Years | 20 (26.0%) | 10 (12.8%) |
| 75 Years and over | 11 (37.9%) | 12 (35.3%) |
Disability Class: Self-Care Difficulty
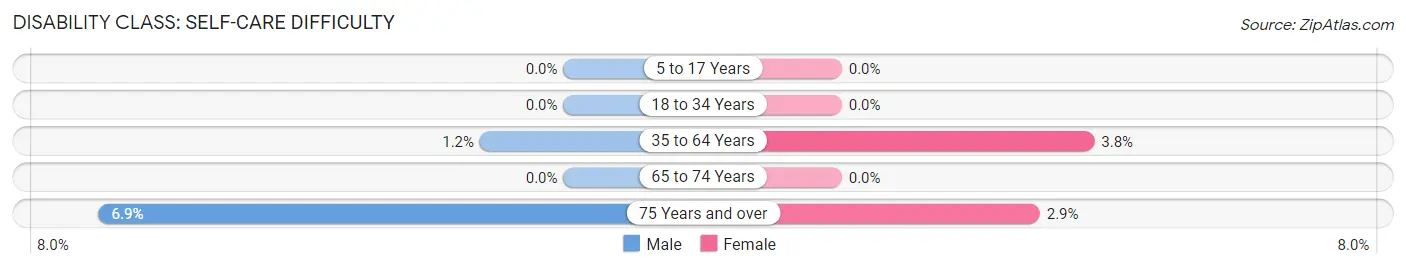
| Age Bracket | Male | Female |
| 5 to 17 Years | 0 (0.0%) | 0 (0.0%) |
| 18 to 34 Years | 0 (0.0%) | 0 (0.0%) |
| 35 to 64 Years | 3 (1.2%) | 9 (3.7%) |
| 65 to 74 Years | 0 (0.0%) | 0 (0.0%) |
| 75 Years and over | 2 (6.9%) | 1 (2.9%) |
Technology Access in Newburg
Computing Device Access in Newburg
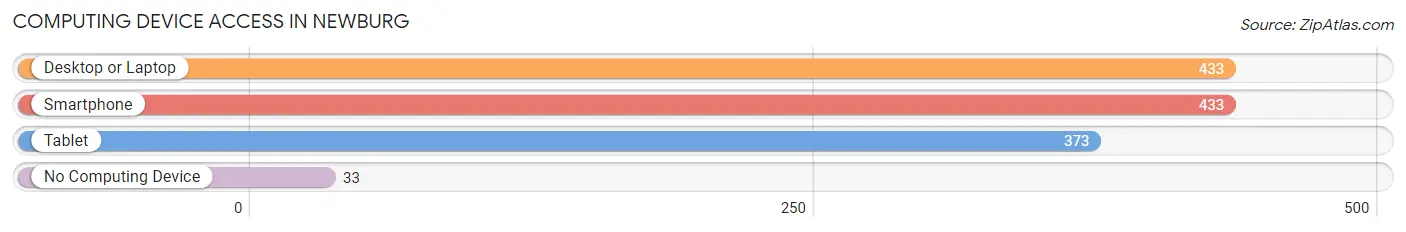
| Device Type | # Households | % Households |
| Desktop or Laptop | 433 | 84.1% |
| Smartphone | 433 | 84.1% |
| Tablet | 373 | 72.4% |
| No Computing Device | 33 | 6.4% |
| Total | 515 | 100.0% |
Internet Access in Newburg
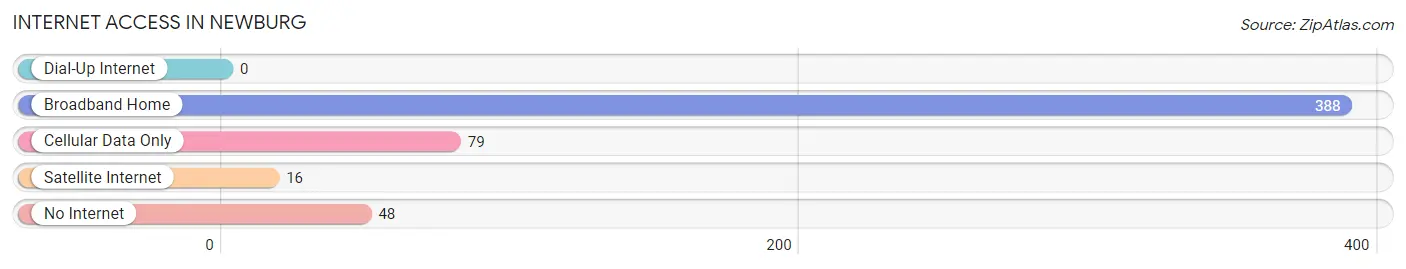
| Internet Type | # Households | % Households |
| Dial-Up Internet | 0 | 0.0% |
| Broadband Home | 388 | 75.3% |
| Cellular Data Only | 79 | 15.3% |
| Satellite Internet | 16 | 3.1% |
| No Internet | 48 | 9.3% |
| Total | 515 | 100.0% |
Newburg Summary
Newburg, Wisconsin is a small village located in Ozaukee County, Wisconsin. It is situated on the western shore of Lake Michigan, about 25 miles north of Milwaukee. The village has a population of approximately 1,400 people and covers an area of 1.2 square miles.
History
Newburg was founded in 1845 by German immigrants who had come to the area in search of a better life. The village was originally known as “New Berlin”, but the name was changed to Newburg in 1848. The village was incorporated in 1854 and has remained a small, rural community ever since.
The village was home to a number of small businesses, including a sawmill, a grist mill, a cheese factory, and a brickyard. The village also had a number of churches, including the St. John’s Lutheran Church, which was founded in 1848.
Geography
Newburg is located in the western part of Ozaukee County, Wisconsin. It is situated on the western shore of Lake Michigan, about 25 miles north of Milwaukee. The village is bordered by the towns of Fredonia to the north, Saukville to the east, and Port Washington to the south.
The village is located in a hilly area, with the highest point being the summit of the Newburg Hill, which is located in the center of the village. The village is also home to a number of small lakes, including Lake Newburg, which is located in the center of the village.
Economy
The economy of Newburg is largely based on agriculture and tourism. The village is home to a number of small farms, which produce a variety of crops, including corn, soybeans, and wheat. The village is also home to a number of small businesses, including restaurants, retail stores, and a few small manufacturing companies.
The village is also a popular tourist destination, due to its proximity to Lake Michigan and its small-town charm. The village is home to a number of small bed and breakfasts, as well as a number of small shops and restaurants.
Demographics
As of the 2010 census, the population of Newburg was 1,400 people. The racial makeup of the village was 97.3% White, 0.7% African American, 0.3% Native American, 0.3% Asian, and 1.4% from other races. The median household income was $50,000, and the median age was 43.
Conclusion
Newburg, Wisconsin is a small village located in Ozaukee County, Wisconsin. It is situated on the western shore of Lake Michigan, about 25 miles north of Milwaukee. The village has a population of approximately 1,400 people and covers an area of 1.2 square miles. The economy of Newburg is largely based on agriculture and tourism, and the village is home to a number of small farms, businesses, and bed and breakfasts. The racial makeup of the village is 97.3% White, 0.7% African American, 0.3% Native American, 0.3% Asian, and 1.4% from other races. The median household income was $50,000, and the median age was 43.
Common Questions
What is Per Capita Income in Newburg?
Per Capita income in Newburg is $36,630.
What is the Median Family Income in Newburg?
Median Family Income in Newburg is $91,389.
What is the Median Household income in Newburg?
Median Household Income in Newburg is $68,882.
What is Income or Wage Gap in Newburg?
Income or Wage Gap in Newburg is 47.8%.
Women in Newburg earn 52.2 cents for every dollar earned by a man.
What is Inequality or Gini Index in Newburg?
Inequality or Gini Index in Newburg is 0.36.
What is the Total Population of Newburg?
Total Population of Newburg is 1,306.
What is the Total Male Population of Newburg?
Total Male Population of Newburg is 591.
What is the Total Female Population of Newburg?
Total Female Population of Newburg is 715.
What is the Ratio of Males per 100 Females in Newburg?
There are 82.66 Males per 100 Females in Newburg.
What is the Ratio of Females per 100 Males in Newburg?
There are 120.98 Females per 100 Males in Newburg.
What is the Median Population Age in Newburg?
Median Population Age in Newburg is 39.3 Years.
What is the Average Family Size in Newburg
Average Family Size in Newburg is 3.0 People.
What is the Average Household Size in Newburg
Average Household Size in Newburg is 2.5 People.
How Large is the Labor Force in Newburg?
There are 742 People in the Labor Forcein in Newburg.
What is the Percentage of People in the Labor Force in Newburg?
74.0% of People are in the Labor Force in Newburg.
What is the Unemployment Rate in Newburg?
Unemployment Rate in Newburg is 3.5%.