Melvina, WI Map & Demographics
Melvina Map
Melvina Overview
$38,834
PER CAPITA INCOME
$62,000
AVG FAMILY INCOME
$68,000
AVG HOUSEHOLD INCOME
25.0%
WAGE / INCOME GAP [ % ]
75.0¢/ $1
WAGE / INCOME GAP [ $ ]
0.33
INEQUALITY / GINI INDEX
91
TOTAL POPULATION
37
MALE POPULATION
54
FEMALE POPULATION
68.52
MALES / 100 FEMALES
145.95
FEMALES / 100 MALES
42.8
MEDIAN AGE
2.7
AVG FAMILY SIZE
2.5
AVG HOUSEHOLD SIZE
63
LABOR FORCE [ PEOPLE ]
85.1%
PERCENT IN LABOR FORCE
Income in Melvina
Income Overview in Melvina
Per Capita Income in Melvina is $38,834, while median incomes of families and households are $62,000 and $68,000 respectively.
| Characteristic | Number | Measure |
| Per Capita Income | 91 | $38,834 |
| Median Family Income | 30 | $62,000 |
| Mean Family Income | 30 | $95,527 |
| Median Household Income | 36 | $68,000 |
| Mean Household Income | 36 | $89,931 |
| Income Deficit | 30 | $0 |
| Wage / Income Gap (%) | 91 | 25.00% |
| Wage / Income Gap ($) | 91 | 75.00¢ per $1 |
| Gini / Inequality Index | 91 | 0.33 |
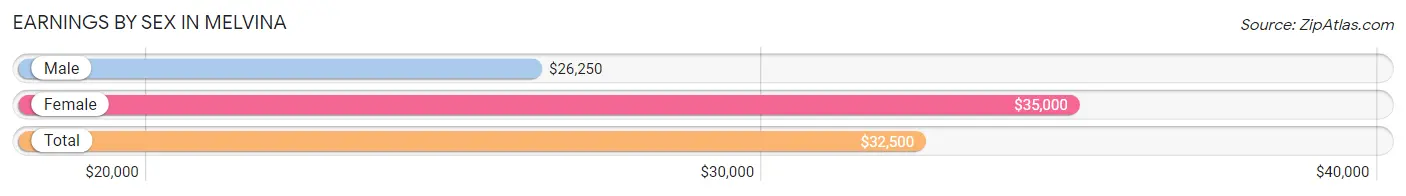
Earnings by Sex in Melvina
Average Earnings in Melvina are $32,500, $26,250 for men and $35,000 for women, a difference of 25.0%.
| Sex | Number | Average Earnings |
| Male | 30 (45.5%) | $26,250 |
| Female | 36 (54.5%) | $35,000 |
| Total | 66 (100.0%) | $32,500 |
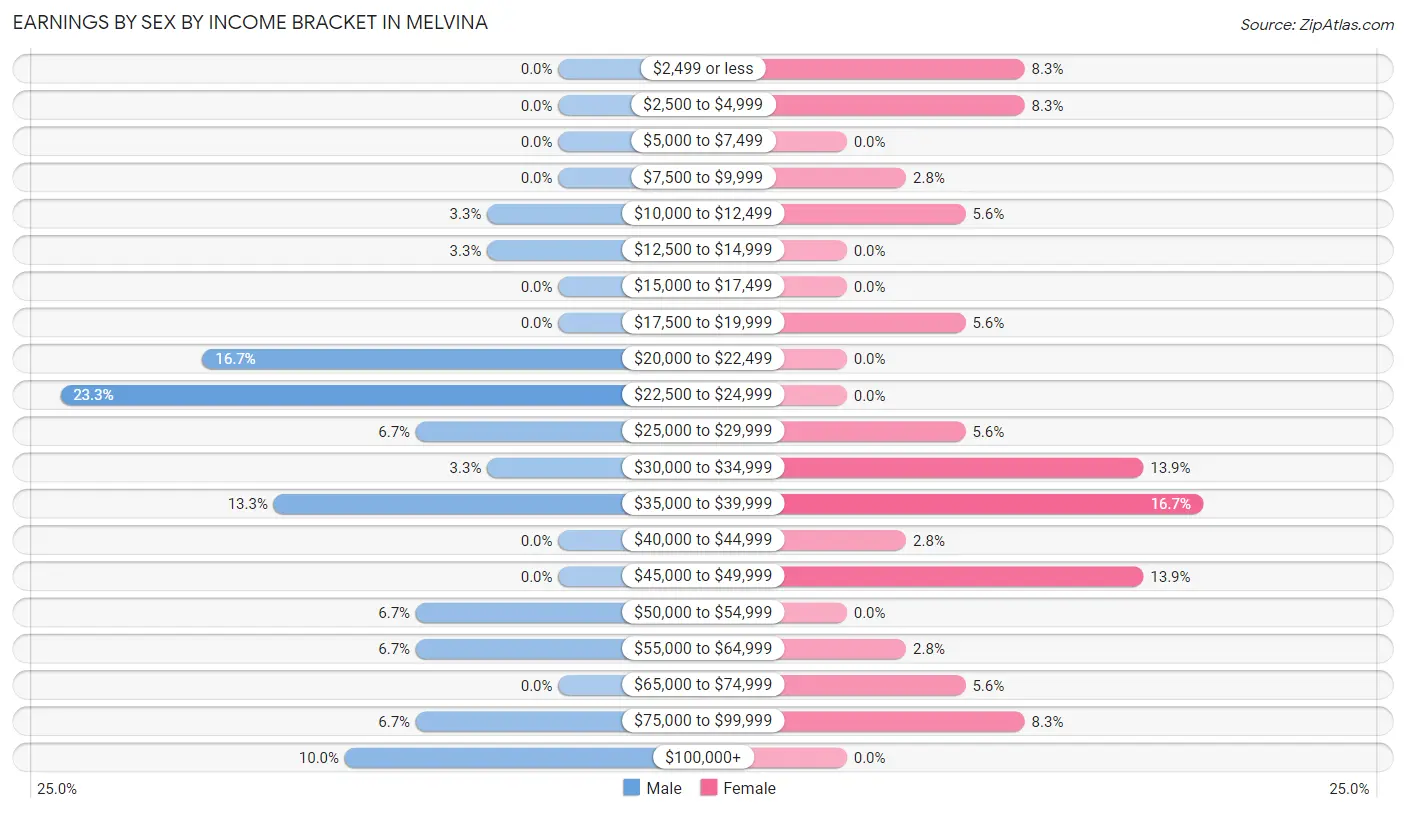
Earnings by Sex by Income Bracket in Melvina
The most common earnings brackets in Melvina are $22,500 to $24,999 for men (7 | 23.3%) and $35,000 to $39,999 for women (6 | 16.7%).
| Income | Male | Female |
| $2,499 or less | 0 (0.0%) | 3 (8.3%) |
| $2,500 to $4,999 | 0 (0.0%) | 3 (8.3%) |
| $5,000 to $7,499 | 0 (0.0%) | 0 (0.0%) |
| $7,500 to $9,999 | 0 (0.0%) | 1 (2.8%) |
| $10,000 to $12,499 | 1 (3.3%) | 2 (5.6%) |
| $12,500 to $14,999 | 1 (3.3%) | 0 (0.0%) |
| $15,000 to $17,499 | 0 (0.0%) | 0 (0.0%) |
| $17,500 to $19,999 | 0 (0.0%) | 2 (5.6%) |
| $20,000 to $22,499 | 5 (16.7%) | 0 (0.0%) |
| $22,500 to $24,999 | 7 (23.3%) | 0 (0.0%) |
| $25,000 to $29,999 | 2 (6.7%) | 2 (5.6%) |
| $30,000 to $34,999 | 1 (3.3%) | 5 (13.9%) |
| $35,000 to $39,999 | 4 (13.3%) | 6 (16.7%) |
| $40,000 to $44,999 | 0 (0.0%) | 1 (2.8%) |
| $45,000 to $49,999 | 0 (0.0%) | 5 (13.9%) |
| $50,000 to $54,999 | 2 (6.7%) | 0 (0.0%) |
| $55,000 to $64,999 | 2 (6.7%) | 1 (2.8%) |
| $65,000 to $74,999 | 0 (0.0%) | 2 (5.6%) |
| $75,000 to $99,999 | 2 (6.7%) | 3 (8.3%) |
| $100,000+ | 3 (10.0%) | 0 (0.0%) |
| Total | 30 (100.0%) | 36 (100.0%) |
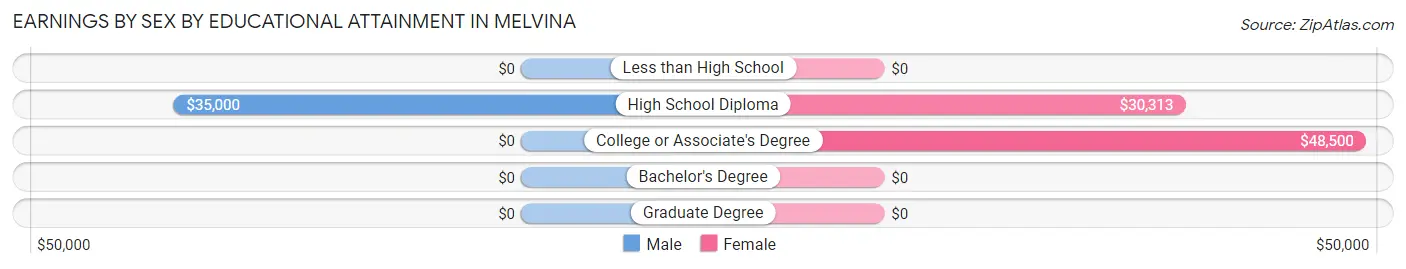
Earnings by Sex by Educational Attainment in Melvina
Average earnings in Melvina are $26,250 for men and $35,500 for women, a difference of 26.1%. Men with an educational attainment of high school diploma enjoy the highest average annual earnings of $35,000, while those with high school diploma education earn the least with $35,000. Women with an educational attainment of college or associate's degree earn the most with the average annual earnings of $48,500, while those with high school diploma education have the smallest earnings of $30,313.
| Educational Attainment | Male Income | Female Income |
| Less than High School | - | - |
| High School Diploma | $35,000 | $30,313 |
| College or Associate's Degree | - | - |
| Bachelor's Degree | - | - |
| Graduate Degree | - | - |
| Total | $26,250 | $35,500 |
Family Income in Melvina
Family Income Brackets in Melvina
According to the Melvina family income data, there are 11 families falling into the $35,000 to $49,999 income range, which is the most common income bracket and makes up 36.7% of all families.
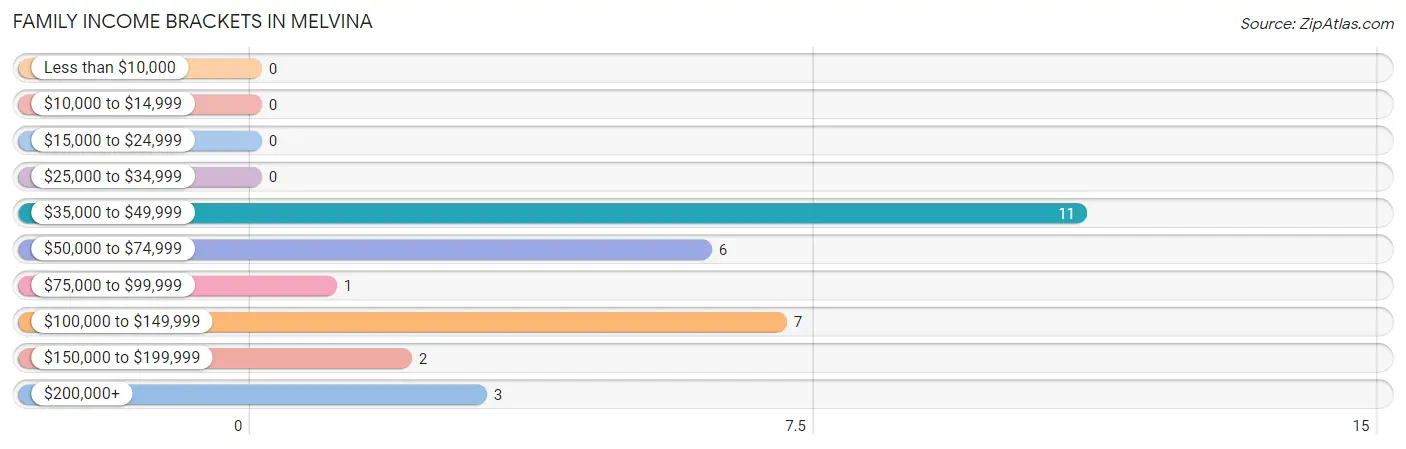
| Income Bracket | # Families | % Families |
| Less than $10,000 | 0 | 0.0% |
| $10,000 to $14,999 | 0 | 0.0% |
| $15,000 to $24,999 | 0 | 0.0% |
| $25,000 to $34,999 | 0 | 0.0% |
| $35,000 to $49,999 | 11 | 36.7% |
| $50,000 to $74,999 | 6 | 20.0% |
| $75,000 to $99,999 | 1 | 3.3% |
| $100,000 to $149,999 | 7 | 23.3% |
| $150,000 to $199,999 | 2 | 6.7% |
| $200,000+ | 3 | 10.0% |
Family Income by Famaliy Size in Melvina
2-person families (21 | 70.0%) account for the highest median family income in Melvina with $60,250 per family, while 2-person families (21 | 70.0%) have the highest median income of $30,125 per family member.
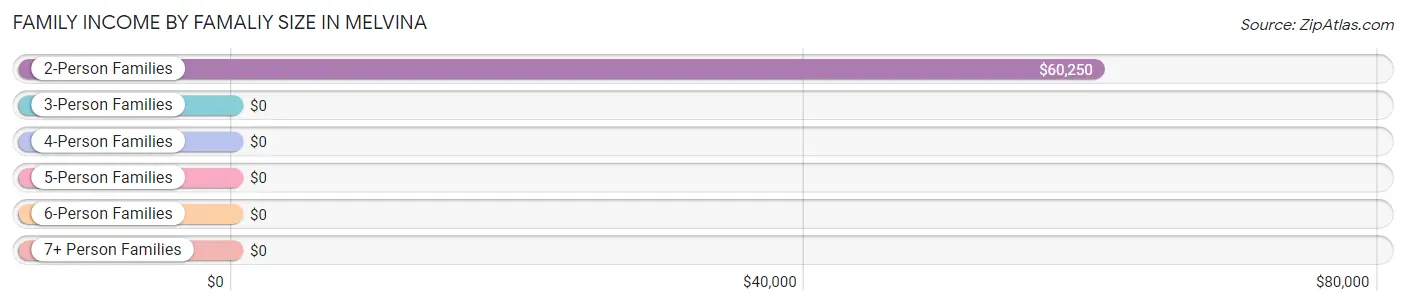
| Income Bracket | # Families | Median Income |
| 2-Person Families | 21 (70.0%) | $60,250 |
| 3-Person Families | 6 (20.0%) | $0 |
| 4-Person Families | 2 (6.7%) | $0 |
| 5-Person Families | 1 (3.3%) | $0 |
| 6-Person Families | 0 (0.0%) | $0 |
| 7+ Person Families | 0 (0.0%) | $0 |
| Total | 30 (100.0%) | $62,000 |
Family Income by Number of Earners in Melvina
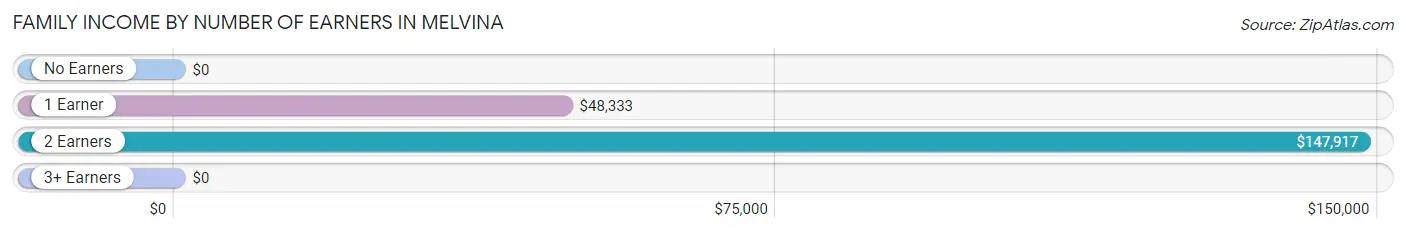
| Number of Earners | # Families | Median Income |
| No Earners | 1 (3.3%) | $0 |
| 1 Earner | 14 (46.7%) | $48,333 |
| 2 Earners | 9 (30.0%) | $147,917 |
| 3+ Earners | 6 (20.0%) | $0 |
| Total | 30 (100.0%) | $62,000 |
Household Income in Melvina
Household Income Brackets in Melvina
With 12 households falling in the category, the $50,000 to $74,999 income range is the most frequent in Melvina, accounting for 33.3% of all households.
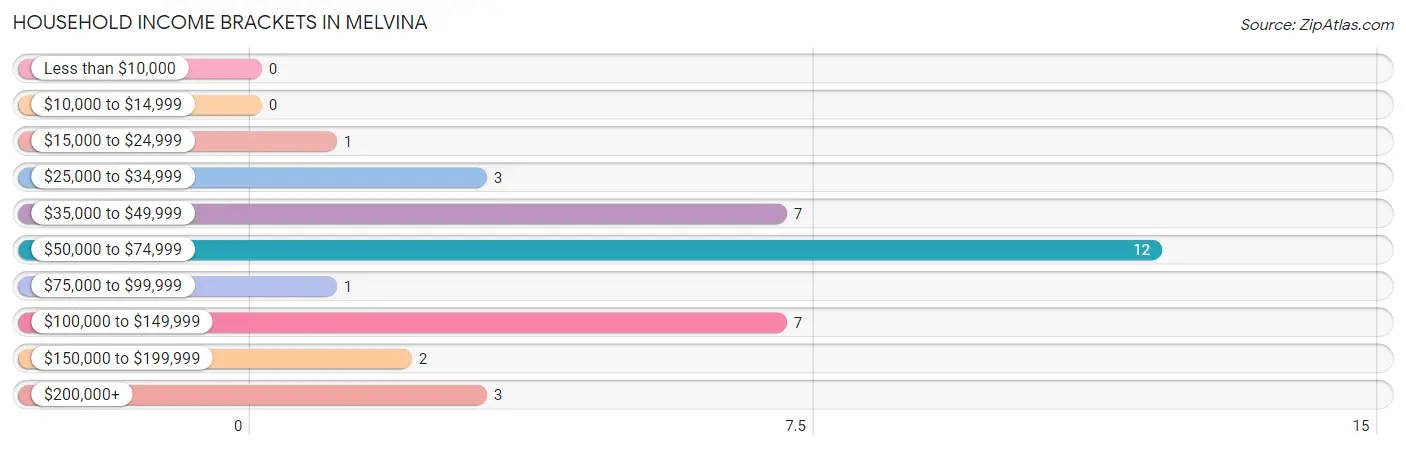
| Income Bracket | # Households | % Households |
| Less than $10,000 | 0 | 0.0% |
| $10,000 to $14,999 | 0 | 0.0% |
| $15,000 to $24,999 | 1 | 2.8% |
| $25,000 to $34,999 | 3 | 8.3% |
| $35,000 to $49,999 | 7 | 19.4% |
| $50,000 to $74,999 | 12 | 33.3% |
| $75,000 to $99,999 | 1 | 2.8% |
| $100,000 to $149,999 | 7 | 19.4% |
| $150,000 to $199,999 | 2 | 5.6% |
| $200,000+ | 3 | 8.3% |
Household Income by Householder Age in Melvina
The median household income in Melvina is $68,000, with the highest median household income of $88,750 found in the 65+ years age bracket for the primary householder. A total of 5 households (13.9%) fall into this category.
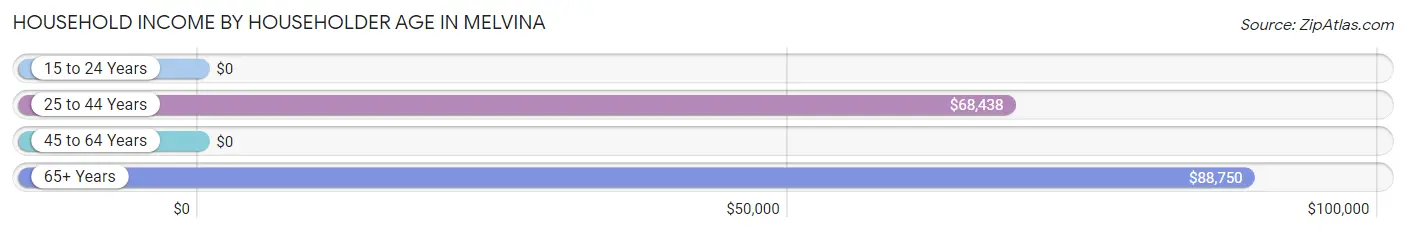
| Income Bracket | # Households | Median Income |
| 15 to 24 Years | 0 (0.0%) | $0 |
| 25 to 44 Years | 17 (47.2%) | $68,438 |
| 45 to 64 Years | 14 (38.9%) | $0 |
| 65+ Years | 5 (13.9%) | $88,750 |
| Total | 36 (100.0%) | $68,000 |
Poverty in Melvina
Income Below Poverty by Sex and Age in Melvina
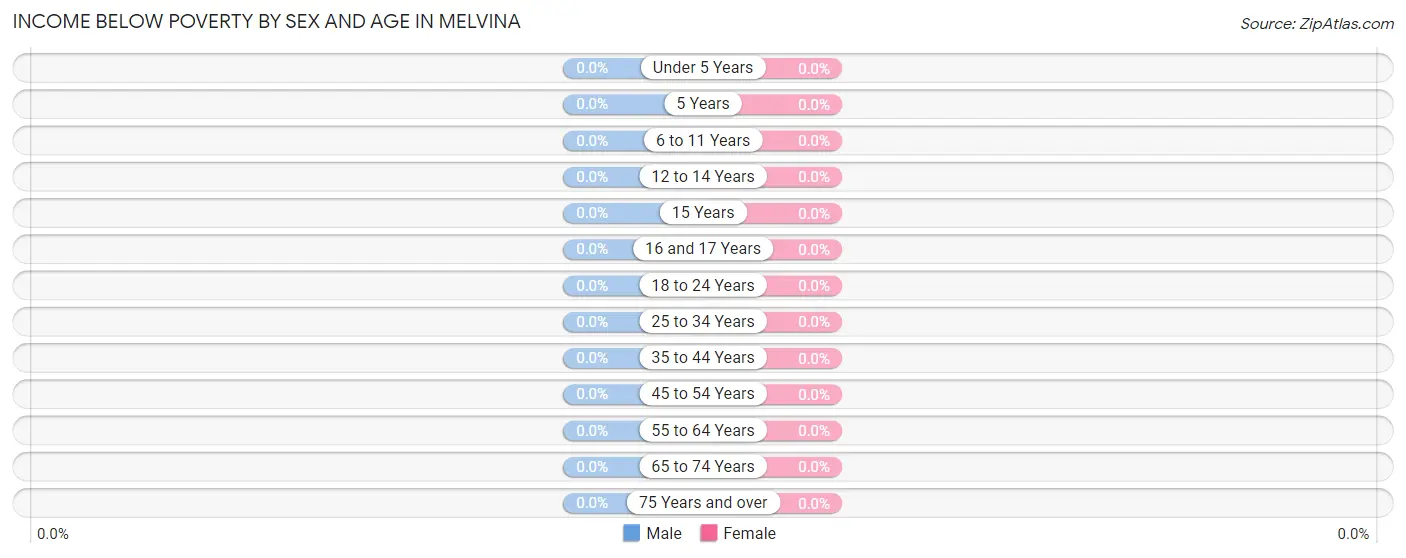
| Age Bracket | Male | Female |
| Under 5 Years | 0 (0.0%) | 0 (0.0%) |
| 5 Years | 0 (0.0%) | 0 (0.0%) |
| 6 to 11 Years | 0 (0.0%) | 0 (0.0%) |
| 12 to 14 Years | 0 (0.0%) | 0 (0.0%) |
| 15 Years | 0 (0.0%) | 0 (0.0%) |
| 16 and 17 Years | 0 (0.0%) | 0 (0.0%) |
| 18 to 24 Years | 0 (0.0%) | 0 (0.0%) |
| 25 to 34 Years | 0 (0.0%) | 0 (0.0%) |
| 35 to 44 Years | 0 (0.0%) | 0 (0.0%) |
| 45 to 54 Years | 0 (0.0%) | 0 (0.0%) |
| 55 to 64 Years | 0 (0.0%) | 0 (0.0%) |
| 65 to 74 Years | 0 (0.0%) | 0 (0.0%) |
| 75 Years and over | 0 (0.0%) | 0 (0.0%) |
| Total | 0 (0.0%) | 0 (0.0%) |
Income Above Poverty by Sex and Age in Melvina
According to the poverty statistics in Melvina, males aged 5 years and females aged under 5 years are the age groups that are most secure financially, with 100.0% of males and 100.0% of females in these age groups living above the poverty line.
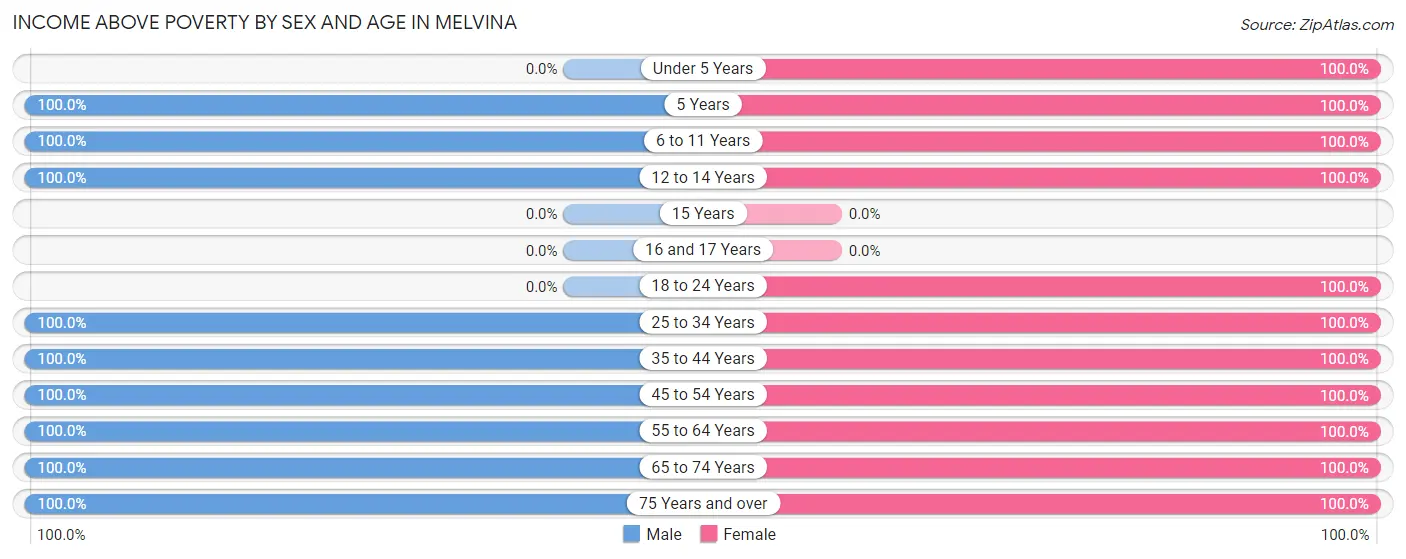
| Age Bracket | Male | Female |
| Under 5 Years | 0 (0.0%) | 3 (100.0%) |
| 5 Years | 1 (100.0%) | 2 (100.0%) |
| 6 to 11 Years | 1 (100.0%) | 6 (100.0%) |
| 12 to 14 Years | 1 (100.0%) | 3 (100.0%) |
| 15 Years | 0 (0.0%) | 0 (0.0%) |
| 16 and 17 Years | 0 (0.0%) | 0 (0.0%) |
| 18 to 24 Years | 0 (0.0%) | 2 (100.0%) |
| 25 to 34 Years | 3 (100.0%) | 8 (100.0%) |
| 35 to 44 Years | 7 (100.0%) | 9 (100.0%) |
| 45 to 54 Years | 5 (100.0%) | 2 (100.0%) |
| 55 to 64 Years | 14 (100.0%) | 13 (100.0%) |
| 65 to 74 Years | 3 (100.0%) | 2 (100.0%) |
| 75 Years and over | 2 (100.0%) | 4 (100.0%) |
| Total | 37 (100.0%) | 54 (100.0%) |
Income Below Poverty Among Married-Couple Families in Melvina
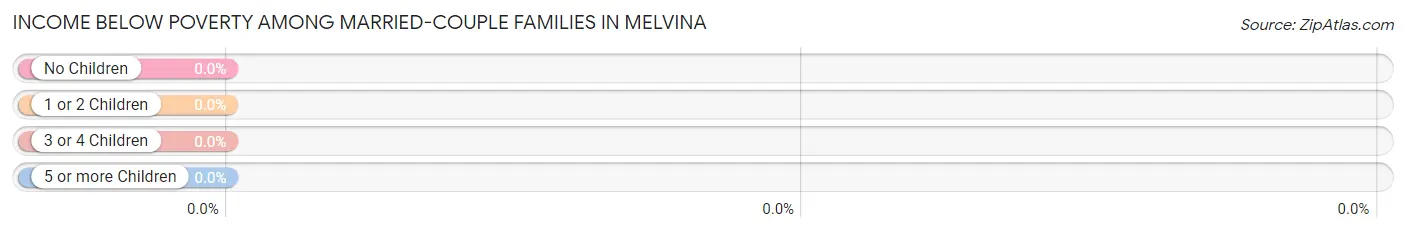
| Children | Above Poverty | Below Poverty |
| No Children | 18 (100.0%) | 0 (0.0%) |
| 1 or 2 Children | 2 (100.0%) | 0 (0.0%) |
| 3 or 4 Children | 1 (100.0%) | 0 (0.0%) |
| 5 or more Children | 0 (0.0%) | 0 (0.0%) |
| Total | 21 (100.0%) | 0 (0.0%) |
Income Below Poverty Among Single-Parent Households in Melvina
| Children | Single Father | Single Mother |
| No Children | 0 (0.0%) | 0 (0.0%) |
| 1 or 2 Children | 0 (0.0%) | 0 (0.0%) |
| 3 or 4 Children | 0 (0.0%) | 0 (0.0%) |
| 5 or more Children | 0 (0.0%) | 0 (0.0%) |
| Total | 0 (0.0%) | 0 (0.0%) |
Income Below Poverty Among Married-Couple vs Single-Parent Households in Melvina
| Children | Married-Couple Families | Single-Parent Households |
| No Children | 0 (0.0%) | 0 (0.0%) |
| 1 or 2 Children | 0 (0.0%) | 0 (0.0%) |
| 3 or 4 Children | 0 (0.0%) | 0 (0.0%) |
| 5 or more Children | 0 (0.0%) | 0 (0.0%) |
| Total | 0 (0.0%) | 0 (0.0%) |
Race in Melvina
The most populous races in Melvina are , and White / Caucasian (91 | 100.0%).
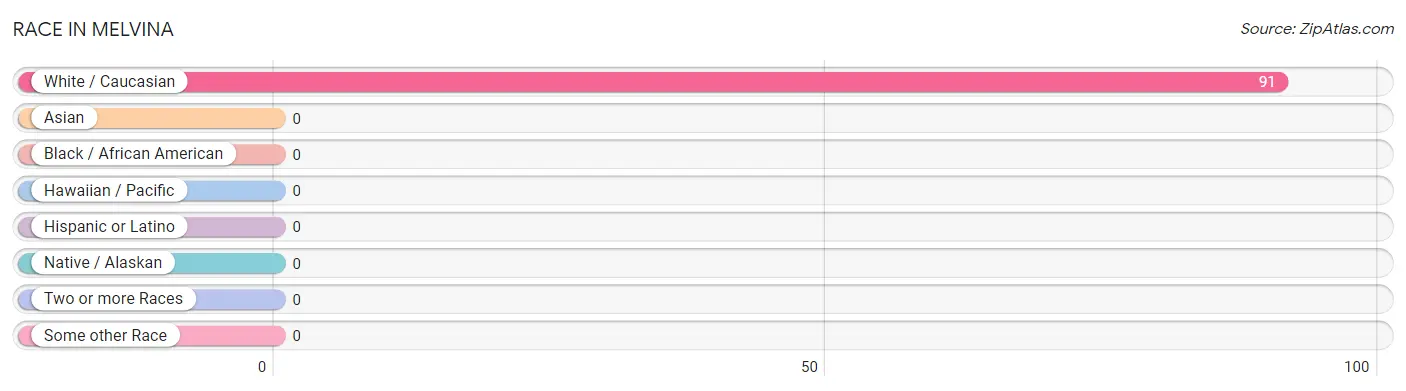
| Race | # Population | % Population |
| Asian | 0 | 0.0% |
| Black / African American | 0 | 0.0% |
| Hawaiian / Pacific | 0 | 0.0% |
| Hispanic or Latino | 0 | 0.0% |
| Native / Alaskan | 0 | 0.0% |
| White / Caucasian | 91 | 100.0% |
| Two or more Races | 0 | 0.0% |
| Some other Race | 0 | 0.0% |
| Total | 91 | 100.0% |
Ancestry in Melvina
The most populous ancestries reported in Melvina are German (29 | 31.9%), Norwegian (13 | 14.3%), Czech (7 | 7.7%), French (7 | 7.7%), and American (5 | 5.5%), together accounting for 67.0% of all Melvina residents.
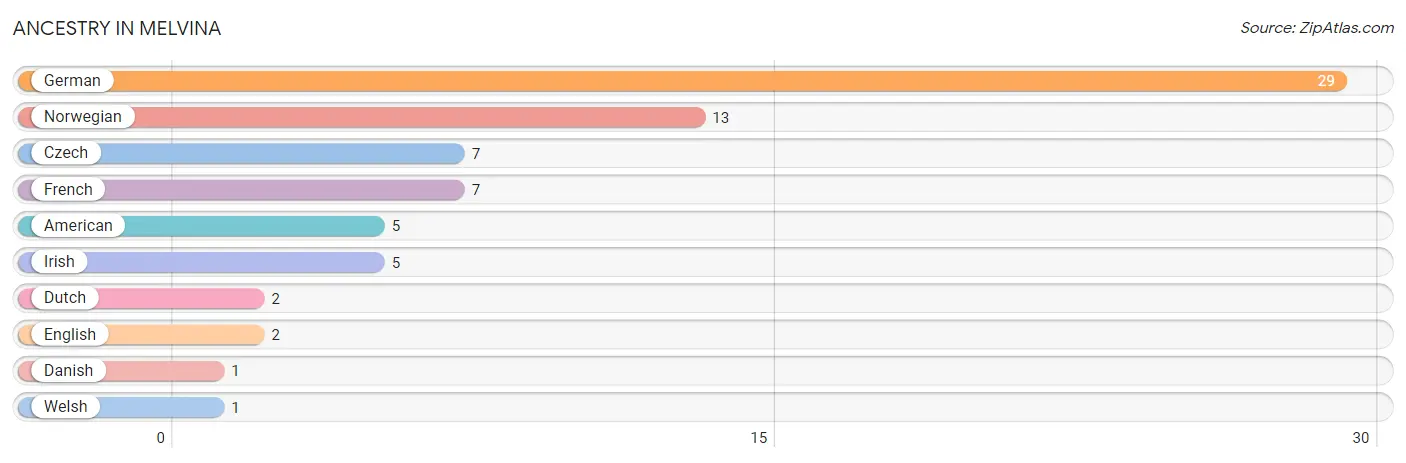
| Ancestry | # Population | % Population |
| American | 5 | 5.5% |
| Czech | 7 | 7.7% |
| Danish | 1 | 1.1% |
| Dutch | 2 | 2.2% |
| English | 2 | 2.2% |
| French | 7 | 7.7% |
| German | 29 | 31.9% |
| Irish | 5 | 5.5% |
| Norwegian | 13 | 14.3% |
| Welsh | 1 | 1.1% | View All 10 Rows |
Immigrants in Melvina

| Immigration Origin | # Population | % Population | View All 0 Rows |
Sex and Age in Melvina
Sex and Age in Melvina
The most populous age groups in Melvina are 55 to 59 Years (12 | 32.4%) for men and 5 to 9 Years (8 | 14.8%) for women.
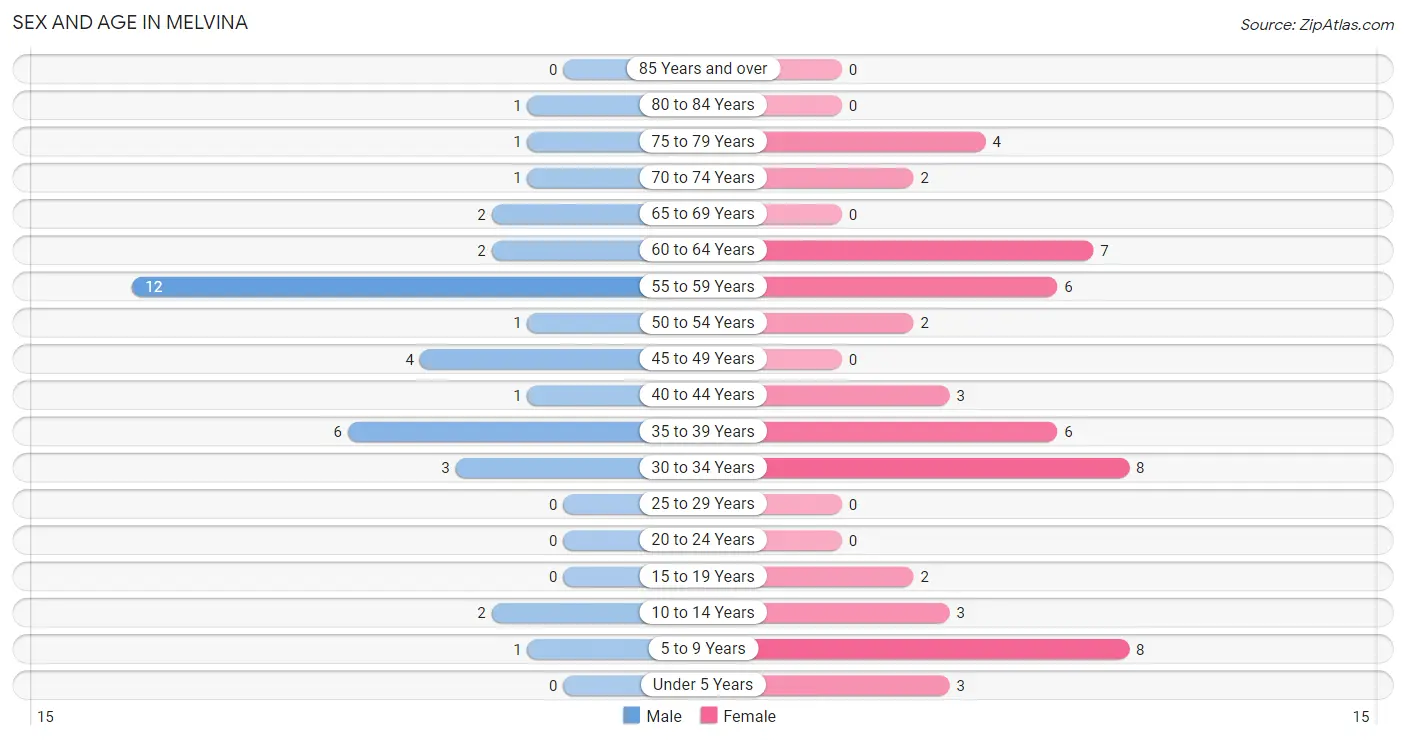
| Age Bracket | Male | Female |
| Under 5 Years | 0 (0.0%) | 3 (5.6%) |
| 5 to 9 Years | 1 (2.7%) | 8 (14.8%) |
| 10 to 14 Years | 2 (5.4%) | 3 (5.6%) |
| 15 to 19 Years | 0 (0.0%) | 2 (3.7%) |
| 20 to 24 Years | 0 (0.0%) | 0 (0.0%) |
| 25 to 29 Years | 0 (0.0%) | 0 (0.0%) |
| 30 to 34 Years | 3 (8.1%) | 8 (14.8%) |
| 35 to 39 Years | 6 (16.2%) | 6 (11.1%) |
| 40 to 44 Years | 1 (2.7%) | 3 (5.6%) |
| 45 to 49 Years | 4 (10.8%) | 0 (0.0%) |
| 50 to 54 Years | 1 (2.7%) | 2 (3.7%) |
| 55 to 59 Years | 12 (32.4%) | 6 (11.1%) |
| 60 to 64 Years | 2 (5.4%) | 7 (13.0%) |
| 65 to 69 Years | 2 (5.4%) | 0 (0.0%) |
| 70 to 74 Years | 1 (2.7%) | 2 (3.7%) |
| 75 to 79 Years | 1 (2.7%) | 4 (7.4%) |
| 80 to 84 Years | 1 (2.7%) | 0 (0.0%) |
| 85 Years and over | 0 (0.0%) | 0 (0.0%) |
| Total | 37 (100.0%) | 54 (100.0%) |
Families and Households in Melvina
Median Family Size in Melvina
The median family size in Melvina is 2.67 persons per family, with married-couple families (21 | 70.0%) accounting for the largest median family size of 2.95 persons per family. On the other hand, single male/father families (4 | 13.3%) represent the smallest median family size with 1.75 persons per family.
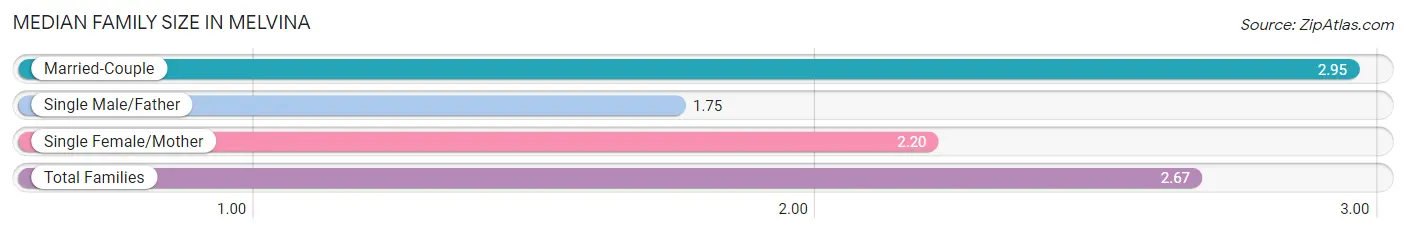
| Family Type | # Families | Family Size |
| Married-Couple | 21 (70.0%) | 2.95 |
| Single Male/Father | 4 (13.3%) | 1.75 |
| Single Female/Mother | 5 (16.7%) | 2.20 |
| Total Families | 30 (100.0%) | 2.67 |
Median Household Size in Melvina
The median household size in Melvina is 2.53 persons per household, with married-couple households (21 | 58.3%) accounting for the largest median household size of 2.95 persons per household. non-family households (6 | 16.7%) represent the smallest median household size with 1.17 persons per household.
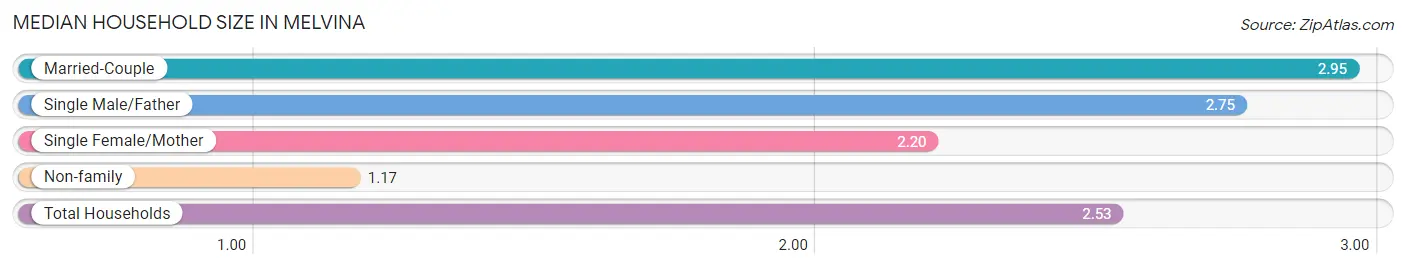
| Household Type | # Households | Household Size |
| Married-Couple | 21 (58.3%) | 2.95 |
| Single Male/Father | 4 (11.1%) | 2.75 |
| Single Female/Mother | 5 (13.9%) | 2.20 |
| Non-family | 6 (16.7%) | 1.17 |
| Total Households | 36 (100.0%) | 2.53 |
Household Size by Marriage Status in Melvina
Out of a total of 36 households in Melvina, 30 (83.3%) are family households, while 6 (16.7%) are nonfamily households. The most numerous type of family households are 2-person households, comprising 17, and the most common type of nonfamily households are 1-person households, comprising 5.
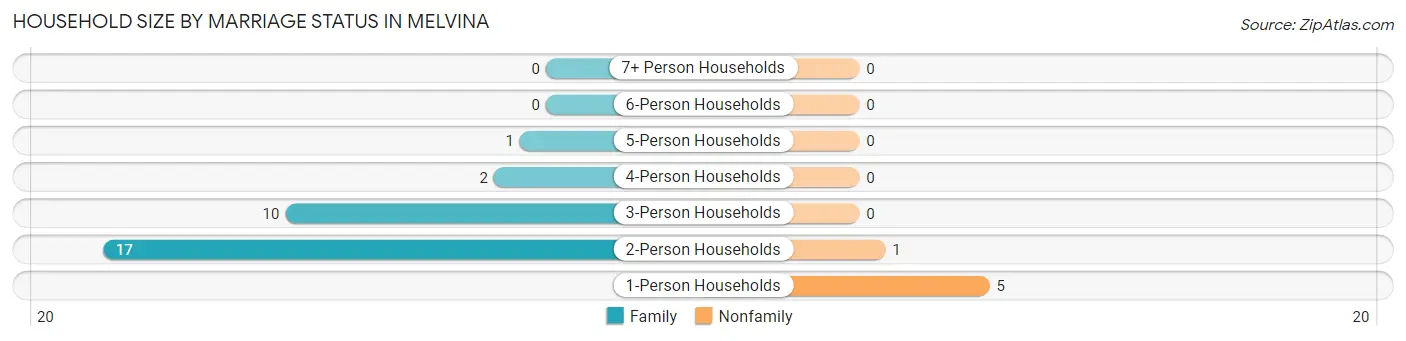
| Household Size | Family Households | Nonfamily Households |
| 1-Person Households | - | 5 (13.9%) |
| 2-Person Households | 17 (47.2%) | 1 (2.8%) |
| 3-Person Households | 10 (27.8%) | 0 (0.0%) |
| 4-Person Households | 2 (5.6%) | 0 (0.0%) |
| 5-Person Households | 1 (2.8%) | 0 (0.0%) |
| 6-Person Households | 0 (0.0%) | 0 (0.0%) |
| 7+ Person Households | 0 (0.0%) | 0 (0.0%) |
| Total | 30 (83.3%) | 6 (16.7%) |
Female Fertility in Melvina
Fertility by Age in Melvina
| Age Bracket | Women with Births | Births / 1,000 Women |
| 15 to 19 years | 0 (0.0%) | 0.0 |
| 20 to 34 years | 0 (0.0%) | 0.0 |
| 35 to 50 years | 0 (0.0%) | 0.0 |
| Total | 0 (0.0%) | 0.0 |
Fertility by Age by Marriage Status in Melvina
| Age Bracket | Married | Unmarried |
| 15 to 19 years | 0 (0.0%) | 0 (0.0%) |
| 20 to 34 years | 0 (0.0%) | 0 (0.0%) |
| 35 to 50 years | 0 (0.0%) | 0 (0.0%) |
| Total | 0 (0.0%) | 0 (0.0%) |
Fertility by Education in Melvina
| Educational Attainment | Women with Births | Births / 1,000 Women |
| Less than High School | 0 (0.0%) | 0.0 |
| High School Diploma | 0 (0.0%) | 0.0 |
| College or Associate's Degree | 0 (0.0%) | 0.0 |
| Bachelor's Degree | 0 (0.0%) | 0.0 |
| Graduate Degree | 0 (0.0%) | 0.0 |
| Total | 0 (0.0%) | 0.0 |
Fertility by Education by Marriage Status in Melvina
| Educational Attainment | Married | Unmarried |
| Less than High School | 0 (0.0%) | 0 (0.0%) |
| High School Diploma | 0 (0.0%) | 0 (0.0%) |
| College or Associate's Degree | 0 (0.0%) | 0 (0.0%) |
| Bachelor's Degree | 0 (0.0%) | 0 (0.0%) |
| Graduate Degree | 0 (0.0%) | 0 (0.0%) |
| Total | 0 (0.0%) | 0 (0.0%) |
Employment Characteristics in Melvina
Employment by Class of Employer in Melvina
Among the 63 employed individuals in Melvina, private company employees (48 | 76.2%), self-employed (not incorporated) (8 | 12.7%), and federal government employees (3 | 4.8%) make up the most common classes of employment.
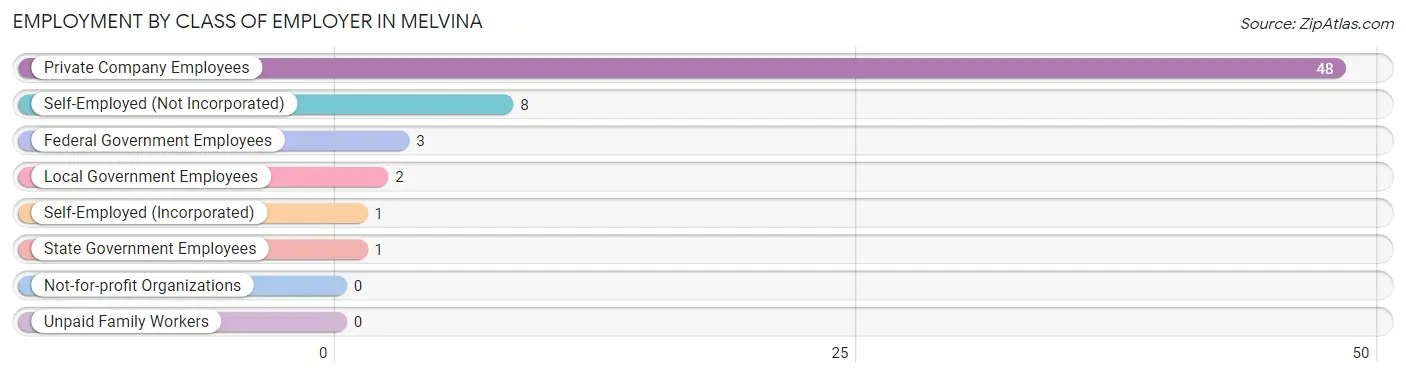
| Employer Class | # Employees | % Employees |
| Private Company Employees | 48 | 76.2% |
| Self-Employed (Incorporated) | 1 | 1.6% |
| Self-Employed (Not Incorporated) | 8 | 12.7% |
| Not-for-profit Organizations | 0 | 0.0% |
| Local Government Employees | 2 | 3.2% |
| State Government Employees | 1 | 1.6% |
| Federal Government Employees | 3 | 4.8% |
| Unpaid Family Workers | 0 | 0.0% |
| Total | 63 | 100.0% |
Employment Status by Age in Melvina
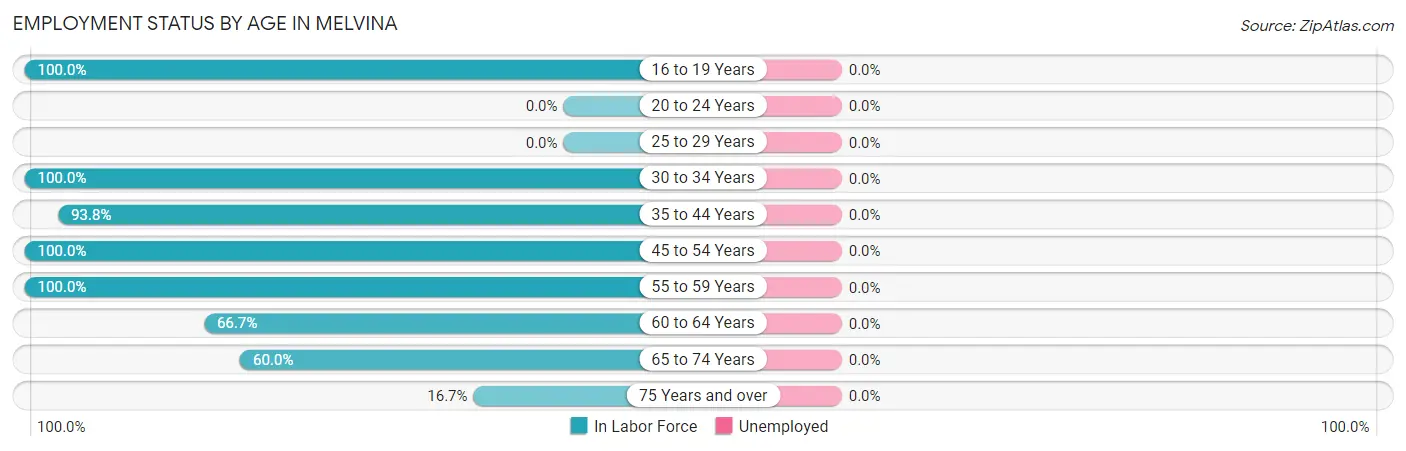
| Age Bracket | In Labor Force | Unemployed |
| 16 to 19 Years | 2 (100.0%) | 0 (0.0%) |
| 20 to 24 Years | 0 (0.0%) | 0 (0.0%) |
| 25 to 29 Years | 0 (0.0%) | 0 (0.0%) |
| 30 to 34 Years | 11 (100.0%) | 0 (0.0%) |
| 35 to 44 Years | 15 (93.8%) | 0 (0.0%) |
| 45 to 54 Years | 7 (100.0%) | 0 (0.0%) |
| 55 to 59 Years | 18 (100.0%) | 0 (0.0%) |
| 60 to 64 Years | 6 (66.7%) | 0 (0.0%) |
| 65 to 74 Years | 3 (60.0%) | 0 (0.0%) |
| 75 Years and over | 1 (16.7%) | 0 (0.0%) |
| Total | 63 (85.1%) | 0 (0.0%) |
Employment Status by Educational Attainment in Melvina
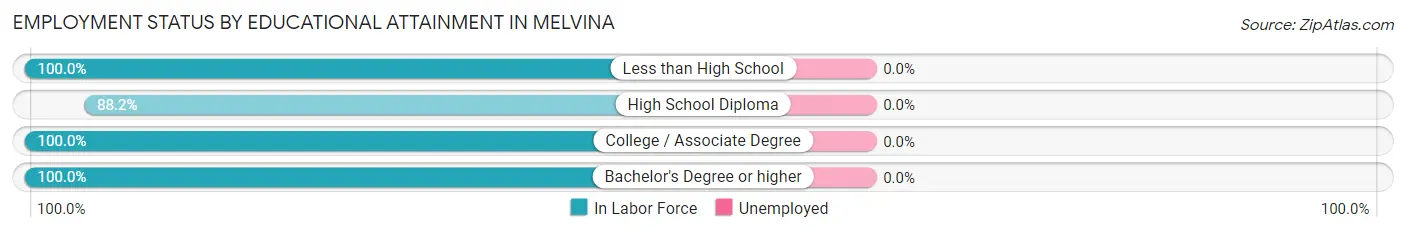
| Educational Attainment | In Labor Force | Unemployed |
| Less than High School | 8 (100.0%) | 0 (0.0%) |
| High School Diploma | 30 (88.2%) | 0 (0.0%) |
| College / Associate Degree | 14 (100.0%) | 0 (0.0%) |
| Bachelor's Degree or higher | 5 (100.0%) | 0 (0.0%) |
| Total | 57 (93.4%) | 0 (0.0%) |
Employment Occupations by Sex in Melvina
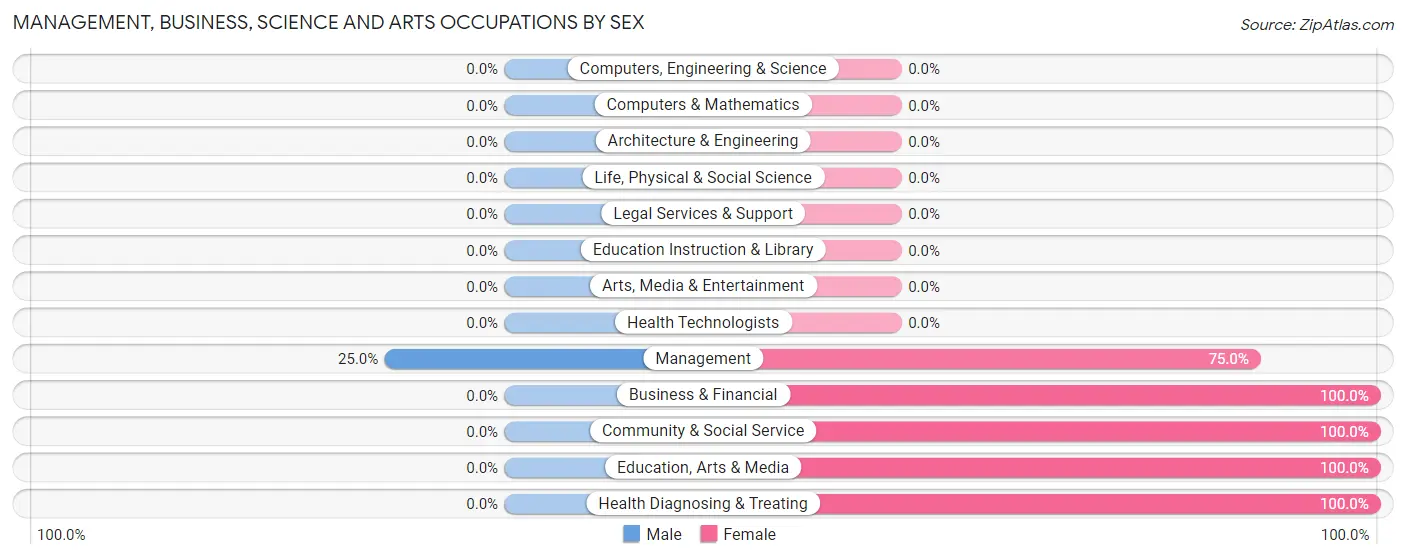
Management, Business, Science and Arts Occupations
The most common Management, Business, Science and Arts occupations in Melvina are Management (4 | 6.7%), Health Diagnosing & Treating (3 | 5.0%), Community & Social Service (2 | 3.3%), Education, Arts & Media (2 | 3.3%), and Business & Financial (1 | 1.7%).
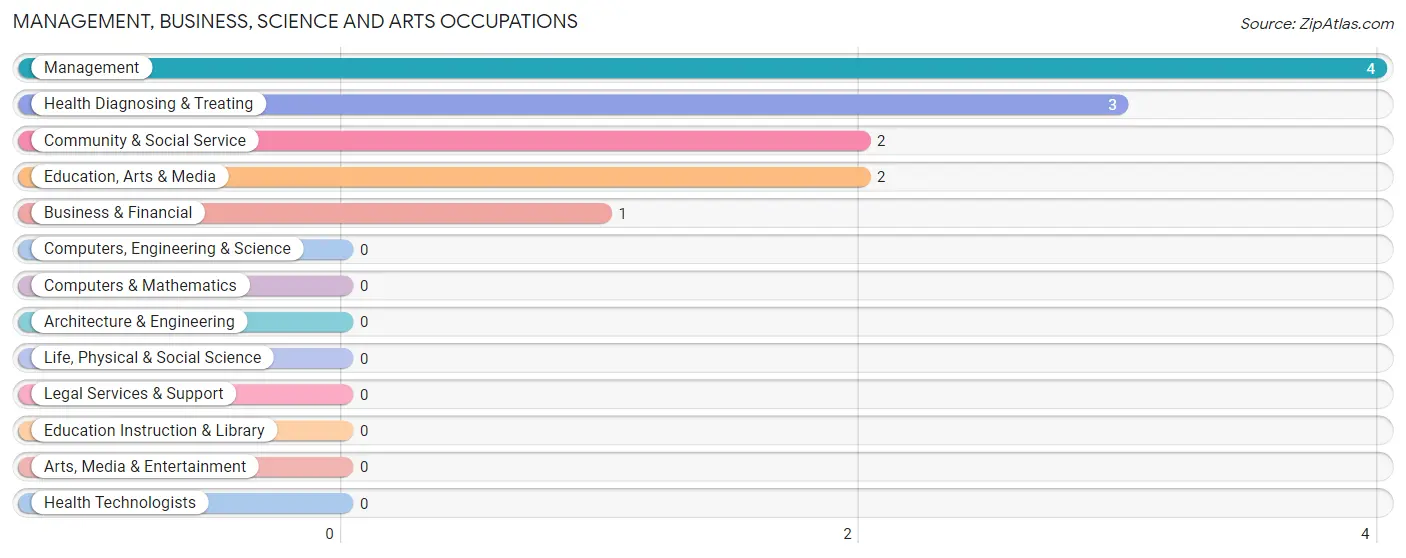
Management, Business, Science and Arts Occupations by Sex
| Occupation | Male | Female |
| Management | 1 (25.0%) | 3 (75.0%) |
| Business & Financial | 0 (0.0%) | 1 (100.0%) |
| Computers, Engineering & Science | 0 (0.0%) | 0 (0.0%) |
| Computers & Mathematics | 0 (0.0%) | 0 (0.0%) |
| Architecture & Engineering | 0 (0.0%) | 0 (0.0%) |
| Life, Physical & Social Science | 0 (0.0%) | 0 (0.0%) |
| Community & Social Service | 0 (0.0%) | 2 (100.0%) |
| Education, Arts & Media | 0 (0.0%) | 2 (100.0%) |
| Legal Services & Support | 0 (0.0%) | 0 (0.0%) |
| Education Instruction & Library | 0 (0.0%) | 0 (0.0%) |
| Arts, Media & Entertainment | 0 (0.0%) | 0 (0.0%) |
| Health Diagnosing & Treating | 0 (0.0%) | 3 (100.0%) |
| Health Technologists | 0 (0.0%) | 0 (0.0%) |
| Total (Category) | 1 (10.0%) | 9 (90.0%) |
| Total (Overall) | 27 (45.0%) | 33 (55.0%) |
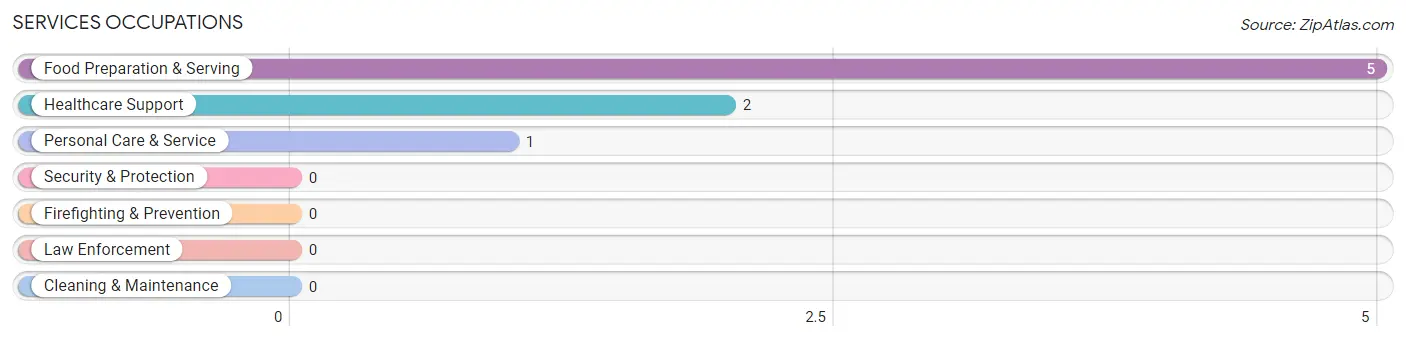
Services Occupations
The most common Services occupations in Melvina are Food Preparation & Serving (5 | 8.3%), Healthcare Support (2 | 3.3%), and Personal Care & Service (1 | 1.7%).
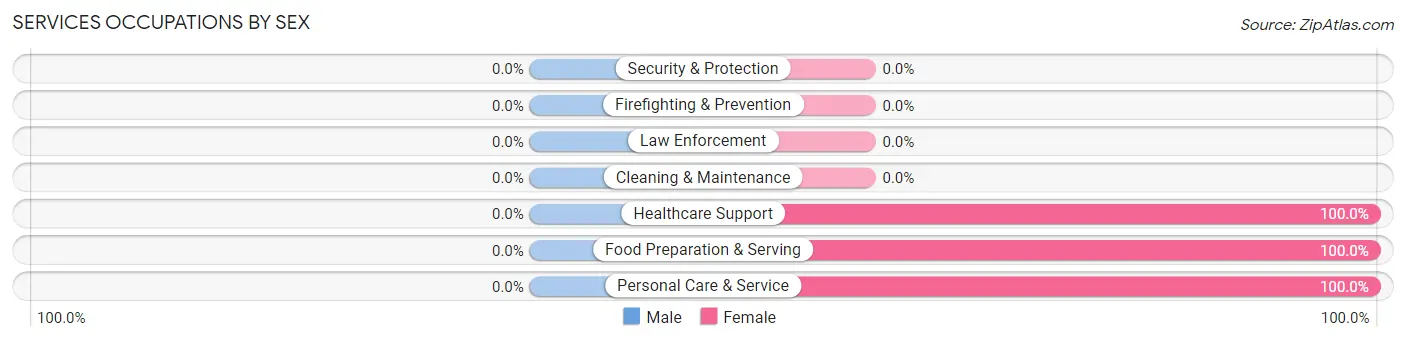
Services Occupations by Sex
| Occupation | Male | Female |
| Healthcare Support | 0 (0.0%) | 2 (100.0%) |
| Security & Protection | 0 (0.0%) | 0 (0.0%) |
| Firefighting & Prevention | 0 (0.0%) | 0 (0.0%) |
| Law Enforcement | 0 (0.0%) | 0 (0.0%) |
| Food Preparation & Serving | 0 (0.0%) | 5 (100.0%) |
| Cleaning & Maintenance | 0 (0.0%) | 0 (0.0%) |
| Personal Care & Service | 0 (0.0%) | 1 (100.0%) |
| Total (Category) | 0 (0.0%) | 8 (100.0%) |
| Total (Overall) | 27 (45.0%) | 33 (55.0%) |
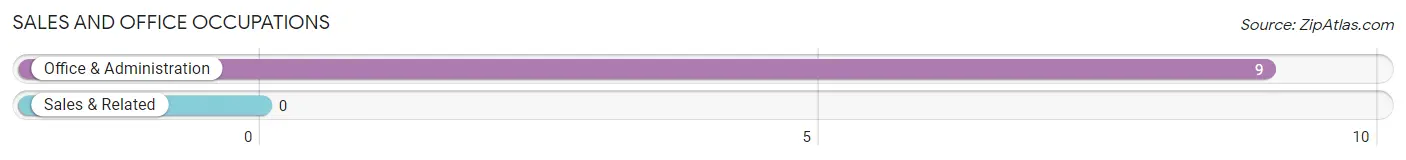
Sales and Office Occupations
The most common Sales and Office occupations in Melvina are , and Office & Administration (9 | 15.0%).
Sales and Office Occupations by Sex

| Occupation | Male | Female |
| Sales & Related | 0 (0.0%) | 0 (0.0%) |
| Office & Administration | 0 (0.0%) | 9 (100.0%) |
| Total (Category) | 0 (0.0%) | 9 (100.0%) |
| Total (Overall) | 27 (45.0%) | 33 (55.0%) |
Natural Resources, Construction and Maintenance Occupations
The most common Natural Resources, Construction and Maintenance occupations in Melvina are Construction & Extraction (9 | 15.0%), and Installation, Maintenance & Repair (9 | 15.0%).
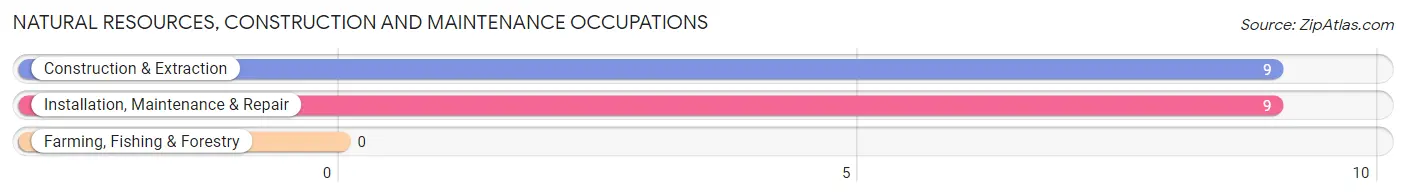
Natural Resources, Construction and Maintenance Occupations by Sex

| Occupation | Male | Female |
| Farming, Fishing & Forestry | 0 (0.0%) | 0 (0.0%) |
| Construction & Extraction | 9 (100.0%) | 0 (0.0%) |
| Installation, Maintenance & Repair | 9 (100.0%) | 0 (0.0%) |
| Total (Category) | 18 (100.0%) | 0 (0.0%) |
| Total (Overall) | 27 (45.0%) | 33 (55.0%) |
Production, Transportation and Moving Occupations
The most common Production, Transportation and Moving occupations in Melvina are Material Moving (8 | 13.3%), and Production (7 | 11.7%).
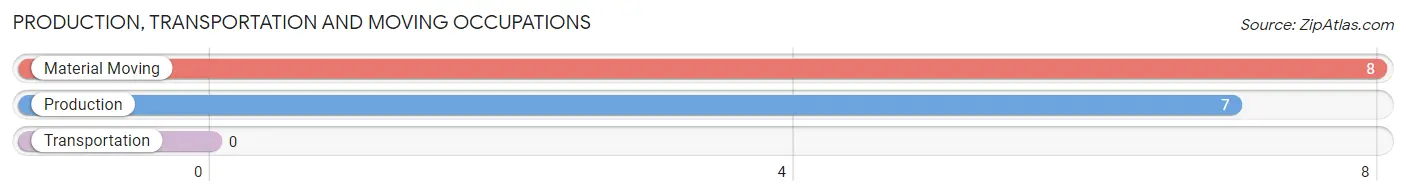
Production, Transportation and Moving Occupations by Sex
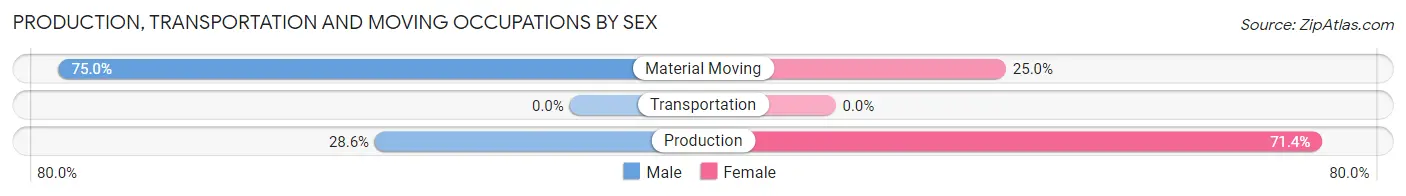
| Occupation | Male | Female |
| Production | 2 (28.6%) | 5 (71.4%) |
| Transportation | 0 (0.0%) | 0 (0.0%) |
| Material Moving | 6 (75.0%) | 2 (25.0%) |
| Total (Category) | 8 (53.3%) | 7 (46.7%) |
| Total (Overall) | 27 (45.0%) | 33 (55.0%) |
Employment Industries by Sex in Melvina
Employment Industries in Melvina
The major employment industries in Melvina include Manufacturing (10 | 16.7%), Construction (9 | 15.0%), Health Care & Social Assistance (9 | 15.0%), Wholesale Trade (8 | 13.3%), and Finance & Insurance (6 | 10.0%).
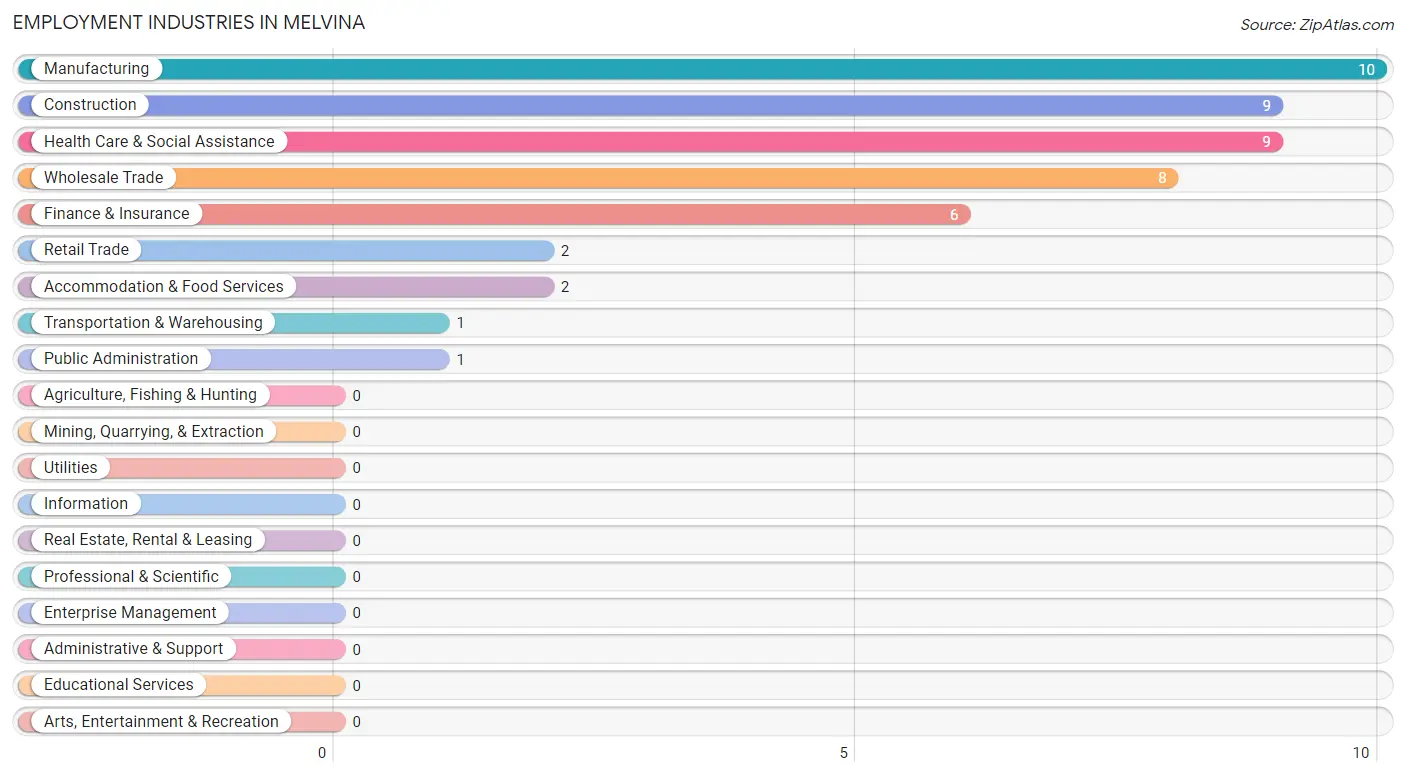
Employment Industries by Sex in Melvina
The Melvina industries that see more men than women are Construction (100.0%), Transportation & Warehousing (100.0%), and Wholesale Trade (50.0%), whereas the industries that tend to have a higher number of women are Accommodation & Food Services (100.0%), Public Administration (100.0%), and Finance & Insurance (83.3%).
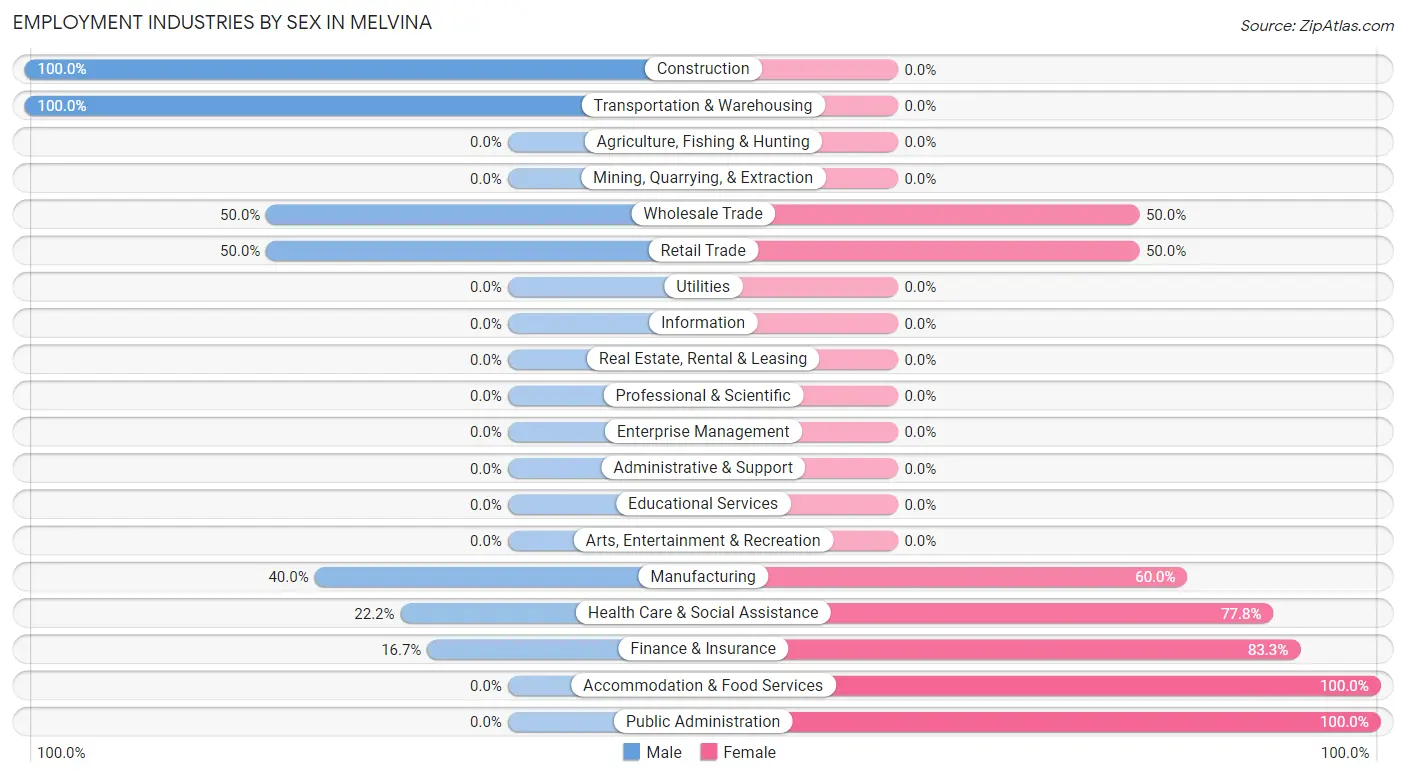
| Industry | Male | Female |
| Agriculture, Fishing & Hunting | 0 (0.0%) | 0 (0.0%) |
| Mining, Quarrying, & Extraction | 0 (0.0%) | 0 (0.0%) |
| Construction | 9 (100.0%) | 0 (0.0%) |
| Manufacturing | 4 (40.0%) | 6 (60.0%) |
| Wholesale Trade | 4 (50.0%) | 4 (50.0%) |
| Retail Trade | 1 (50.0%) | 1 (50.0%) |
| Transportation & Warehousing | 1 (100.0%) | 0 (0.0%) |
| Utilities | 0 (0.0%) | 0 (0.0%) |
| Information | 0 (0.0%) | 0 (0.0%) |
| Finance & Insurance | 1 (16.7%) | 5 (83.3%) |
| Real Estate, Rental & Leasing | 0 (0.0%) | 0 (0.0%) |
| Professional & Scientific | 0 (0.0%) | 0 (0.0%) |
| Enterprise Management | 0 (0.0%) | 0 (0.0%) |
| Administrative & Support | 0 (0.0%) | 0 (0.0%) |
| Educational Services | 0 (0.0%) | 0 (0.0%) |
| Health Care & Social Assistance | 2 (22.2%) | 7 (77.8%) |
| Arts, Entertainment & Recreation | 0 (0.0%) | 0 (0.0%) |
| Accommodation & Food Services | 0 (0.0%) | 2 (100.0%) |
| Public Administration | 0 (0.0%) | 1 (100.0%) |
| Total | 27 (45.0%) | 33 (55.0%) |
Education in Melvina
School Enrollment in Melvina
The most common levels of schooling among the 14 students in Melvina are high school (5 | 35.7%), middle school (4 | 28.6%), and graduate / professional (3 | 21.4%).
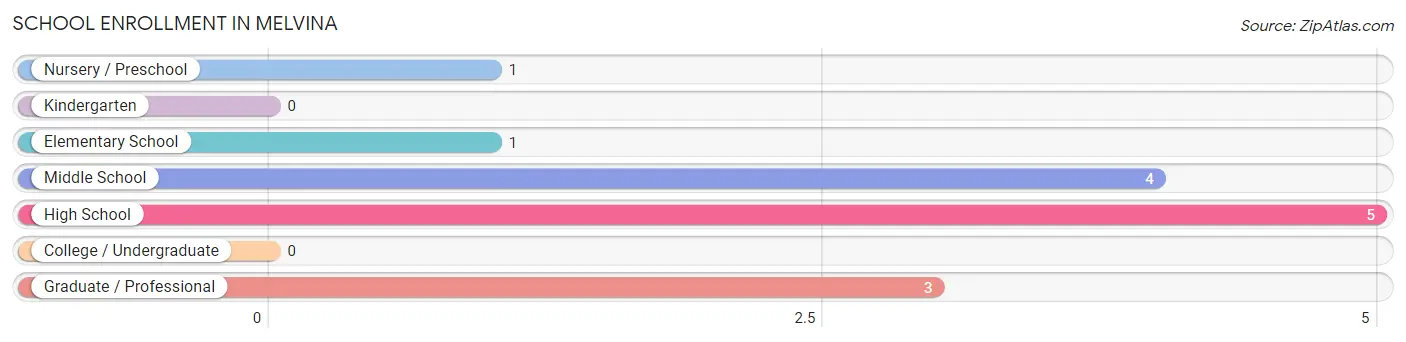
| School Level | # Students | % Students |
| Nursery / Preschool | 1 | 7.1% |
| Kindergarten | 0 | 0.0% |
| Elementary School | 1 | 7.1% |
| Middle School | 4 | 28.6% |
| High School | 5 | 35.7% |
| College / Undergraduate | 0 | 0.0% |
| Graduate / Professional | 3 | 21.4% |
| Total | 14 | 100.0% |
School Enrollment by Age by Funding Source in Melvina
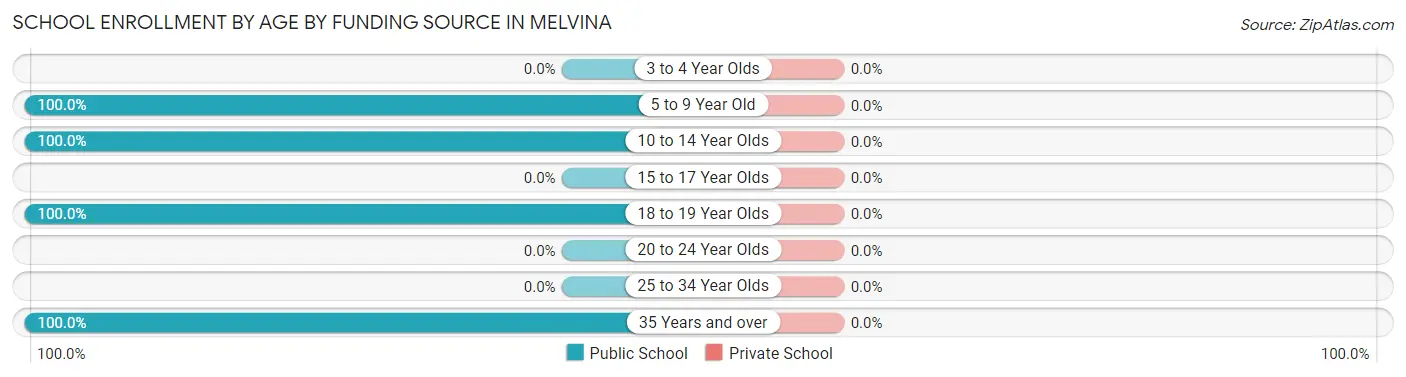
| Age Bracket | Public School | Private School |
| 3 to 4 Year Olds | 0 (0.0%) | 0 (0.0%) |
| 5 to 9 Year Old | 1 (100.0%) | 0 (0.0%) |
| 10 to 14 Year Olds | 5 (100.0%) | 0 (0.0%) |
| 15 to 17 Year Olds | 0 (0.0%) | 0 (0.0%) |
| 18 to 19 Year Olds | 2 (100.0%) | 0 (0.0%) |
| 20 to 24 Year Olds | 0 (0.0%) | 0 (0.0%) |
| 25 to 34 Year Olds | 0 (0.0%) | 0 (0.0%) |
| 35 Years and over | 6 (100.0%) | 0 (0.0%) |
| Total | 14 (100.0%) | 0 (0.0%) |
Educational Attainment by Field of Study in Melvina
Psychology (3 | 42.9%), arts & humanities (2 | 28.6%), business (1 | 14.3%), and education (1 | 14.3%) are the most common fields of study among 7 individuals in Melvina who have obtained a bachelor's degree or higher.
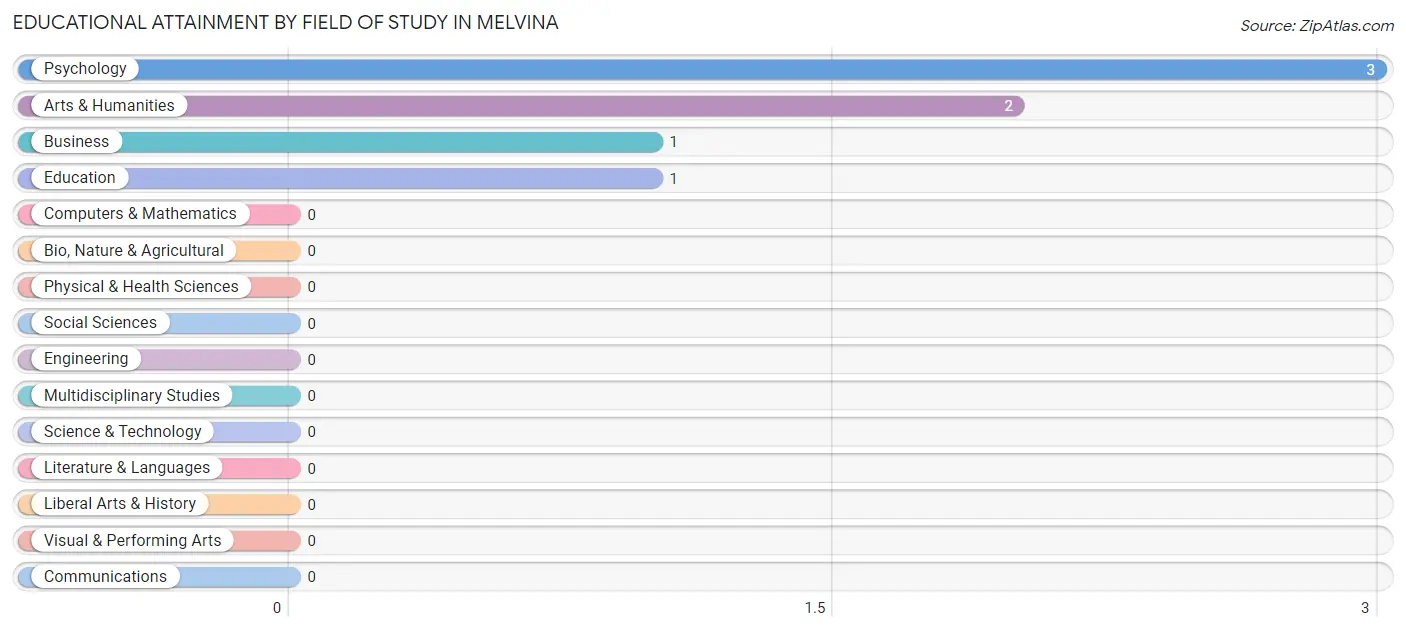
| Field of Study | # Graduates | % Graduates |
| Computers & Mathematics | 0 | 0.0% |
| Bio, Nature & Agricultural | 0 | 0.0% |
| Physical & Health Sciences | 0 | 0.0% |
| Psychology | 3 | 42.9% |
| Social Sciences | 0 | 0.0% |
| Engineering | 0 | 0.0% |
| Multidisciplinary Studies | 0 | 0.0% |
| Science & Technology | 0 | 0.0% |
| Business | 1 | 14.3% |
| Education | 1 | 14.3% |
| Literature & Languages | 0 | 0.0% |
| Liberal Arts & History | 0 | 0.0% |
| Visual & Performing Arts | 0 | 0.0% |
| Communications | 0 | 0.0% |
| Arts & Humanities | 2 | 28.6% |
| Total | 7 | 100.0% |
Transportation & Commute in Melvina
Vehicle Availability by Sex in Melvina
The most prevalent vehicle ownership categories in Melvina are males with 2 vehicles (18, accounting for 60.0%) and females with 2 vehicles (21, making up 54.5%).
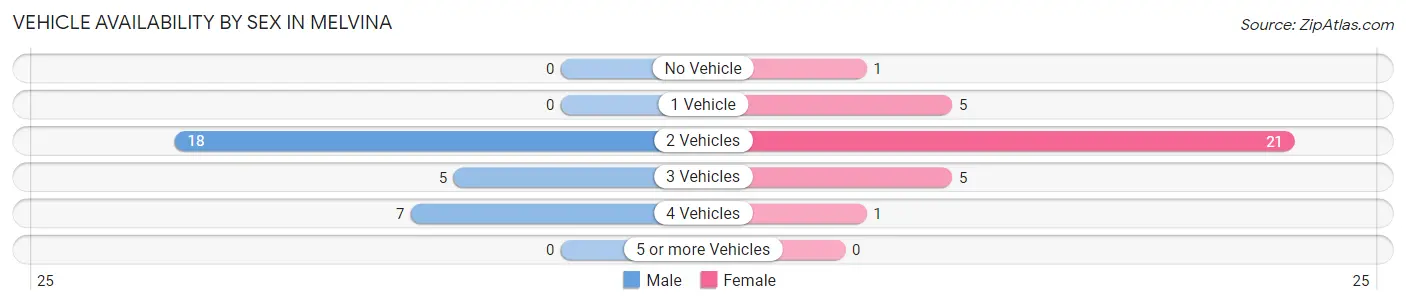
| Vehicles Available | Male | Female |
| No Vehicle | 0 (0.0%) | 1 (3.0%) |
| 1 Vehicle | 0 (0.0%) | 5 (15.1%) |
| 2 Vehicles | 18 (60.0%) | 21 (63.6%) |
| 3 Vehicles | 5 (16.7%) | 5 (15.1%) |
| 4 Vehicles | 7 (23.3%) | 1 (3.0%) |
| 5 or more Vehicles | 0 (0.0%) | 0 (0.0%) |
| Total | 30 (100.0%) | 33 (100.0%) |
Commute Time in Melvina
The most frequently occuring commute durations in Melvina are 20 to 24 minutes (15 commuters, 24.2%), 25 to 29 minutes (12 commuters, 19.4%), and 5 to 9 minutes (10 commuters, 16.1%).
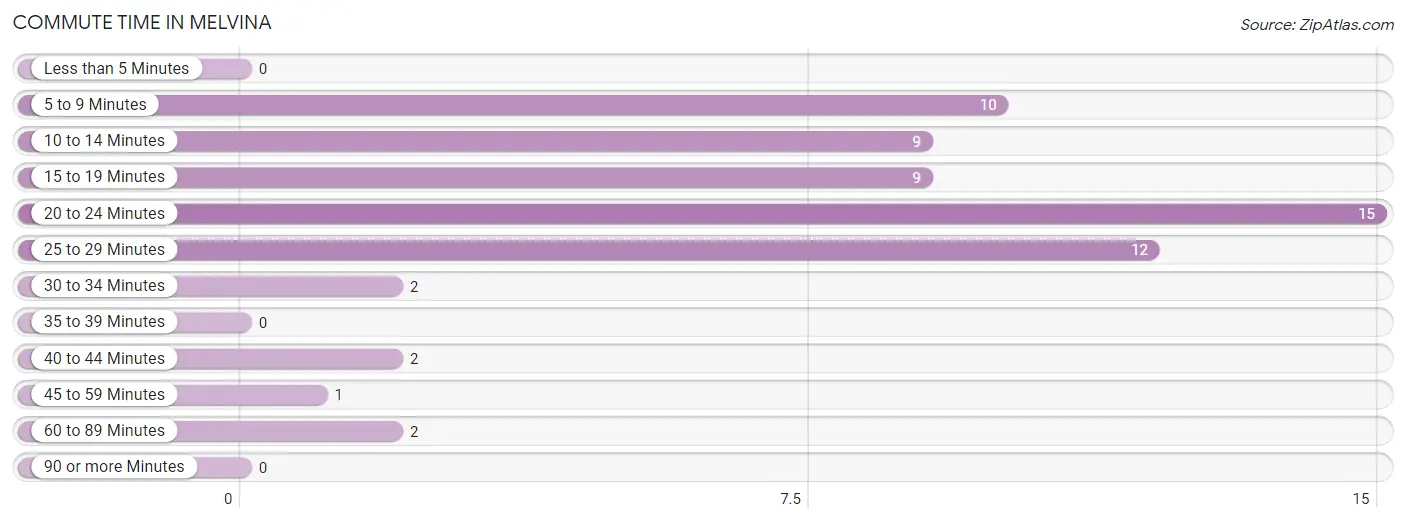
| Commute Time | # Commuters | % Commuters |
| Less than 5 Minutes | 0 | 0.0% |
| 5 to 9 Minutes | 10 | 16.1% |
| 10 to 14 Minutes | 9 | 14.5% |
| 15 to 19 Minutes | 9 | 14.5% |
| 20 to 24 Minutes | 15 | 24.2% |
| 25 to 29 Minutes | 12 | 19.4% |
| 30 to 34 Minutes | 2 | 3.2% |
| 35 to 39 Minutes | 0 | 0.0% |
| 40 to 44 Minutes | 2 | 3.2% |
| 45 to 59 Minutes | 1 | 1.6% |
| 60 to 89 Minutes | 2 | 3.2% |
| 90 or more Minutes | 0 | 0.0% |
Commute Time by Sex in Melvina
The most common commute times in Melvina are 5 to 9 minutes (10 commuters, 33.3%) for males and 15 to 19 minutes (8 commuters, 25.0%) for females.
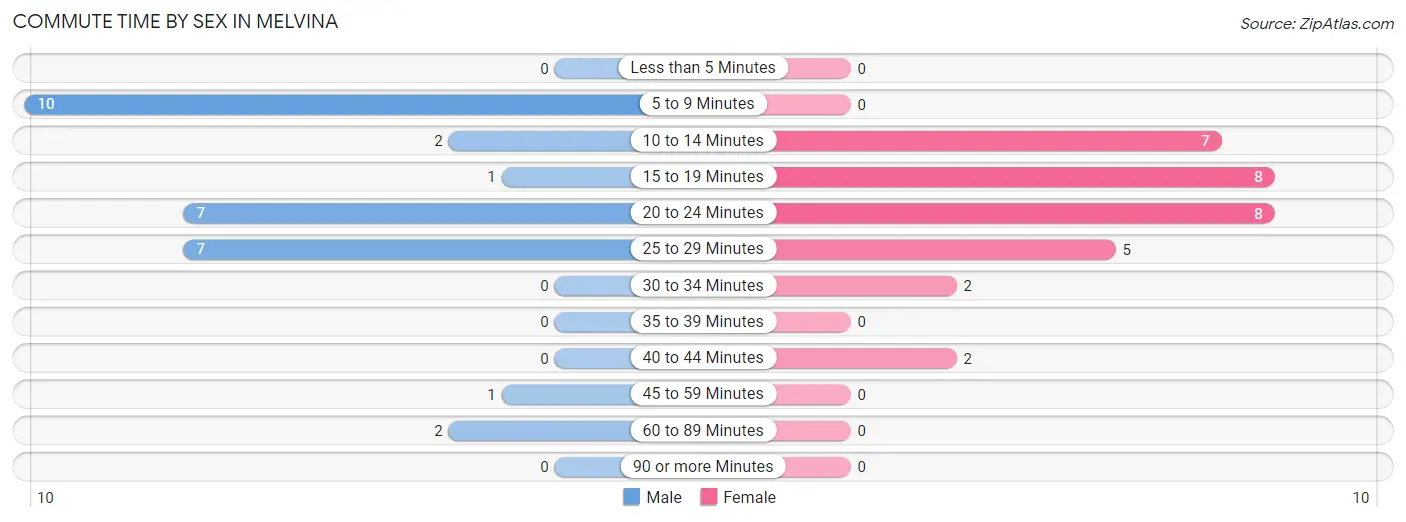
| Commute Time | Male | Female |
| Less than 5 Minutes | 0 (0.0%) | 0 (0.0%) |
| 5 to 9 Minutes | 10 (33.3%) | 0 (0.0%) |
| 10 to 14 Minutes | 2 (6.7%) | 7 (21.9%) |
| 15 to 19 Minutes | 1 (3.3%) | 8 (25.0%) |
| 20 to 24 Minutes | 7 (23.3%) | 8 (25.0%) |
| 25 to 29 Minutes | 7 (23.3%) | 5 (15.6%) |
| 30 to 34 Minutes | 0 (0.0%) | 2 (6.2%) |
| 35 to 39 Minutes | 0 (0.0%) | 0 (0.0%) |
| 40 to 44 Minutes | 0 (0.0%) | 2 (6.2%) |
| 45 to 59 Minutes | 1 (3.3%) | 0 (0.0%) |
| 60 to 89 Minutes | 2 (6.7%) | 0 (0.0%) |
| 90 or more Minutes | 0 (0.0%) | 0 (0.0%) |
Time of Departure to Work by Sex in Melvina
The most frequent times of departure to work in Melvina are 12:00 PM to 3:59 PM (9, 30.0%) for males and 8:00 AM to 8:29 AM (8, 25.0%) for females.
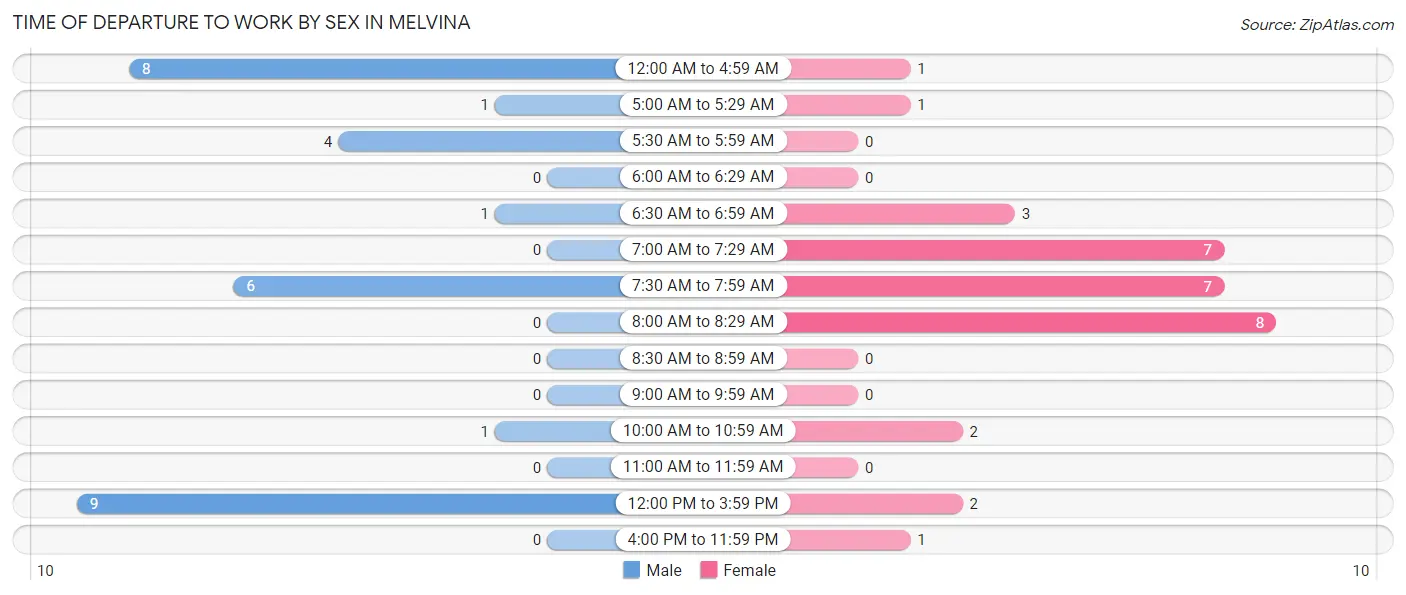
| Time of Departure | Male | Female |
| 12:00 AM to 4:59 AM | 8 (26.7%) | 1 (3.1%) |
| 5:00 AM to 5:29 AM | 1 (3.3%) | 1 (3.1%) |
| 5:30 AM to 5:59 AM | 4 (13.3%) | 0 (0.0%) |
| 6:00 AM to 6:29 AM | 0 (0.0%) | 0 (0.0%) |
| 6:30 AM to 6:59 AM | 1 (3.3%) | 3 (9.4%) |
| 7:00 AM to 7:29 AM | 0 (0.0%) | 7 (21.9%) |
| 7:30 AM to 7:59 AM | 6 (20.0%) | 7 (21.9%) |
| 8:00 AM to 8:29 AM | 0 (0.0%) | 8 (25.0%) |
| 8:30 AM to 8:59 AM | 0 (0.0%) | 0 (0.0%) |
| 9:00 AM to 9:59 AM | 0 (0.0%) | 0 (0.0%) |
| 10:00 AM to 10:59 AM | 1 (3.3%) | 2 (6.2%) |
| 11:00 AM to 11:59 AM | 0 (0.0%) | 0 (0.0%) |
| 12:00 PM to 3:59 PM | 9 (30.0%) | 2 (6.2%) |
| 4:00 PM to 11:59 PM | 0 (0.0%) | 1 (3.1%) |
| Total | 30 (100.0%) | 32 (100.0%) |
Housing Occupancy in Melvina
Occupancy by Ownership in Melvina
Of the total 36 dwellings in Melvina, owner-occupied units account for 31 (86.1%), while renter-occupied units make up 5 (13.9%).
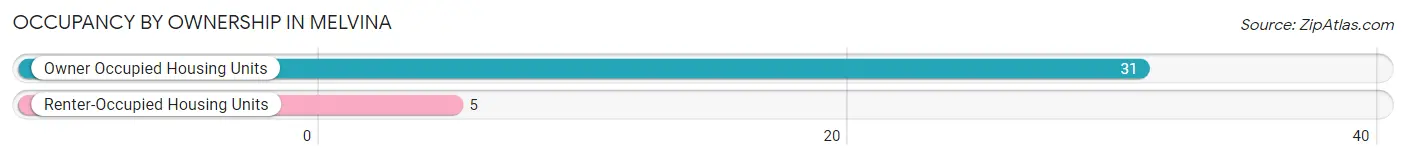
| Occupancy | # Housing Units | % Housing Units |
| Owner Occupied Housing Units | 31 | 86.1% |
| Renter-Occupied Housing Units | 5 | 13.9% |
| Total Occupied Housing Units | 36 | 100.0% |
Occupancy by Household Size in Melvina
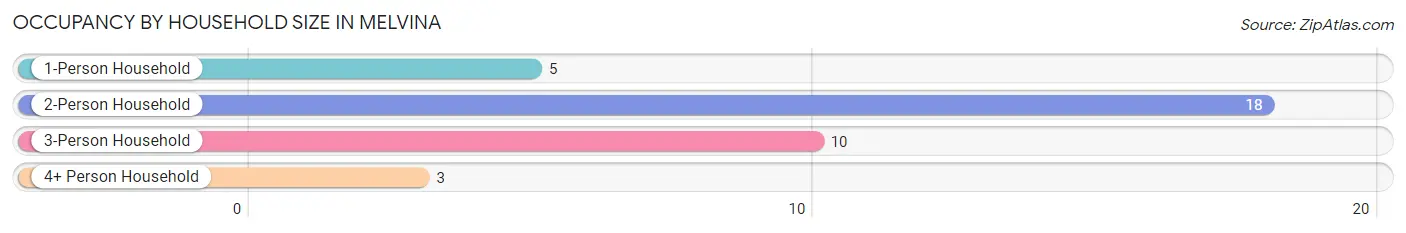
| Household Size | # Housing Units | % Housing Units |
| 1-Person Household | 5 | 13.9% |
| 2-Person Household | 18 | 50.0% |
| 3-Person Household | 10 | 27.8% |
| 4+ Person Household | 3 | 8.3% |
| Total Housing Units | 36 | 100.0% |
Occupancy by Ownership by Household Size in Melvina
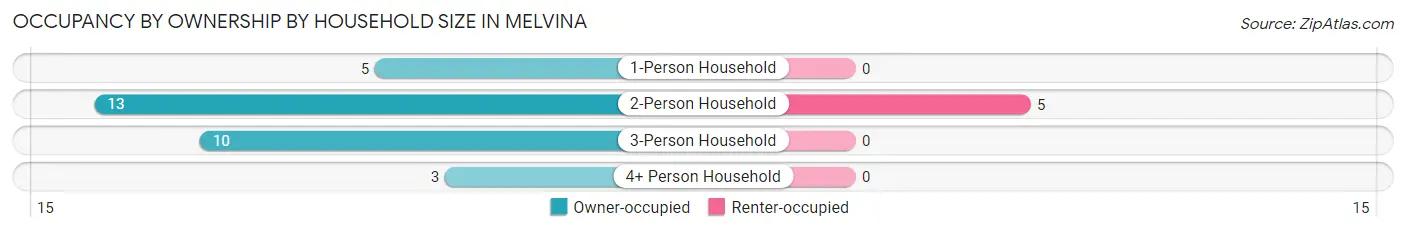
| Household Size | Owner-occupied | Renter-occupied |
| 1-Person Household | 5 (100.0%) | 0 (0.0%) |
| 2-Person Household | 13 (72.2%) | 5 (27.8%) |
| 3-Person Household | 10 (100.0%) | 0 (0.0%) |
| 4+ Person Household | 3 (100.0%) | 0 (0.0%) |
| Total Housing Units | 31 (86.1%) | 5 (13.9%) |
Occupancy by Educational Attainment in Melvina
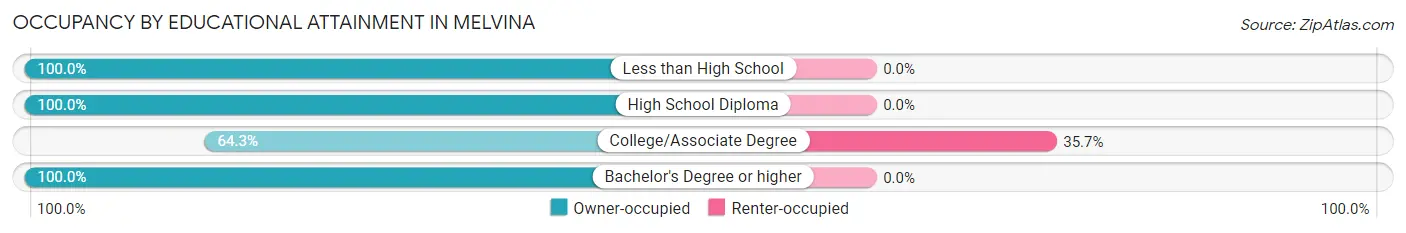
| Household Size | Owner-occupied | Renter-occupied |
| Less than High School | 2 (100.0%) | 0 (0.0%) |
| High School Diploma | 18 (100.0%) | 0 (0.0%) |
| College/Associate Degree | 9 (64.3%) | 5 (35.7%) |
| Bachelor's Degree or higher | 2 (100.0%) | 0 (0.0%) |
Occupancy by Age of Householder in Melvina
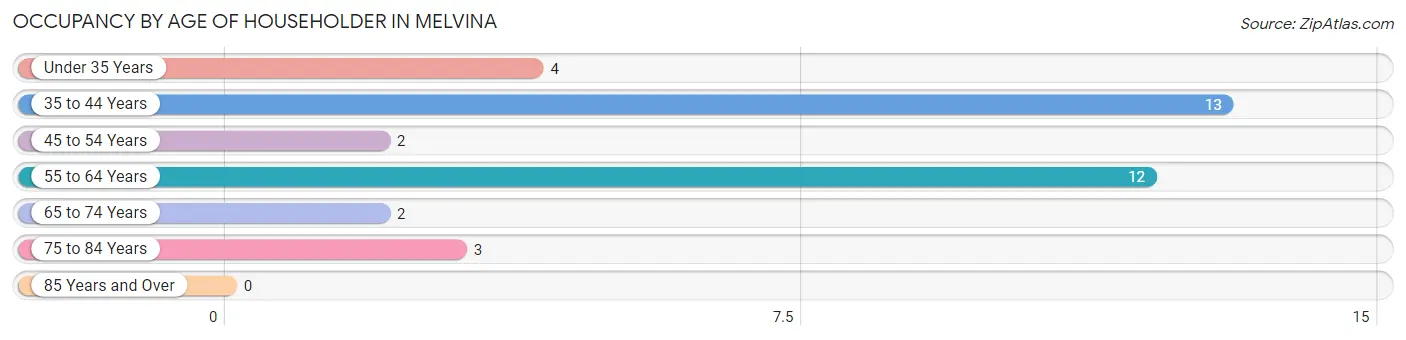
| Age Bracket | # Households | % Households |
| Under 35 Years | 4 | 11.1% |
| 35 to 44 Years | 13 | 36.1% |
| 45 to 54 Years | 2 | 5.6% |
| 55 to 64 Years | 12 | 33.3% |
| 65 to 74 Years | 2 | 5.6% |
| 75 to 84 Years | 3 | 8.3% |
| 85 Years and Over | 0 | 0.0% |
| Total | 36 | 100.0% |
Housing Finances in Melvina
Median Income by Occupancy in Melvina
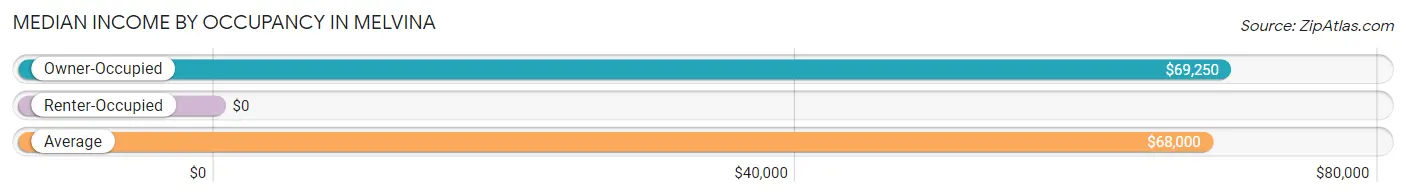
| Occupancy Type | # Households | Median Income |
| Owner-Occupied | 31 (86.1%) | $69,250 |
| Renter-Occupied | 5 (13.9%) | $0 |
| Average | 36 (100.0%) | $68,000 |
Occupancy by Householder Income Bracket in Melvina
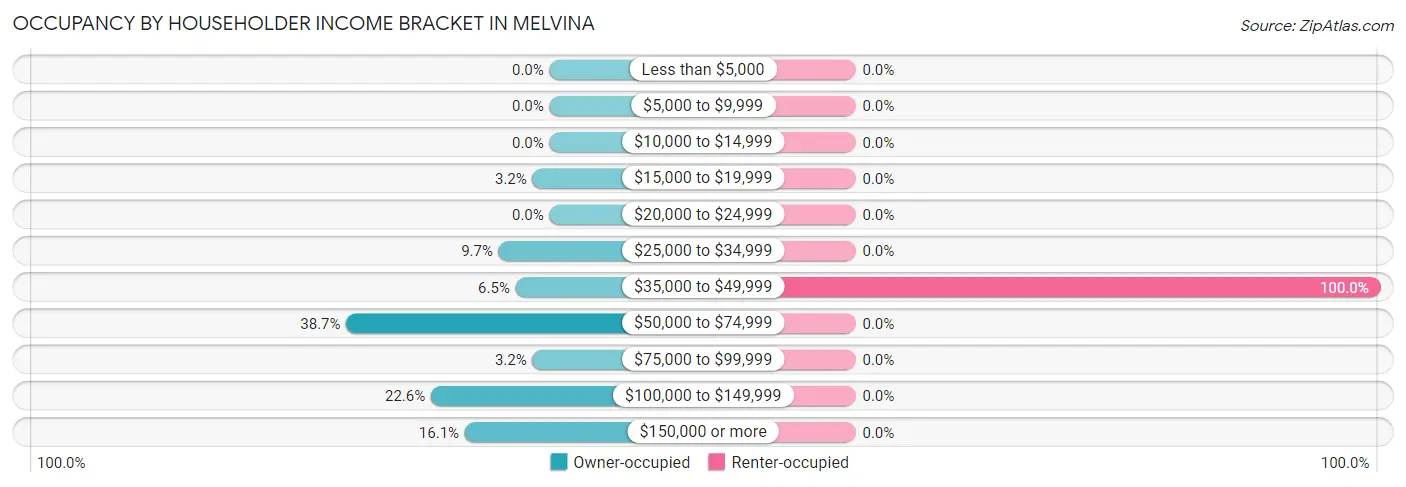
| Income Bracket | Owner-occupied | Renter-occupied |
| Less than $5,000 | 0 (0.0%) | 0 (0.0%) |
| $5,000 to $9,999 | 0 (0.0%) | 0 (0.0%) |
| $10,000 to $14,999 | 0 (0.0%) | 0 (0.0%) |
| $15,000 to $19,999 | 1 (3.2%) | 0 (0.0%) |
| $20,000 to $24,999 | 0 (0.0%) | 0 (0.0%) |
| $25,000 to $34,999 | 3 (9.7%) | 0 (0.0%) |
| $35,000 to $49,999 | 2 (6.5%) | 5 (100.0%) |
| $50,000 to $74,999 | 12 (38.7%) | 0 (0.0%) |
| $75,000 to $99,999 | 1 (3.2%) | 0 (0.0%) |
| $100,000 to $149,999 | 7 (22.6%) | 0 (0.0%) |
| $150,000 or more | 5 (16.1%) | 0 (0.0%) |
| Total | 31 (100.0%) | 5 (100.0%) |
Monthly Housing Cost Tiers in Melvina
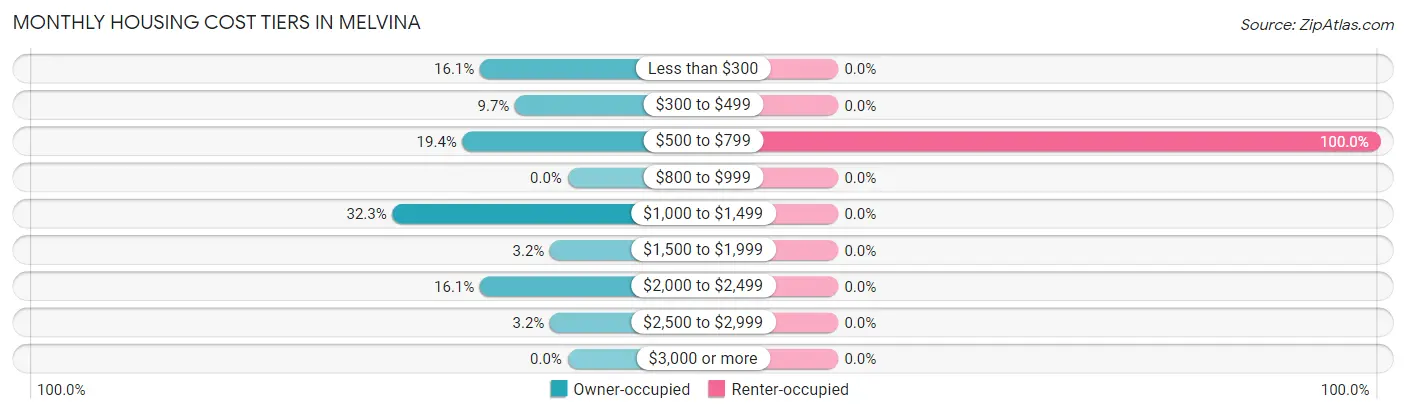
| Monthly Cost | Owner-occupied | Renter-occupied |
| Less than $300 | 5 (16.1%) | 0 (0.0%) |
| $300 to $499 | 3 (9.7%) | 0 (0.0%) |
| $500 to $799 | 6 (19.4%) | 5 (100.0%) |
| $800 to $999 | 0 (0.0%) | 0 (0.0%) |
| $1,000 to $1,499 | 10 (32.3%) | 0 (0.0%) |
| $1,500 to $1,999 | 1 (3.2%) | 0 (0.0%) |
| $2,000 to $2,499 | 5 (16.1%) | 0 (0.0%) |
| $2,500 to $2,999 | 1 (3.2%) | 0 (0.0%) |
| $3,000 or more | 0 (0.0%) | 0 (0.0%) |
| Total | 31 (100.0%) | 5 (100.0%) |
Physical Housing Characteristics in Melvina
Housing Structures in Melvina
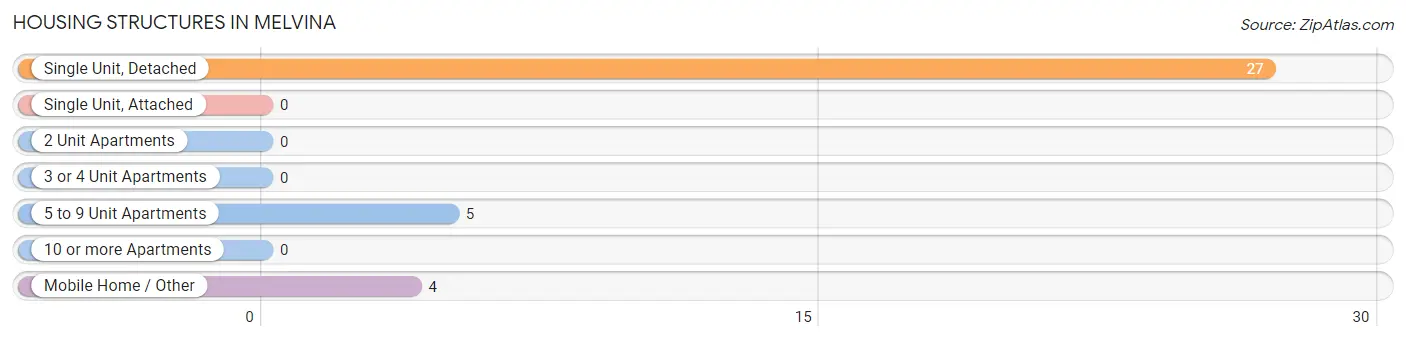
| Structure Type | # Housing Units | % Housing Units |
| Single Unit, Detached | 27 | 75.0% |
| Single Unit, Attached | 0 | 0.0% |
| 2 Unit Apartments | 0 | 0.0% |
| 3 or 4 Unit Apartments | 0 | 0.0% |
| 5 to 9 Unit Apartments | 5 | 13.9% |
| 10 or more Apartments | 0 | 0.0% |
| Mobile Home / Other | 4 | 11.1% |
| Total | 36 | 100.0% |
Housing Structures by Occupancy in Melvina
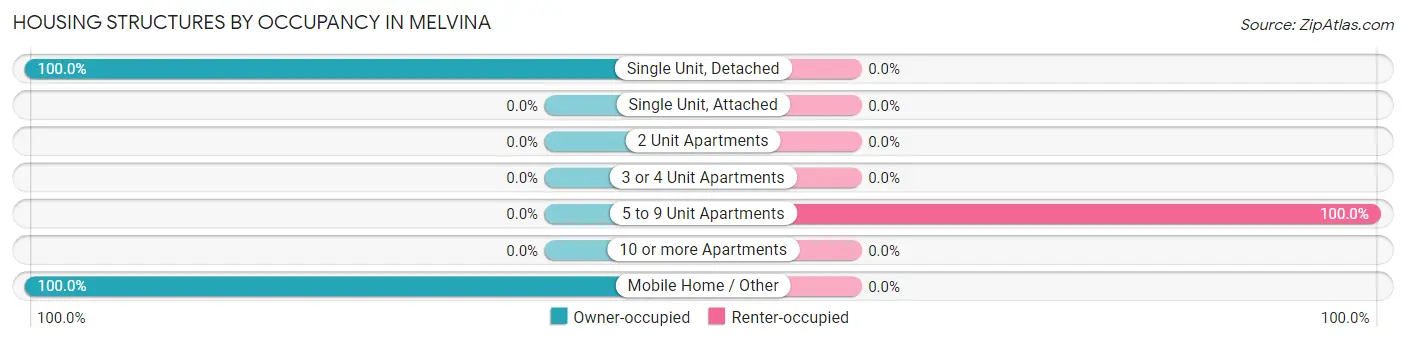
| Structure Type | Owner-occupied | Renter-occupied |
| Single Unit, Detached | 27 (100.0%) | 0 (0.0%) |
| Single Unit, Attached | 0 (0.0%) | 0 (0.0%) |
| 2 Unit Apartments | 0 (0.0%) | 0 (0.0%) |
| 3 or 4 Unit Apartments | 0 (0.0%) | 0 (0.0%) |
| 5 to 9 Unit Apartments | 0 (0.0%) | 5 (100.0%) |
| 10 or more Apartments | 0 (0.0%) | 0 (0.0%) |
| Mobile Home / Other | 4 (100.0%) | 0 (0.0%) |
| Total | 31 (86.1%) | 5 (13.9%) |
Housing Structures by Number of Rooms in Melvina
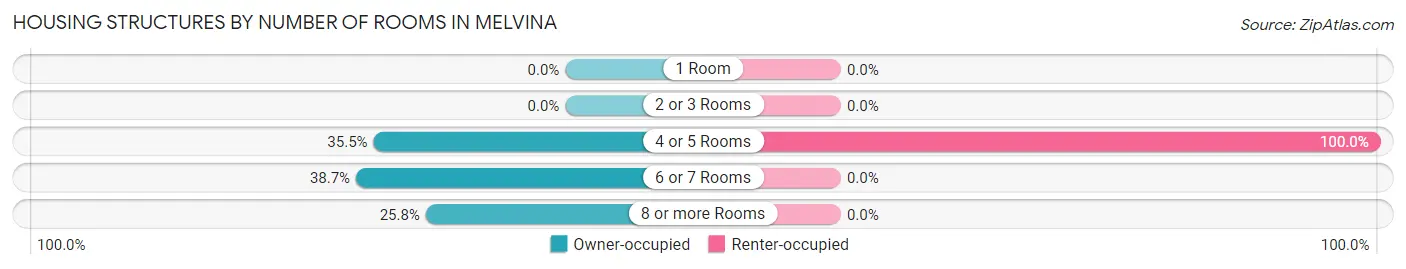
| Number of Rooms | Owner-occupied | Renter-occupied |
| 1 Room | 0 (0.0%) | 0 (0.0%) |
| 2 or 3 Rooms | 0 (0.0%) | 0 (0.0%) |
| 4 or 5 Rooms | 11 (35.5%) | 5 (100.0%) |
| 6 or 7 Rooms | 12 (38.7%) | 0 (0.0%) |
| 8 or more Rooms | 8 (25.8%) | 0 (0.0%) |
| Total | 31 (100.0%) | 5 (100.0%) |
Housing Structure by Heating Type in Melvina
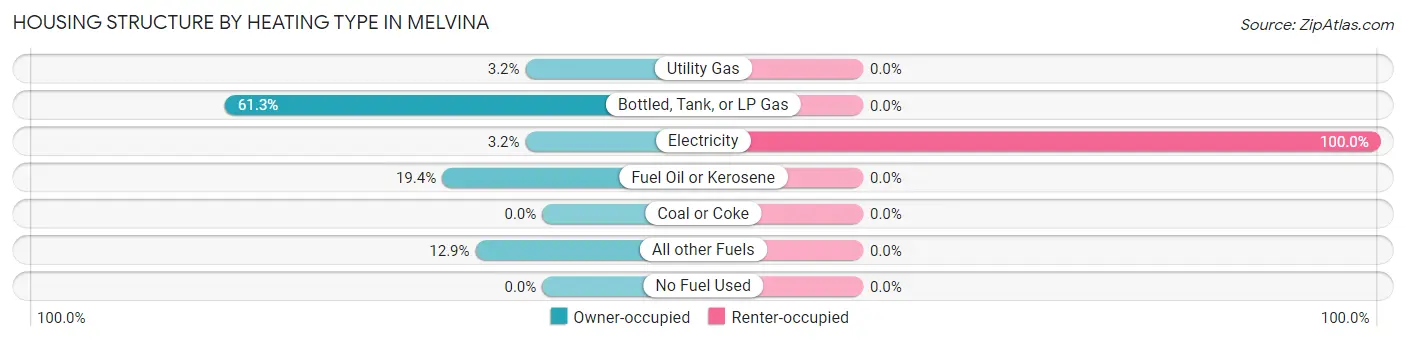
| Heating Type | Owner-occupied | Renter-occupied |
| Utility Gas | 1 (3.2%) | 0 (0.0%) |
| Bottled, Tank, or LP Gas | 19 (61.3%) | 0 (0.0%) |
| Electricity | 1 (3.2%) | 5 (100.0%) |
| Fuel Oil or Kerosene | 6 (19.4%) | 0 (0.0%) |
| Coal or Coke | 0 (0.0%) | 0 (0.0%) |
| All other Fuels | 4 (12.9%) | 0 (0.0%) |
| No Fuel Used | 0 (0.0%) | 0 (0.0%) |
| Total | 31 (100.0%) | 5 (100.0%) |
Household Vehicle Usage in Melvina
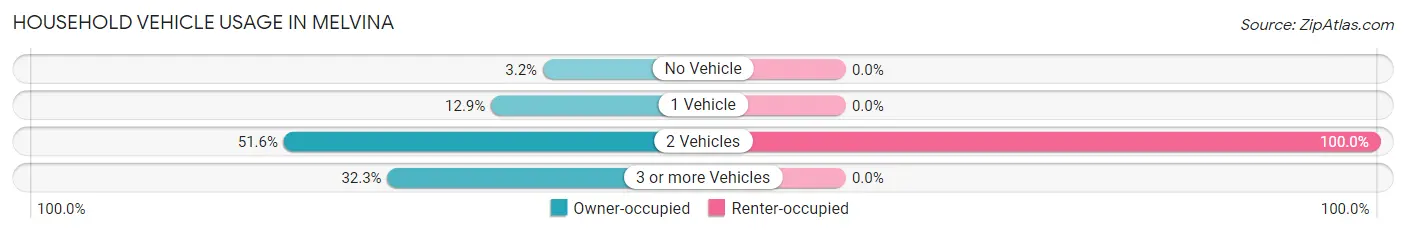
| Vehicles per Household | Owner-occupied | Renter-occupied |
| No Vehicle | 1 (3.2%) | 0 (0.0%) |
| 1 Vehicle | 4 (12.9%) | 0 (0.0%) |
| 2 Vehicles | 16 (51.6%) | 5 (100.0%) |
| 3 or more Vehicles | 10 (32.3%) | 0 (0.0%) |
| Total | 31 (100.0%) | 5 (100.0%) |
Real Estate & Mortgages in Melvina
Real Estate and Mortgage Overview in Melvina
| Characteristic | Without Mortgage | With Mortgage |
| Housing Units | 13 | 18 |
| Median Property Value | - | - |
| Median Household Income | $62,250 | $5 |
| Monthly Housing Costs | $425 | $0 |
| Real Estate Taxes | $1,350 | $1 |
Property Value by Mortgage Status in Melvina
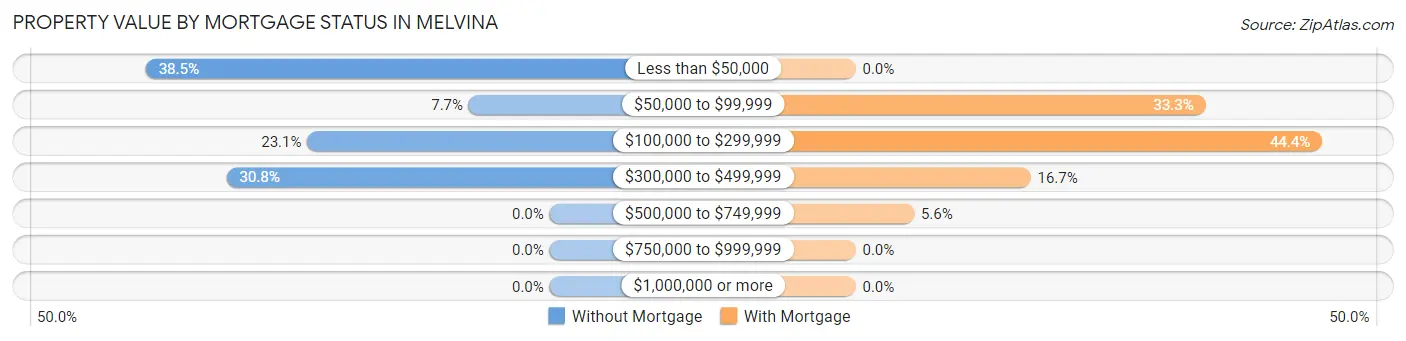
| Property Value | Without Mortgage | With Mortgage |
| Less than $50,000 | 5 (38.5%) | 0 (0.0%) |
| $50,000 to $99,999 | 1 (7.7%) | 6 (33.3%) |
| $100,000 to $299,999 | 3 (23.1%) | 8 (44.4%) |
| $300,000 to $499,999 | 4 (30.8%) | 3 (16.7%) |
| $500,000 to $749,999 | 0 (0.0%) | 1 (5.6%) |
| $750,000 to $999,999 | 0 (0.0%) | 0 (0.0%) |
| $1,000,000 or more | 0 (0.0%) | 0 (0.0%) |
| Total | 13 (100.0%) | 18 (100.0%) |
Household Income by Mortgage Status in Melvina
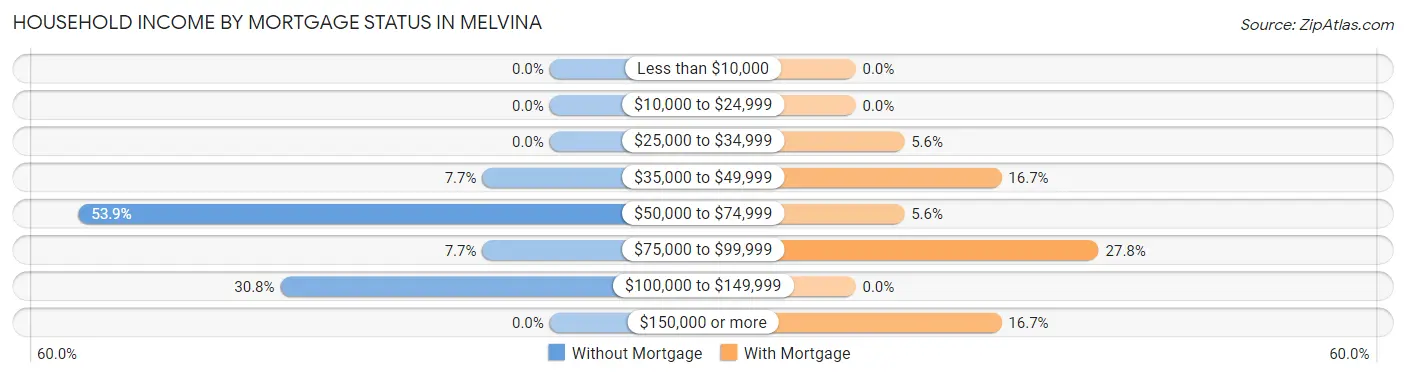
| Household Income | Without Mortgage | With Mortgage |
| Less than $10,000 | 0 (0.0%) | 0 (0.0%) |
| $10,000 to $24,999 | 0 (0.0%) | 0 (0.0%) |
| $25,000 to $34,999 | 0 (0.0%) | 1 (5.6%) |
| $35,000 to $49,999 | 1 (7.7%) | 3 (16.7%) |
| $50,000 to $74,999 | 7 (53.8%) | 1 (5.6%) |
| $75,000 to $99,999 | 1 (7.7%) | 5 (27.8%) |
| $100,000 to $149,999 | 4 (30.8%) | 0 (0.0%) |
| $150,000 or more | 0 (0.0%) | 3 (16.7%) |
| Total | 13 (100.0%) | 18 (100.0%) |
Property Value to Household Income Ratio in Melvina
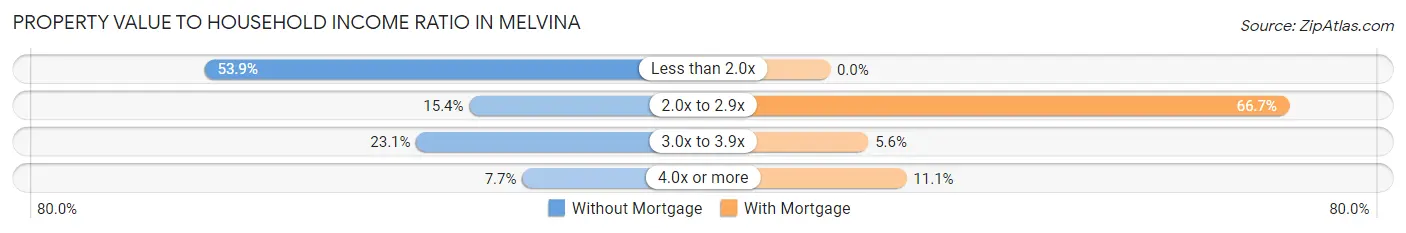
| Value-to-Income Ratio | Without Mortgage | With Mortgage |
| Less than 2.0x | 7 (53.8%) | 0 (0.0%) |
| 2.0x to 2.9x | 2 (15.4%) | 12 (66.7%) |
| 3.0x to 3.9x | 3 (23.1%) | 1 (5.6%) |
| 4.0x or more | 1 (7.7%) | 2 (11.1%) |
| Total | 13 (100.0%) | 18 (100.0%) |
Real Estate Taxes by Mortgage Status in Melvina
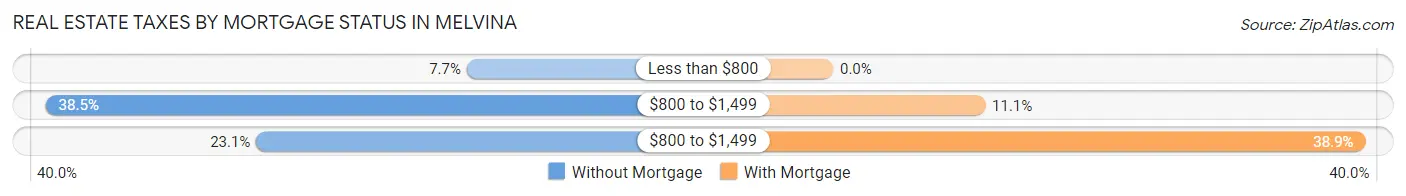
| Property Taxes | Without Mortgage | With Mortgage |
| Less than $800 | 1 (7.7%) | 0 (0.0%) |
| $800 to $1,499 | 5 (38.5%) | 2 (11.1%) |
| $800 to $1,499 | 3 (23.1%) | 7 (38.9%) |
| Total | 13 (100.0%) | 18 (100.0%) |
Health & Disability in Melvina
Health Insurance Coverage by Age in Melvina
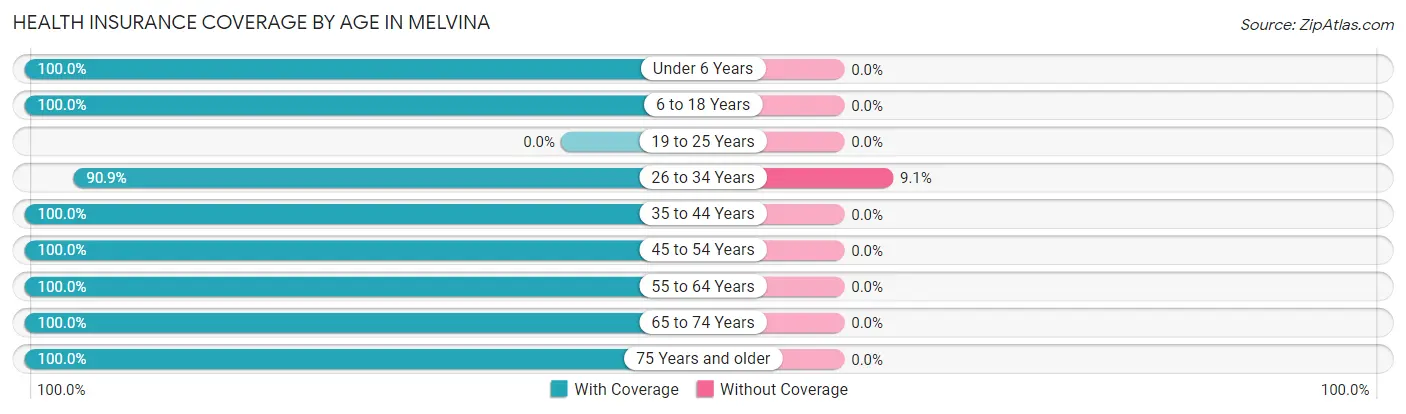
| Age Bracket | With Coverage | Without Coverage |
| Under 6 Years | 6 (100.0%) | 0 (0.0%) |
| 6 to 18 Years | 13 (100.0%) | 0 (0.0%) |
| 19 to 25 Years | 0 (0.0%) | 0 (0.0%) |
| 26 to 34 Years | 10 (90.9%) | 1 (9.1%) |
| 35 to 44 Years | 16 (100.0%) | 0 (0.0%) |
| 45 to 54 Years | 4 (100.0%) | 0 (0.0%) |
| 55 to 64 Years | 27 (100.0%) | 0 (0.0%) |
| 65 to 74 Years | 5 (100.0%) | 0 (0.0%) |
| 75 Years and older | 6 (100.0%) | 0 (0.0%) |
| Total | 87 (98.9%) | 1 (1.1%) |
Health Insurance Coverage by Citizenship Status in Melvina
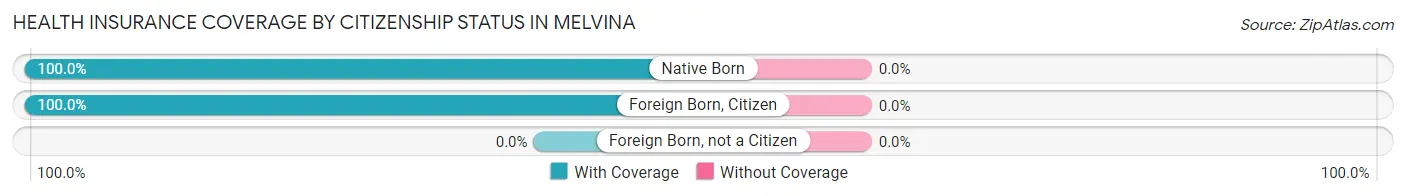
| Citizenship Status | With Coverage | Without Coverage |
| Native Born | 6 (100.0%) | 0 (0.0%) |
| Foreign Born, Citizen | 13 (100.0%) | 0 (0.0%) |
| Foreign Born, not a Citizen | 0 (0.0%) | 0 (0.0%) |
Health Insurance Coverage by Household Income in Melvina
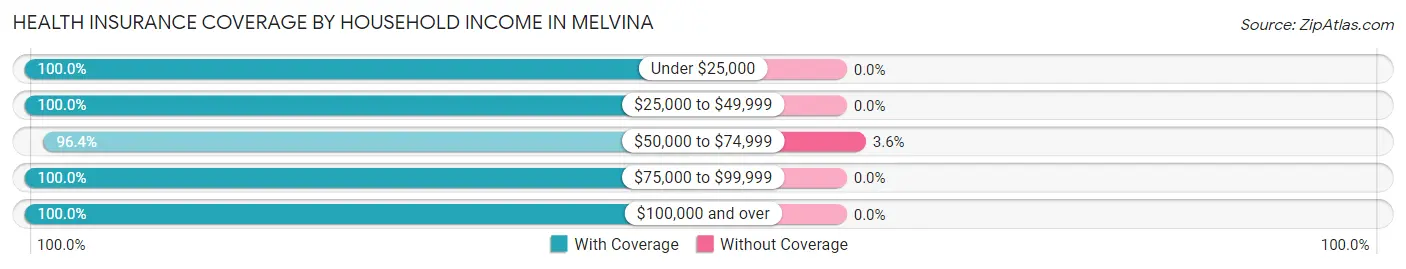
| Household Income | With Coverage | Without Coverage |
| Under $25,000 | 1 (100.0%) | 0 (0.0%) |
| $25,000 to $49,999 | 22 (100.0%) | 0 (0.0%) |
| $50,000 to $74,999 | 27 (96.4%) | 1 (3.6%) |
| $75,000 to $99,999 | 4 (100.0%) | 0 (0.0%) |
| $100,000 and over | 33 (100.0%) | 0 (0.0%) |
Public vs Private Health Insurance Coverage by Age in Melvina
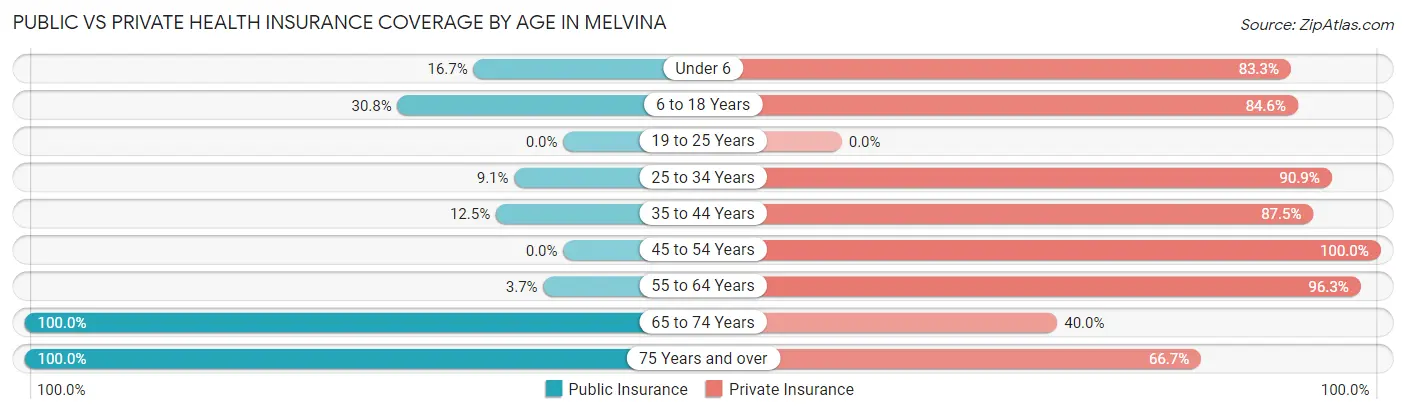
| Age Bracket | Public Insurance | Private Insurance |
| Under 6 | 1 (16.7%) | 5 (83.3%) |
| 6 to 18 Years | 4 (30.8%) | 11 (84.6%) |
| 19 to 25 Years | 0 (0.0%) | 0 (0.0%) |
| 25 to 34 Years | 1 (9.1%) | 10 (90.9%) |
| 35 to 44 Years | 2 (12.5%) | 14 (87.5%) |
| 45 to 54 Years | 0 (0.0%) | 4 (100.0%) |
| 55 to 64 Years | 1 (3.7%) | 26 (96.3%) |
| 65 to 74 Years | 5 (100.0%) | 2 (40.0%) |
| 75 Years and over | 6 (100.0%) | 4 (66.7%) |
| Total | 20 (22.7%) | 76 (86.4%) |
Disability Status by Sex by Age in Melvina
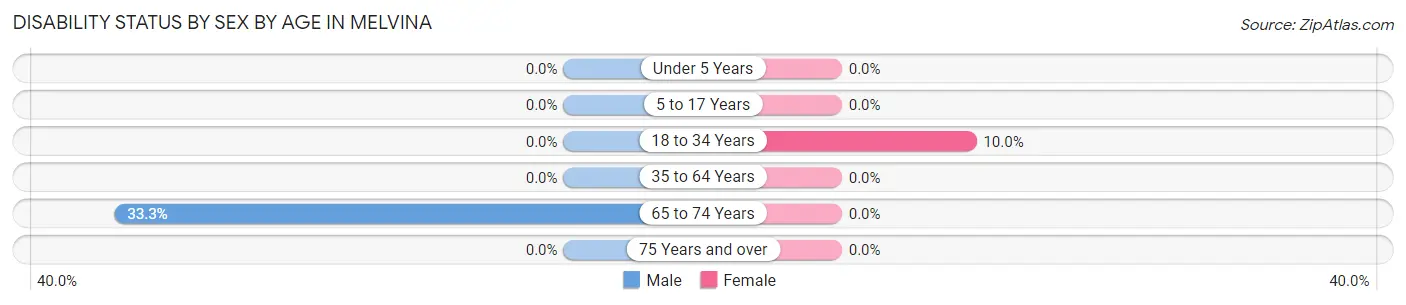
| Age Bracket | Male | Female |
| Under 5 Years | 0 (0.0%) | 0 (0.0%) |
| 5 to 17 Years | 0 (0.0%) | 0 (0.0%) |
| 18 to 34 Years | 0 (0.0%) | 1 (10.0%) |
| 35 to 64 Years | 0 (0.0%) | 0 (0.0%) |
| 65 to 74 Years | 1 (33.3%) | 0 (0.0%) |
| 75 Years and over | 0 (0.0%) | 0 (0.0%) |
Disability Class by Sex by Age in Melvina
Disability Class: Hearing Difficulty
| Age Bracket | Male | Female |
| Under 5 Years | 0 (0.0%) | 0 (0.0%) |
| 5 to 17 Years | 0 (0.0%) | 0 (0.0%) |
| 18 to 34 Years | 0 (0.0%) | 0 (0.0%) |
| 35 to 64 Years | 0 (0.0%) | 0 (0.0%) |
| 65 to 74 Years | 0 (0.0%) | 0 (0.0%) |
| 75 Years and over | 0 (0.0%) | 0 (0.0%) |
Disability Class: Vision Difficulty
| Age Bracket | Male | Female |
| Under 5 Years | 0 (0.0%) | 0 (0.0%) |
| 5 to 17 Years | 0 (0.0%) | 0 (0.0%) |
| 18 to 34 Years | 0 (0.0%) | 0 (0.0%) |
| 35 to 64 Years | 0 (0.0%) | 0 (0.0%) |
| 65 to 74 Years | 0 (0.0%) | 0 (0.0%) |
| 75 Years and over | 0 (0.0%) | 0 (0.0%) |
Disability Class: Cognitive Difficulty
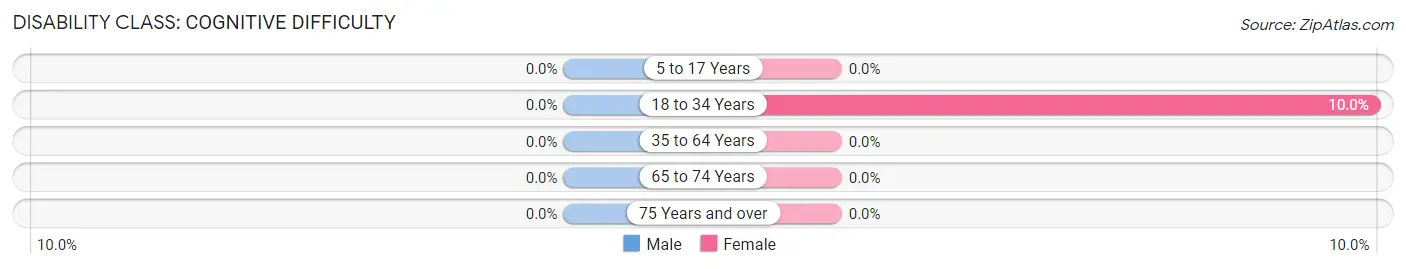
| Age Bracket | Male | Female |
| 5 to 17 Years | 0 (0.0%) | 0 (0.0%) |
| 18 to 34 Years | 0 (0.0%) | 1 (10.0%) |
| 35 to 64 Years | 0 (0.0%) | 0 (0.0%) |
| 65 to 74 Years | 0 (0.0%) | 0 (0.0%) |
| 75 Years and over | 0 (0.0%) | 0 (0.0%) |
Disability Class: Ambulatory Difficulty
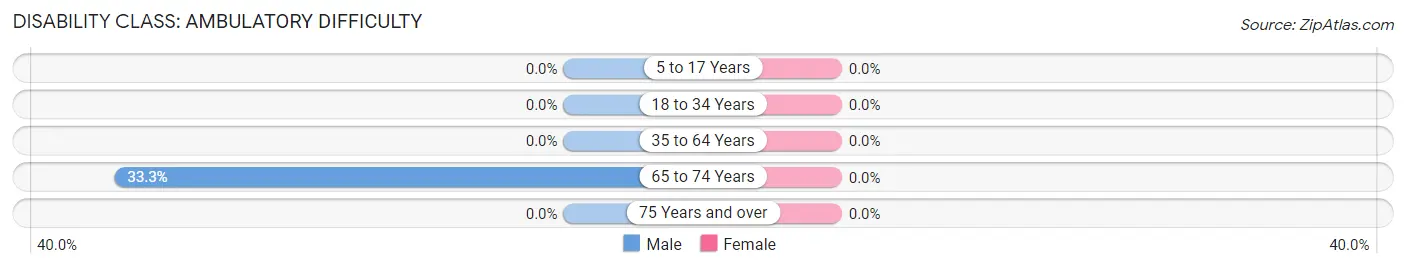
| Age Bracket | Male | Female |
| 5 to 17 Years | 0 (0.0%) | 0 (0.0%) |
| 18 to 34 Years | 0 (0.0%) | 0 (0.0%) |
| 35 to 64 Years | 0 (0.0%) | 0 (0.0%) |
| 65 to 74 Years | 1 (33.3%) | 0 (0.0%) |
| 75 Years and over | 0 (0.0%) | 0 (0.0%) |
Disability Class: Self-Care Difficulty
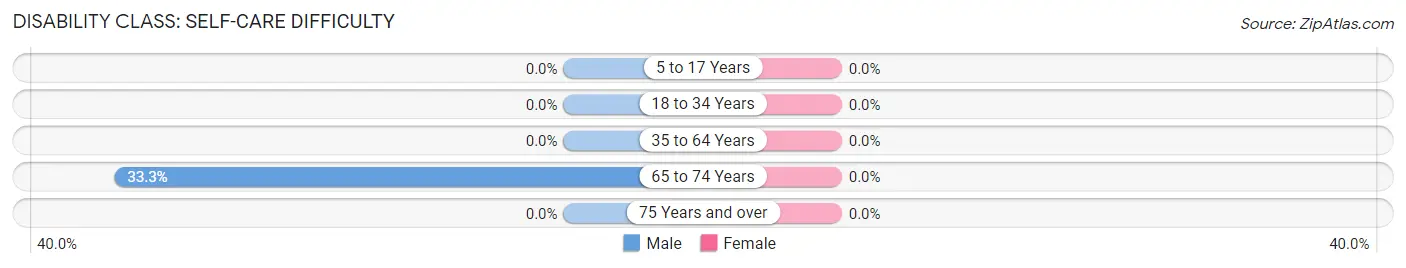
| Age Bracket | Male | Female |
| 5 to 17 Years | 0 (0.0%) | 0 (0.0%) |
| 18 to 34 Years | 0 (0.0%) | 0 (0.0%) |
| 35 to 64 Years | 0 (0.0%) | 0 (0.0%) |
| 65 to 74 Years | 1 (33.3%) | 0 (0.0%) |
| 75 Years and over | 0 (0.0%) | 0 (0.0%) |
Technology Access in Melvina
Computing Device Access in Melvina
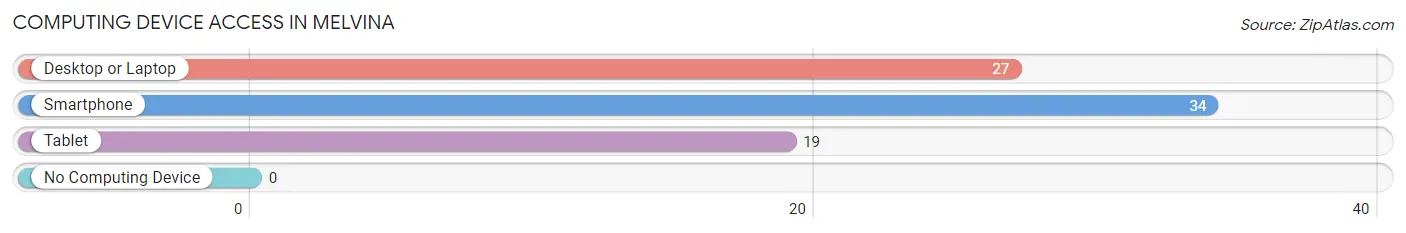
| Device Type | # Households | % Households |
| Desktop or Laptop | 27 | 75.0% |
| Smartphone | 34 | 94.4% |
| Tablet | 19 | 52.8% |
| No Computing Device | 0 | 0.0% |
| Total | 36 | 100.0% |
Internet Access in Melvina
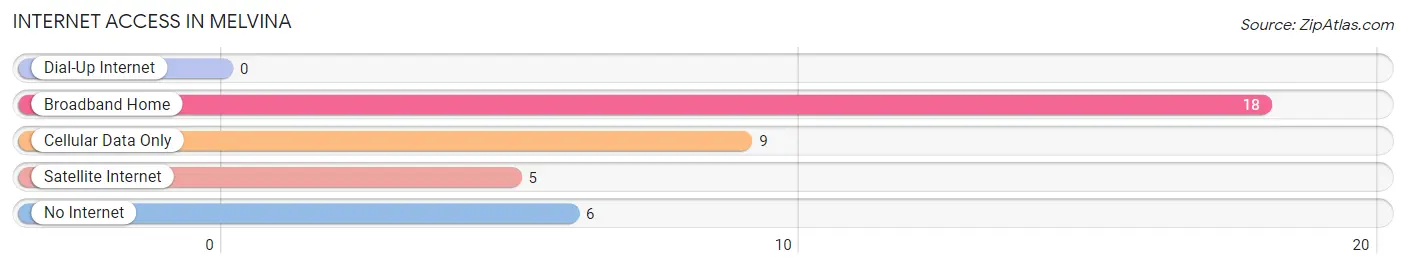
| Internet Type | # Households | % Households |
| Dial-Up Internet | 0 | 0.0% |
| Broadband Home | 18 | 50.0% |
| Cellular Data Only | 9 | 25.0% |
| Satellite Internet | 5 | 13.9% |
| No Internet | 6 | 16.7% |
| Total | 36 | 100.0% |
Melvina Summary
Melvina, Wisconsin is a small unincorporated community located in Monroe County, Wisconsin. It is situated in the rolling hills of the Driftless Area, a region of the Midwest that was not glaciated during the last Ice Age. The town is located on the banks of the Kickapoo River, and is surrounded by lush forests and rolling hills.
History
The area around Melvina was first settled in the early 1800s by German and Irish immigrants. The town was originally known as “Mellvina”, and was named after the daughter of one of the first settlers. The town was officially incorporated in 1856, and the name was changed to “Melvina”.
The town grew slowly over the years, and by the early 1900s, it had become a small farming community. The town was home to a number of small businesses, including a general store, a blacksmith, and a sawmill. The town also had a post office, which was established in 1871.
In the late 1800s, the town was connected to the rest of the state by the Wisconsin Central Railroad. This allowed the town to become more connected to the rest of the state, and allowed for the growth of the local economy.
Geography
Melvina is located in the rolling hills of the Driftless Area, a region of the Midwest that was not glaciated during the last Ice Age. The town is situated on the banks of the Kickapoo River, and is surrounded by lush forests and rolling hills. The town is located about 25 miles south of La Crosse, Wisconsin, and about 50 miles west of Madison, Wisconsin.
The town has a total area of 0.3 square miles, all of which is land. The town is located at an elevation of 845 feet above sea level.
Economy
The economy of Melvina is largely based on agriculture. The town is home to a number of small farms, which produce a variety of crops, including corn, soybeans, and hay. The town is also home to a number of small businesses, including a general store, a blacksmith, and a sawmill.
Demographics
As of the 2010 census, the population of Melvina was 545. The racial makeup of the town was 97.3% White, 0.2% African American, 0.2% Native American, 0.2% Asian, 0.4% from other races, and 1.9% from two or more races. Hispanic or Latino of any race were 1.3% of the population.
The median household income in Melvina was $45,833, and the median family income was $50,000. The per capita income for the town was $20,845. About 8.3% of families and 10.2% of the population were below the poverty line, including 14.3% of those under age 18 and 6.3% of those age 65 or over.
Common Questions
What is Per Capita Income in Melvina?
Per Capita income in Melvina is $38,834.
What is the Median Family Income in Melvina?
Median Family Income in Melvina is $62,000.
What is the Median Household income in Melvina?
Median Household Income in Melvina is $68,000.
What is Income or Wage Gap in Melvina?
Income or Wage Gap in Melvina is 25.0%.
Women in Melvina earn 75.0 cents for every dollar earned by a man.
What is Inequality or Gini Index in Melvina?
Inequality or Gini Index in Melvina is 0.33.
What is the Total Population of Melvina?
Total Population of Melvina is 91.
What is the Total Male Population of Melvina?
Total Male Population of Melvina is 37.
What is the Total Female Population of Melvina?
Total Female Population of Melvina is 54.
What is the Ratio of Males per 100 Females in Melvina?
There are 68.52 Males per 100 Females in Melvina.
What is the Ratio of Females per 100 Males in Melvina?
There are 145.95 Females per 100 Males in Melvina.
What is the Median Population Age in Melvina?
Median Population Age in Melvina is 42.8 Years.
What is the Average Family Size in Melvina
Average Family Size in Melvina is 2.7 People.
What is the Average Household Size in Melvina
Average Household Size in Melvina is 2.5 People.
How Large is the Labor Force in Melvina?
There are 63 People in the Labor Forcein in Melvina.
What is the Percentage of People in the Labor Force in Melvina?
85.1% of People are in the Labor Force in Melvina.