Lake Wazeecha, WI Map & Demographics
Lake Wazeecha Map
Lake Wazeecha Overview
$49,673
PER CAPITA INCOME
$100,772
AVG FAMILY INCOME
$88,505
AVG HOUSEHOLD INCOME
33.5%
WAGE / INCOME GAP [ % ]
66.5¢/ $1
WAGE / INCOME GAP [ $ ]
0.46
INEQUALITY / GINI INDEX
2,682
TOTAL POPULATION
1,473
MALE POPULATION
1,209
FEMALE POPULATION
121.84
MALES / 100 FEMALES
82.08
FEMALES / 100 MALES
52.8
MEDIAN AGE
2.7
AVG FAMILY SIZE
2.4
AVG HOUSEHOLD SIZE
1,216
LABOR FORCE [ PEOPLE ]
54.1%
PERCENT IN LABOR FORCE
2.6%
UNEMPLOYMENT RATE
Income in Lake Wazeecha
Income Overview in Lake Wazeecha
Per Capita Income in Lake Wazeecha is $49,673, while median incomes of families and households are $100,772 and $88,505 respectively.
| Characteristic | Number | Measure |
| Per Capita Income | 2,682 | $49,673 |
| Median Family Income | 833 | $100,772 |
| Mean Family Income | 833 | $135,403 |
| Median Household Income | 1,129 | $88,505 |
| Mean Household Income | 1,129 | $112,951 |
| Income Deficit | 833 | $0 |
| Wage / Income Gap (%) | 2,682 | 33.47% |
| Wage / Income Gap ($) | 2,682 | 66.53¢ per $1 |
| Gini / Inequality Index | 2,682 | 0.46 |
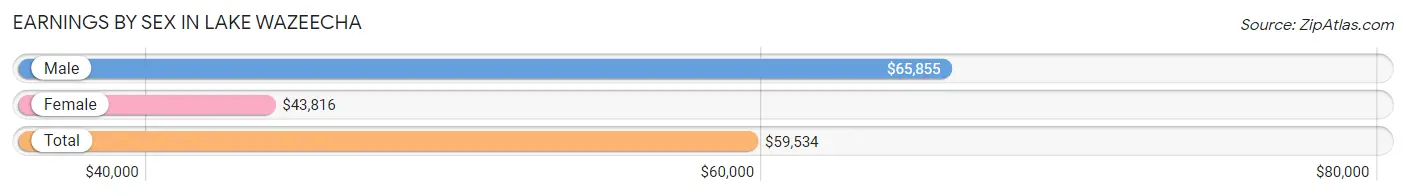
Earnings by Sex in Lake Wazeecha
Average Earnings in Lake Wazeecha are $59,534, $65,855 for men and $43,816 for women, a difference of 33.5%.
| Sex | Number | Average Earnings |
| Male | 776 (57.2%) | $65,855 |
| Female | 580 (42.8%) | $43,816 |
| Total | 1,356 (100.0%) | $59,534 |
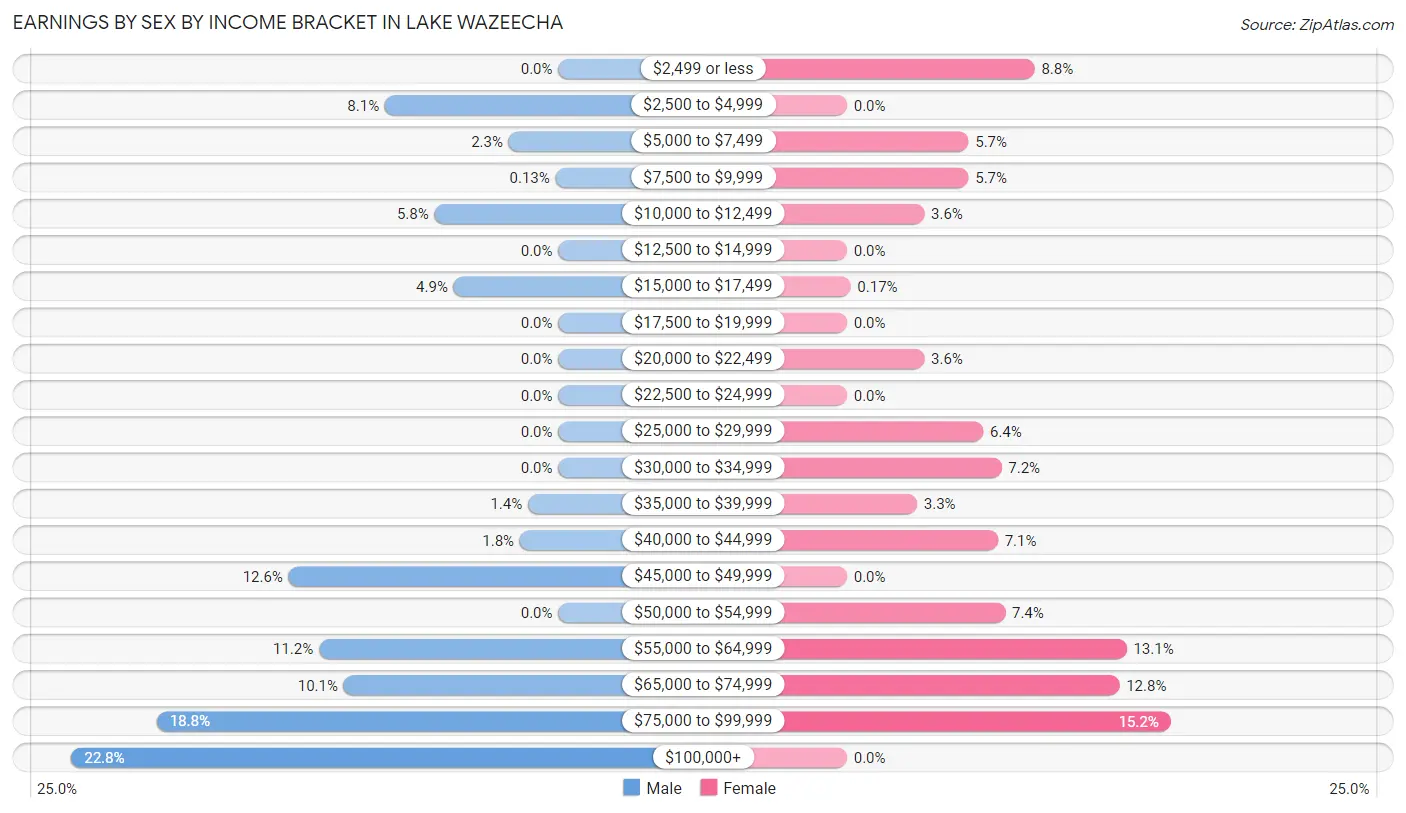
Earnings by Sex by Income Bracket in Lake Wazeecha
The most common earnings brackets in Lake Wazeecha are $100,000+ for men (177 | 22.8%) and $75,000 to $99,999 for women (88 | 15.2%).
| Income | Male | Female |
| $2,499 or less | 0 (0.0%) | 51 (8.8%) |
| $2,500 to $4,999 | 63 (8.1%) | 0 (0.0%) |
| $5,000 to $7,499 | 18 (2.3%) | 33 (5.7%) |
| $7,500 to $9,999 | 1 (0.1%) | 33 (5.7%) |
| $10,000 to $12,499 | 45 (5.8%) | 21 (3.6%) |
| $12,500 to $14,999 | 0 (0.0%) | 0 (0.0%) |
| $15,000 to $17,499 | 38 (4.9%) | 1 (0.2%) |
| $17,500 to $19,999 | 0 (0.0%) | 0 (0.0%) |
| $20,000 to $22,499 | 0 (0.0%) | 21 (3.6%) |
| $22,500 to $24,999 | 0 (0.0%) | 0 (0.0%) |
| $25,000 to $29,999 | 0 (0.0%) | 37 (6.4%) |
| $30,000 to $34,999 | 0 (0.0%) | 42 (7.2%) |
| $35,000 to $39,999 | 11 (1.4%) | 19 (3.3%) |
| $40,000 to $44,999 | 14 (1.8%) | 41 (7.1%) |
| $45,000 to $49,999 | 98 (12.6%) | 0 (0.0%) |
| $50,000 to $54,999 | 0 (0.0%) | 43 (7.4%) |
| $55,000 to $64,999 | 87 (11.2%) | 76 (13.1%) |
| $65,000 to $74,999 | 78 (10.1%) | 74 (12.8%) |
| $75,000 to $99,999 | 146 (18.8%) | 88 (15.2%) |
| $100,000+ | 177 (22.8%) | 0 (0.0%) |
| Total | 776 (100.0%) | 580 (100.0%) |
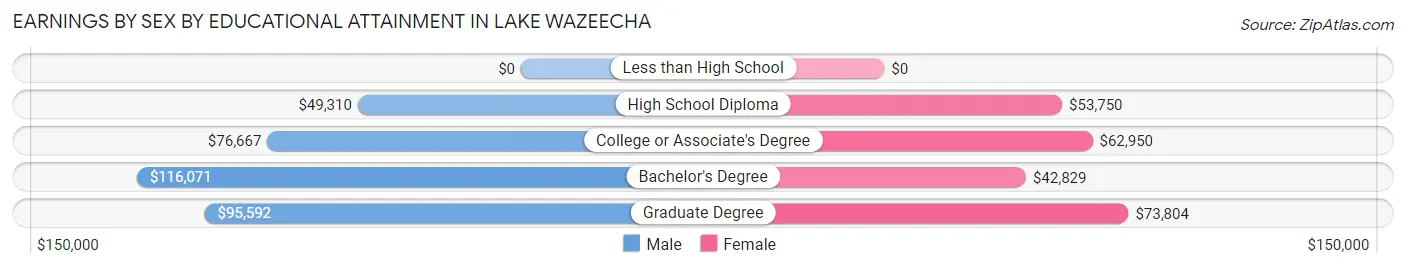
Earnings by Sex by Educational Attainment in Lake Wazeecha
Average earnings in Lake Wazeecha are $66,429 for men and $53,750 for women, a difference of 19.1%. Men with an educational attainment of bachelor's degree enjoy the highest average annual earnings of $116,071, while those with high school diploma education earn the least with $49,310. Women with an educational attainment of graduate degree earn the most with the average annual earnings of $73,804, while those with bachelor's degree education have the smallest earnings of $42,829.
| Educational Attainment | Male Income | Female Income |
| Less than High School | - | - |
| High School Diploma | $49,310 | $53,750 |
| College or Associate's Degree | $76,667 | $62,950 |
| Bachelor's Degree | $116,071 | $42,829 |
| Graduate Degree | $95,592 | $73,804 |
| Total | $66,429 | $53,750 |
Family Income in Lake Wazeecha
Family Income Brackets in Lake Wazeecha
According to the Lake Wazeecha family income data, there are 241 families falling into the $75,000 to $99,999 income range, which is the most common income bracket and makes up 28.9% of all families. Conversely, the less than $10,000 income bracket is the least frequent group with only 14 families (1.7%) belonging to this category.
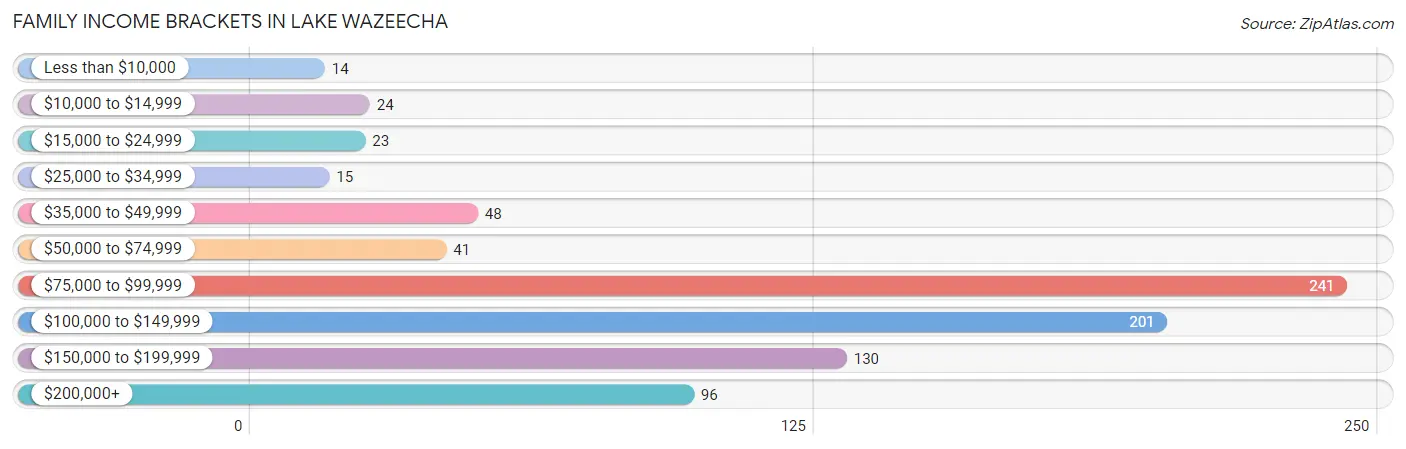
| Income Bracket | # Families | % Families |
| Less than $10,000 | 14 | 1.7% |
| $10,000 to $14,999 | 24 | 2.9% |
| $15,000 to $24,999 | 23 | 2.8% |
| $25,000 to $34,999 | 15 | 1.8% |
| $35,000 to $49,999 | 48 | 5.8% |
| $50,000 to $74,999 | 41 | 4.9% |
| $75,000 to $99,999 | 241 | 28.9% |
| $100,000 to $149,999 | 201 | 24.1% |
| $150,000 to $199,999 | 130 | 15.6% |
| $200,000+ | 96 | 11.5% |
Family Income by Famaliy Size in Lake Wazeecha
4-person families (152 | 18.2%) account for the highest median family income in Lake Wazeecha with $135,694 per family, while 2-person families (562 | 67.5%) have the highest median income of $48,012 per family member.
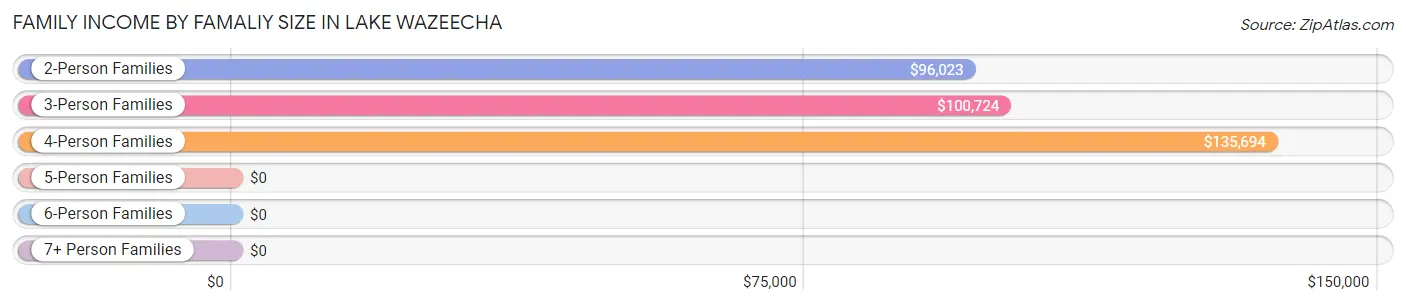
| Income Bracket | # Families | Median Income |
| 2-Person Families | 562 (67.5%) | $96,023 |
| 3-Person Families | 97 (11.6%) | $100,724 |
| 4-Person Families | 152 (18.2%) | $135,694 |
| 5-Person Families | 0 (0.0%) | $0 |
| 6-Person Families | 0 (0.0%) | $0 |
| 7+ Person Families | 22 (2.6%) | $0 |
| Total | 833 (100.0%) | $100,772 |
Family Income by Number of Earners in Lake Wazeecha
The median family income in Lake Wazeecha is $100,772, with families comprising 3+ earners (53) having the highest median family income of $174,792, while families with no earners (214) have the lowest median family income of $52,417, accounting for 6.4% and 25.7% of families, respectively.
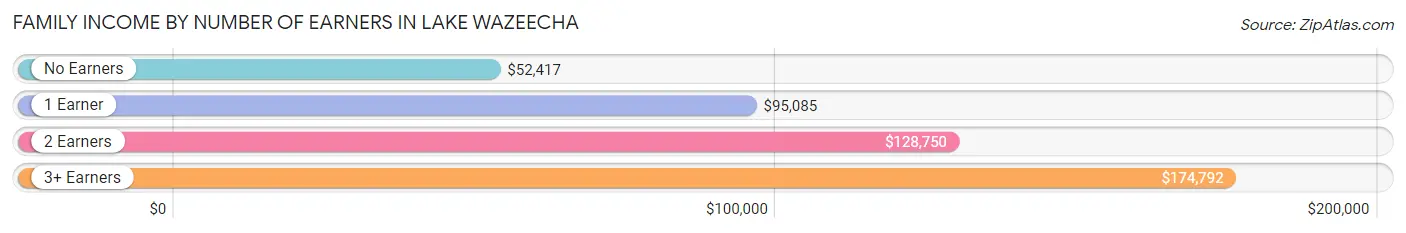
| Number of Earners | # Families | Median Income |
| No Earners | 214 (25.7%) | $52,417 |
| 1 Earner | 165 (19.8%) | $95,085 |
| 2 Earners | 401 (48.1%) | $128,750 |
| 3+ Earners | 53 (6.4%) | $174,792 |
| Total | 833 (100.0%) | $100,772 |
Household Income in Lake Wazeecha
Household Income Brackets in Lake Wazeecha
With 270 households falling in the category, the $75,000 to $99,999 income range is the most frequent in Lake Wazeecha, accounting for 23.9% of all households. In contrast, only 24 households (2.1%) fall into the $10,000 to $14,999 income bracket, making it the least populous group.
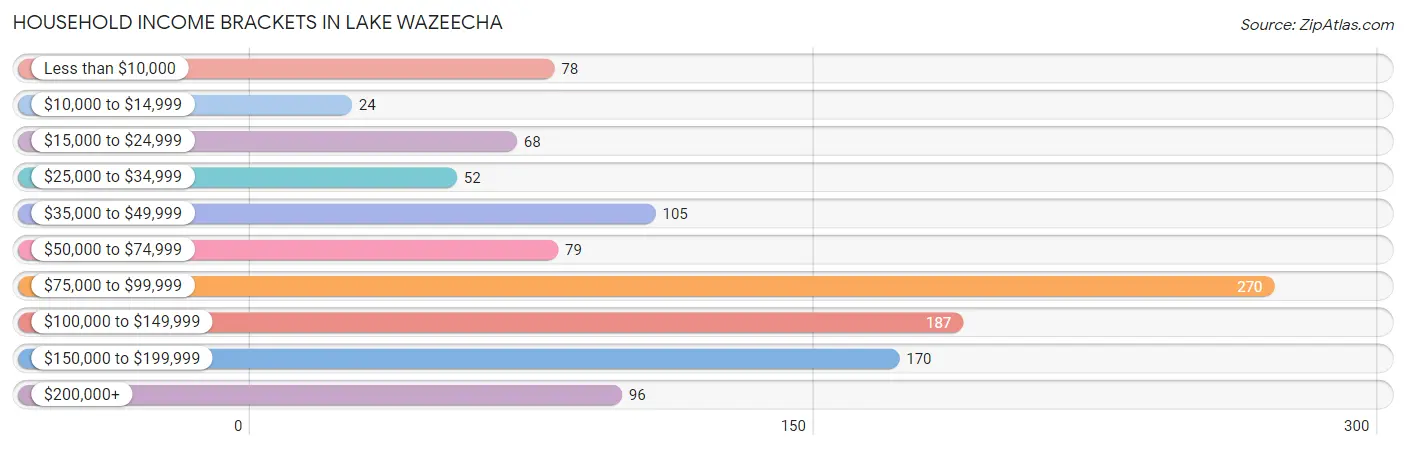
| Income Bracket | # Households | % Households |
| Less than $10,000 | 78 | 6.9% |
| $10,000 to $14,999 | 24 | 2.1% |
| $15,000 to $24,999 | 68 | 6.0% |
| $25,000 to $34,999 | 52 | 4.6% |
| $35,000 to $49,999 | 105 | 9.3% |
| $50,000 to $74,999 | 79 | 7.0% |
| $75,000 to $99,999 | 270 | 23.9% |
| $100,000 to $149,999 | 187 | 16.6% |
| $150,000 to $199,999 | 170 | 15.1% |
| $200,000+ | 96 | 8.5% |
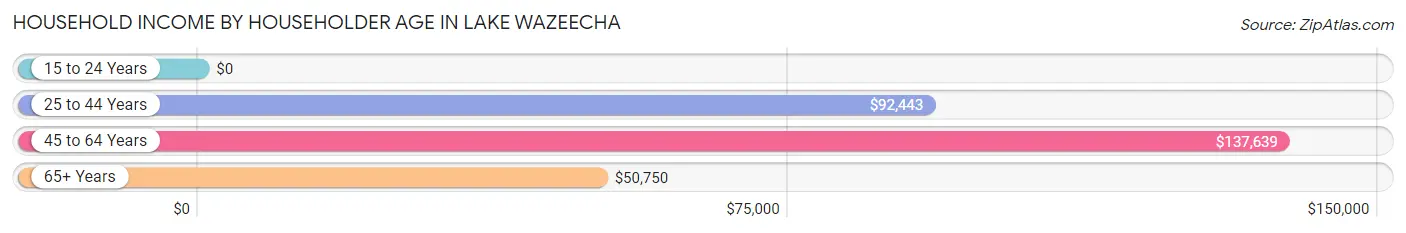
Household Income by Householder Age in Lake Wazeecha
The median household income in Lake Wazeecha is $88,505, with the highest median household income of $137,639 found in the 45 to 64 years age bracket for the primary householder. A total of 566 households (50.1%) fall into this category.
| Income Bracket | # Households | Median Income |
| 15 to 24 Years | 0 (0.0%) | $0 |
| 25 to 44 Years | 169 (15.0%) | $92,443 |
| 45 to 64 Years | 566 (50.1%) | $137,639 |
| 65+ Years | 394 (34.9%) | $50,750 |
| Total | 1,129 (100.0%) | $88,505 |
Poverty in Lake Wazeecha
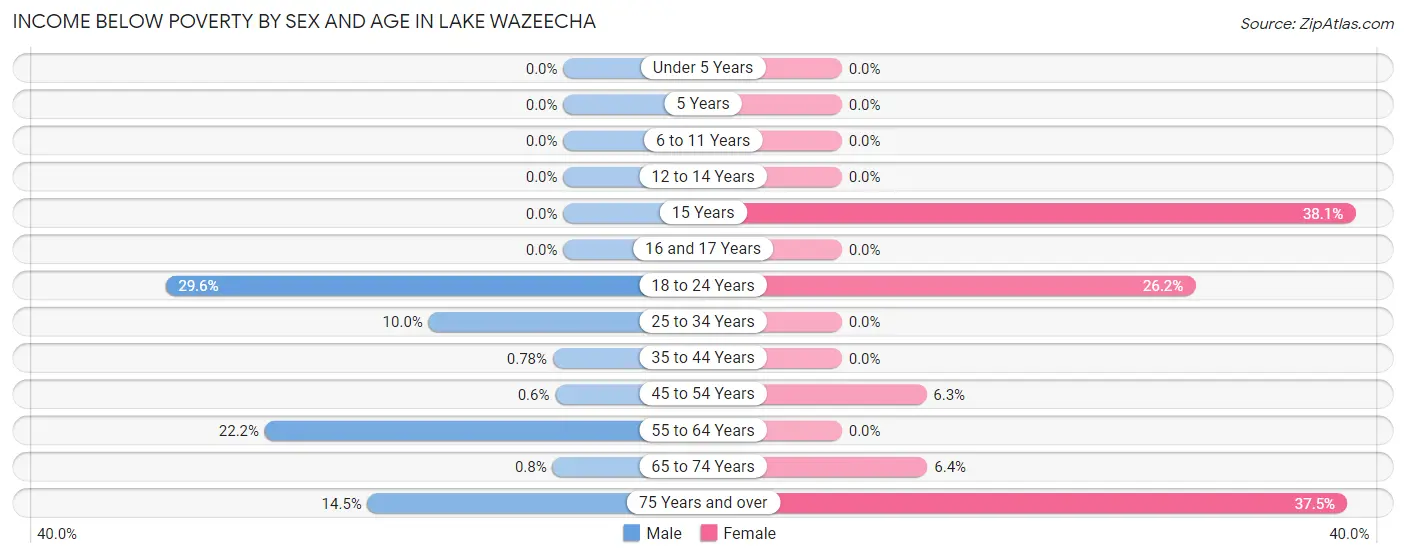
Income Below Poverty by Sex and Age in Lake Wazeecha
With 8.7% poverty level for males and 7.1% for females among the residents of Lake Wazeecha, 18 to 24 year old males and 15 year old females are the most vulnerable to poverty, with 13 males (29.5%) and 16 females (38.1%) in their respective age groups living below the poverty level.
| Age Bracket | Male | Female |
| Under 5 Years | 0 (0.0%) | 0 (0.0%) |
| 5 Years | 0 (0.0%) | 0 (0.0%) |
| 6 to 11 Years | 0 (0.0%) | 0 (0.0%) |
| 12 to 14 Years | 0 (0.0%) | 0 (0.0%) |
| 15 Years | 0 (0.0%) | 16 (38.1%) |
| 16 and 17 Years | 0 (0.0%) | 0 (0.0%) |
| 18 to 24 Years | 13 (29.5%) | 16 (26.2%) |
| 25 to 34 Years | 16 (10.0%) | 0 (0.0%) |
| 35 to 44 Years | 1 (0.8%) | 0 (0.0%) |
| 45 to 54 Years | 1 (0.6%) | 14 (6.3%) |
| 55 to 64 Years | 78 (22.2%) | 0 (0.0%) |
| 65 to 74 Years | 2 (0.8%) | 16 (6.4%) |
| 75 Years and over | 17 (14.5%) | 24 (37.5%) |
| Total | 128 (8.7%) | 86 (7.1%) |
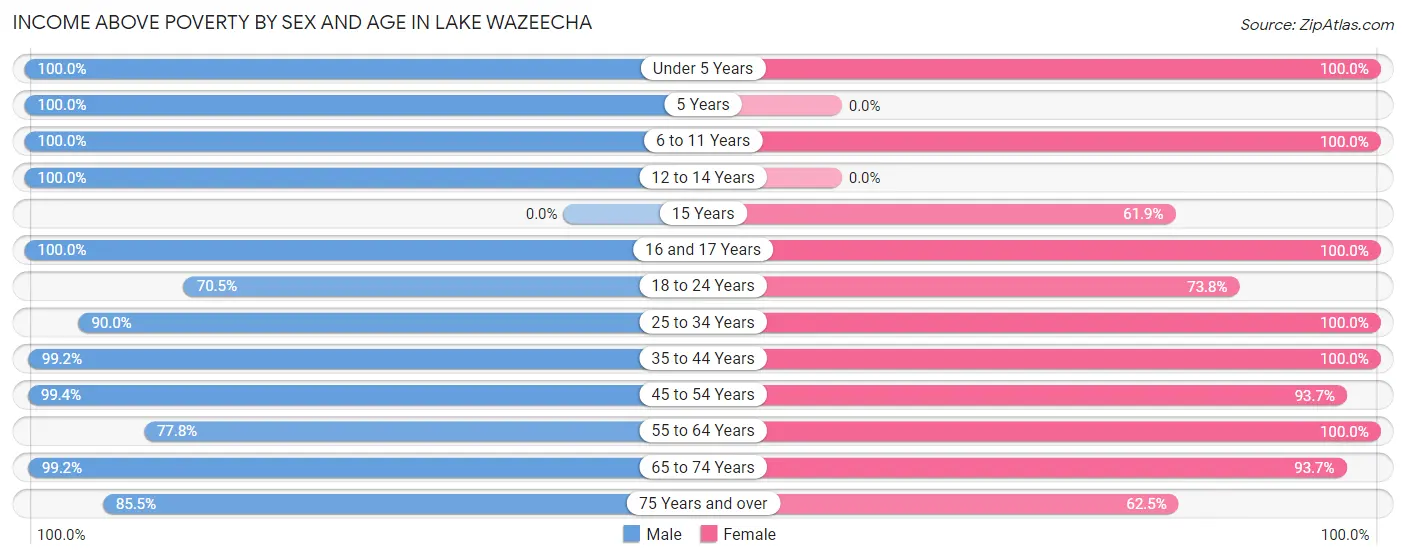
Income Above Poverty by Sex and Age in Lake Wazeecha
According to the poverty statistics in Lake Wazeecha, males aged under 5 years and females aged under 5 years are the age groups that are most secure financially, with 100.0% of males and 100.0% of females in these age groups living above the poverty line.
| Age Bracket | Male | Female |
| Under 5 Years | 46 (100.0%) | 63 (100.0%) |
| 5 Years | 21 (100.0%) | 0 (0.0%) |
| 6 to 11 Years | 148 (100.0%) | 91 (100.0%) |
| 12 to 14 Years | 23 (100.0%) | 0 (0.0%) |
| 15 Years | 0 (0.0%) | 26 (61.9%) |
| 16 and 17 Years | 15 (100.0%) | 22 (100.0%) |
| 18 to 24 Years | 31 (70.5%) | 45 (73.8%) |
| 25 to 34 Years | 144 (90.0%) | 69 (100.0%) |
| 35 to 44 Years | 127 (99.2%) | 117 (100.0%) |
| 45 to 54 Years | 167 (99.4%) | 209 (93.7%) |
| 55 to 64 Years | 274 (77.8%) | 205 (100.0%) |
| 65 to 74 Years | 249 (99.2%) | 236 (93.6%) |
| 75 Years and over | 100 (85.5%) | 40 (62.5%) |
| Total | 1,345 (91.3%) | 1,123 (92.9%) |
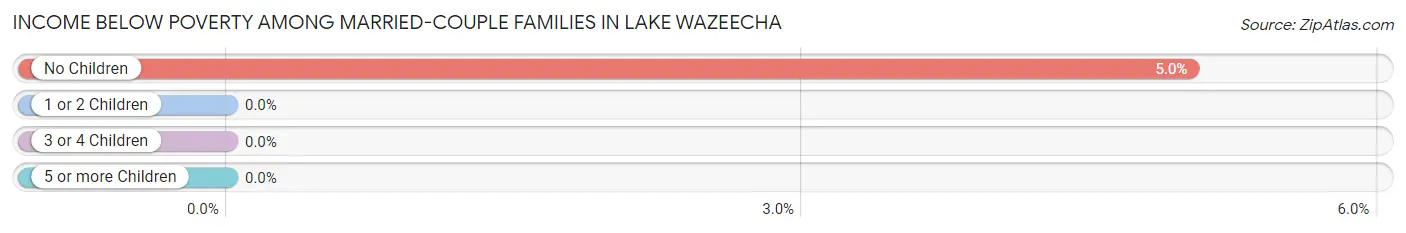
Income Below Poverty Among Married-Couple Families in Lake Wazeecha
The poverty statistics for married-couple families in Lake Wazeecha show that 3.6% or 27 of the total 747 families live below the poverty line. Families with no children have the highest poverty rate of 5.0%, comprising of 27 families. On the other hand, families with 1 or 2 children have the lowest poverty rate of 0.0%, which includes 0 families.
| Children | Above Poverty | Below Poverty |
| No Children | 511 (95.0%) | 27 (5.0%) |
| 1 or 2 Children | 187 (100.0%) | 0 (0.0%) |
| 3 or 4 Children | 0 (0.0%) | 0 (0.0%) |
| 5 or more Children | 22 (100.0%) | 0 (0.0%) |
| Total | 720 (96.4%) | 27 (3.6%) |
Income Below Poverty Among Single-Parent Households in Lake Wazeecha
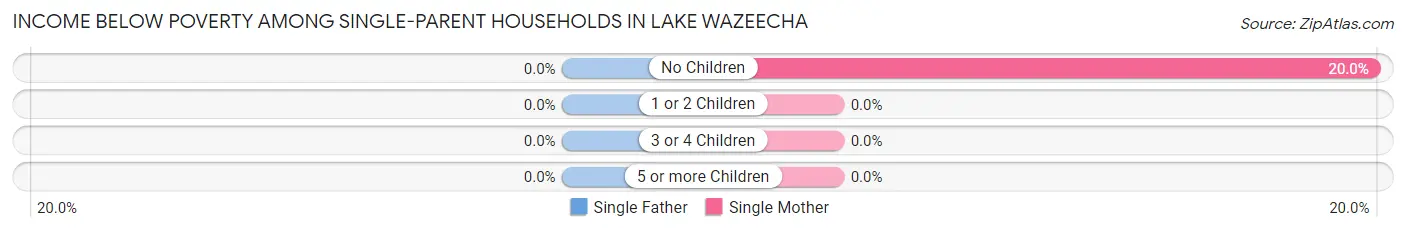
| Children | Single Father | Single Mother |
| No Children | 0 (0.0%) | 11 (20.0%) |
| 1 or 2 Children | 0 (0.0%) | 0 (0.0%) |
| 3 or 4 Children | 0 (0.0%) | 0 (0.0%) |
| 5 or more Children | 0 (0.0%) | 0 (0.0%) |
| Total | 0 (0.0%) | 11 (16.2%) |
Income Below Poverty Among Married-Couple vs Single-Parent Households in Lake Wazeecha
The poverty data for Lake Wazeecha shows that 27 of the married-couple family households (3.6%) and 11 of the single-parent households (12.8%) are living below the poverty level. Within the married-couple family households, those with no children have the highest poverty rate, with 27 households (5.0%) falling below the poverty line. Among the single-parent households, those with no children have the highest poverty rate, with 11 household (15.1%) living below poverty.
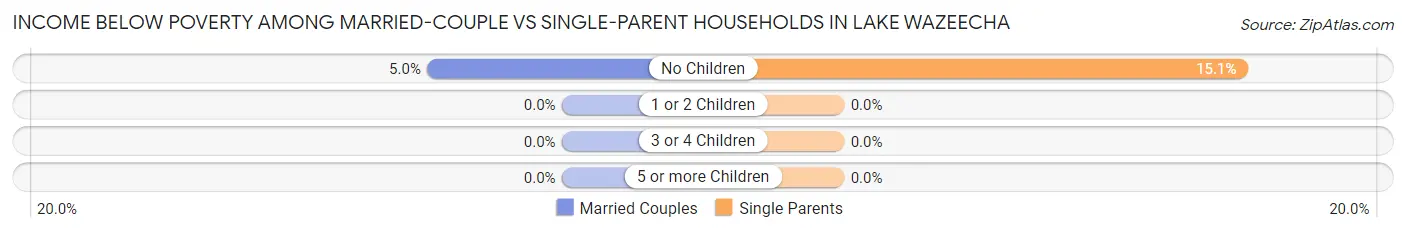
| Children | Married-Couple Families | Single-Parent Households |
| No Children | 27 (5.0%) | 11 (15.1%) |
| 1 or 2 Children | 0 (0.0%) | 0 (0.0%) |
| 3 or 4 Children | 0 (0.0%) | 0 (0.0%) |
| 5 or more Children | 0 (0.0%) | 0 (0.0%) |
| Total | 27 (3.6%) | 11 (12.8%) |
Race in Lake Wazeecha
The most populous races in Lake Wazeecha are White / Caucasian (2,577 | 96.1%), Two or more Races (77 | 2.9%), and Asian (28 | 1.0%).
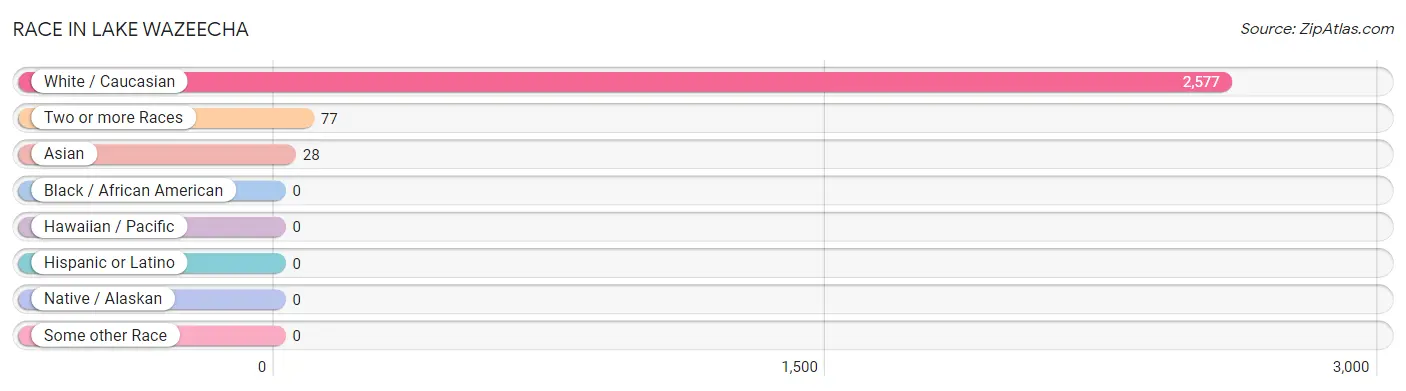
| Race | # Population | % Population |
| Asian | 28 | 1.0% |
| Black / African American | 0 | 0.0% |
| Hawaiian / Pacific | 0 | 0.0% |
| Hispanic or Latino | 0 | 0.0% |
| Native / Alaskan | 0 | 0.0% |
| White / Caucasian | 2,577 | 96.1% |
| Two or more Races | 77 | 2.9% |
| Some other Race | 0 | 0.0% |
| Total | 2,682 | 100.0% |
Ancestry in Lake Wazeecha
The most populous ancestries reported in Lake Wazeecha are German (1,141 | 42.5%), Irish (313 | 11.7%), Polish (281 | 10.5%), English (261 | 9.7%), and Norwegian (220 | 8.2%), together accounting for 82.6% of all Lake Wazeecha residents.
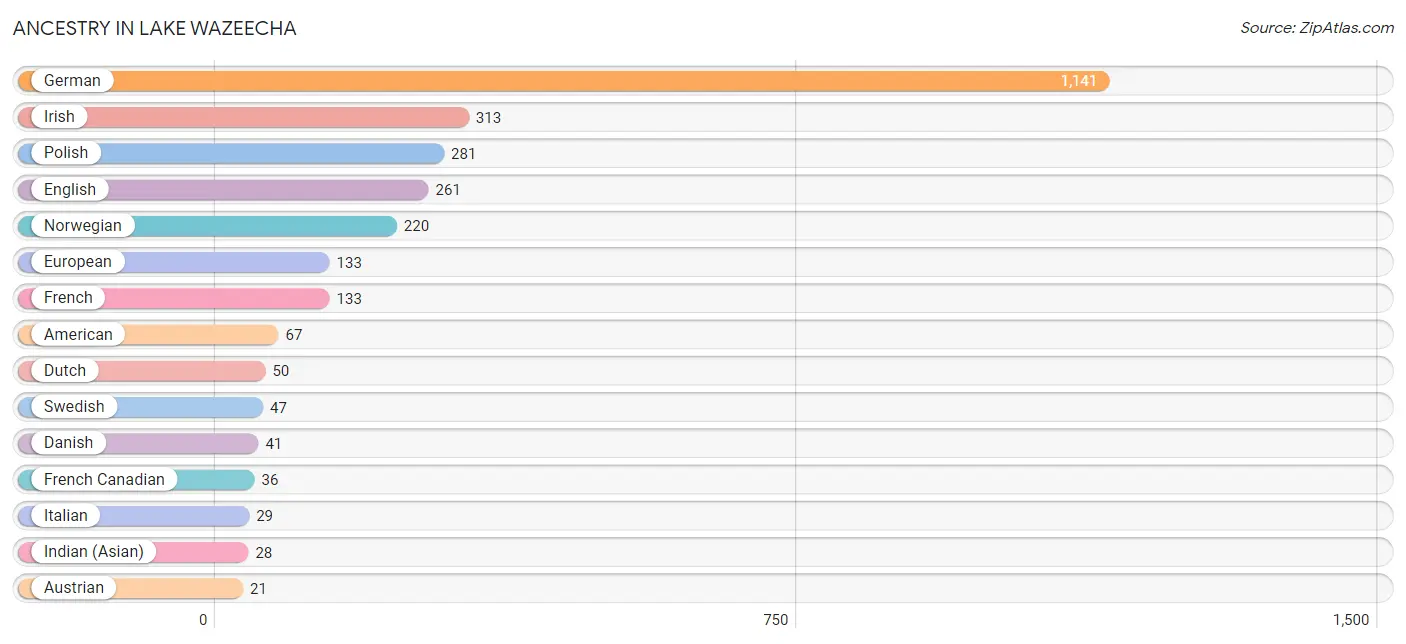
| Ancestry | # Population | % Population |
| American | 67 | 2.5% |
| Austrian | 21 | 0.8% |
| Belgian | 20 | 0.7% |
| Croatian | 21 | 0.8% |
| Czech | 15 | 0.6% |
| Danish | 41 | 1.5% |
| Dutch | 50 | 1.9% |
| English | 261 | 9.7% |
| European | 133 | 5.0% |
| French | 133 | 5.0% |
| French Canadian | 36 | 1.3% |
| German | 1,141 | 42.5% |
| Indian (Asian) | 28 | 1.0% |
| Irish | 313 | 11.7% |
| Italian | 29 | 1.1% |
| Norwegian | 220 | 8.2% |
| Polish | 281 | 10.5% |
| Russian | 14 | 0.5% |
| Scotch-Irish | 21 | 0.8% |
| Slovak | 15 | 0.6% |
| Swedish | 47 | 1.8% | View All 21 Rows |
Immigrants in Lake Wazeecha
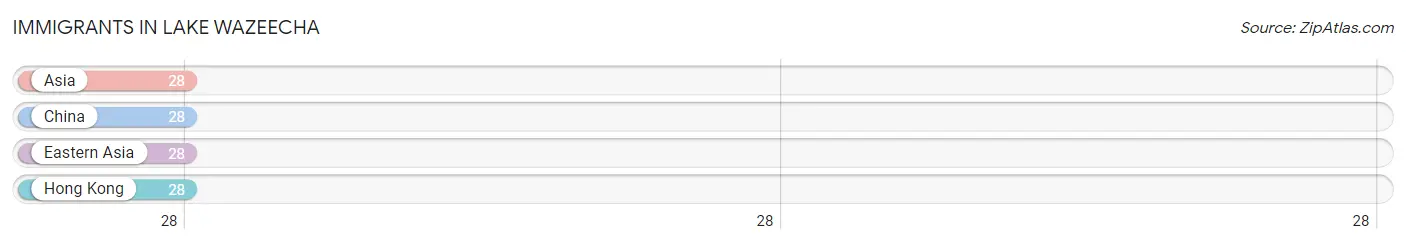
The most numerous immigrant groups reported in Lake Wazeecha came from Asia (28 | 1.0%), China (28 | 1.0%), Eastern Asia (28 | 1.0%), and Hong Kong (28 | 1.0%), together accounting for 4.2% of all Lake Wazeecha residents.
| Immigration Origin | # Population | % Population |
| Asia | 28 | 1.0% |
| China | 28 | 1.0% |
| Eastern Asia | 28 | 1.0% |
| Hong Kong | 28 | 1.0% | View All 4 Rows |
Sex and Age in Lake Wazeecha
Sex and Age in Lake Wazeecha
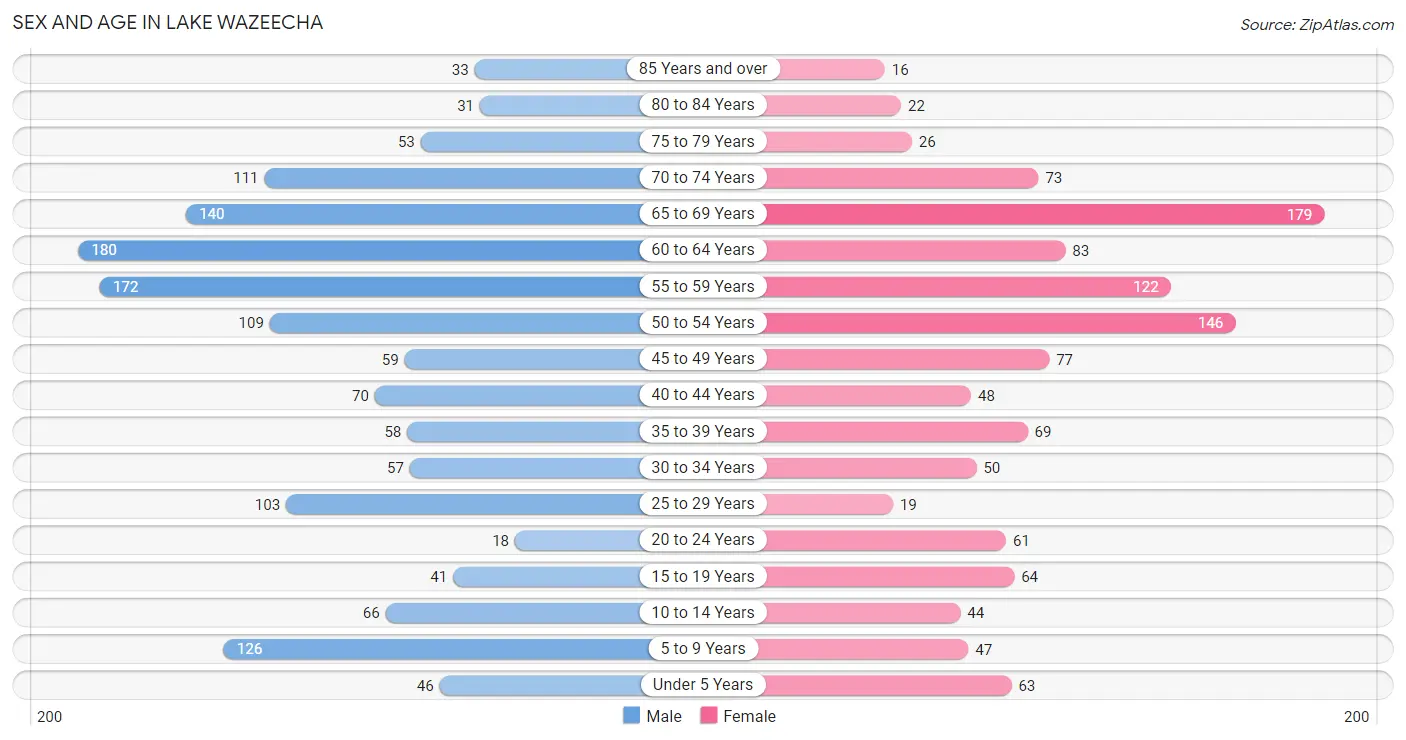
The most populous age groups in Lake Wazeecha are 60 to 64 Years (180 | 12.2%) for men and 65 to 69 Years (179 | 14.8%) for women.
| Age Bracket | Male | Female |
| Under 5 Years | 46 (3.1%) | 63 (5.2%) |
| 5 to 9 Years | 126 (8.6%) | 47 (3.9%) |
| 10 to 14 Years | 66 (4.5%) | 44 (3.6%) |
| 15 to 19 Years | 41 (2.8%) | 64 (5.3%) |
| 20 to 24 Years | 18 (1.2%) | 61 (5.1%) |
| 25 to 29 Years | 103 (7.0%) | 19 (1.6%) |
| 30 to 34 Years | 57 (3.9%) | 50 (4.1%) |
| 35 to 39 Years | 58 (3.9%) | 69 (5.7%) |
| 40 to 44 Years | 70 (4.8%) | 48 (4.0%) |
| 45 to 49 Years | 59 (4.0%) | 77 (6.4%) |
| 50 to 54 Years | 109 (7.4%) | 146 (12.1%) |
| 55 to 59 Years | 172 (11.7%) | 122 (10.1%) |
| 60 to 64 Years | 180 (12.2%) | 83 (6.9%) |
| 65 to 69 Years | 140 (9.5%) | 179 (14.8%) |
| 70 to 74 Years | 111 (7.5%) | 73 (6.0%) |
| 75 to 79 Years | 53 (3.6%) | 26 (2.1%) |
| 80 to 84 Years | 31 (2.1%) | 22 (1.8%) |
| 85 Years and over | 33 (2.2%) | 16 (1.3%) |
| Total | 1,473 (100.0%) | 1,209 (100.0%) |
Families and Households in Lake Wazeecha
Median Family Size in Lake Wazeecha
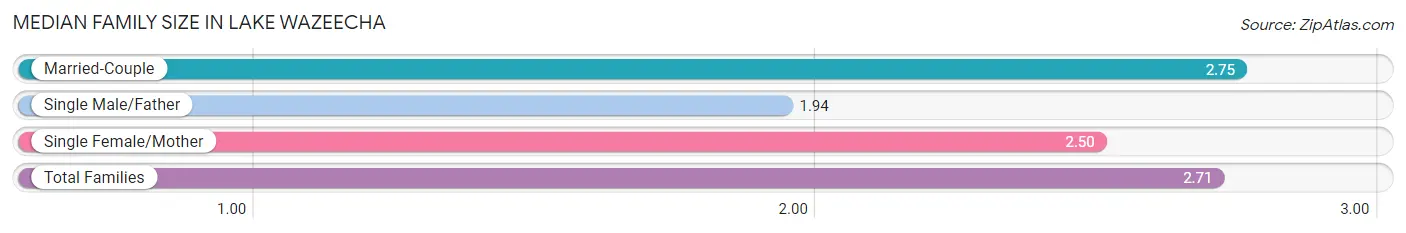
The median family size in Lake Wazeecha is 2.71 persons per family, with married-couple families (747 | 89.7%) accounting for the largest median family size of 2.75 persons per family. On the other hand, single male/father families (18 | 2.2%) represent the smallest median family size with 1.94 persons per family.
| Family Type | # Families | Family Size |
| Married-Couple | 747 (89.7%) | 2.75 |
| Single Male/Father | 18 (2.2%) | 1.94 |
| Single Female/Mother | 68 (8.2%) | 2.50 |
| Total Families | 833 (100.0%) | 2.71 |
Median Household Size in Lake Wazeecha
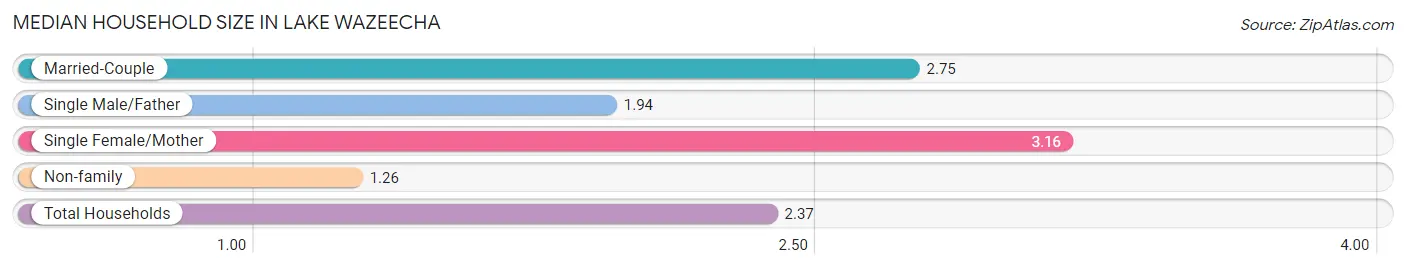
The median household size in Lake Wazeecha is 2.37 persons per household, with single female/mother households (68 | 6.0%) accounting for the largest median household size of 3.16 persons per household. non-family households (296 | 26.2%) represent the smallest median household size with 1.26 persons per household.
| Household Type | # Households | Household Size |
| Married-Couple | 747 (66.2%) | 2.75 |
| Single Male/Father | 18 (1.6%) | 1.94 |
| Single Female/Mother | 68 (6.0%) | 3.16 |
| Non-family | 296 (26.2%) | 1.26 |
| Total Households | 1,129 (100.0%) | 2.37 |
Household Size by Marriage Status in Lake Wazeecha
Out of a total of 1,129 households in Lake Wazeecha, 833 (73.8%) are family households, while 296 (26.2%) are nonfamily households. The most numerous type of family households are 2-person households, comprising 548, and the most common type of nonfamily households are 1-person households, comprising 252.
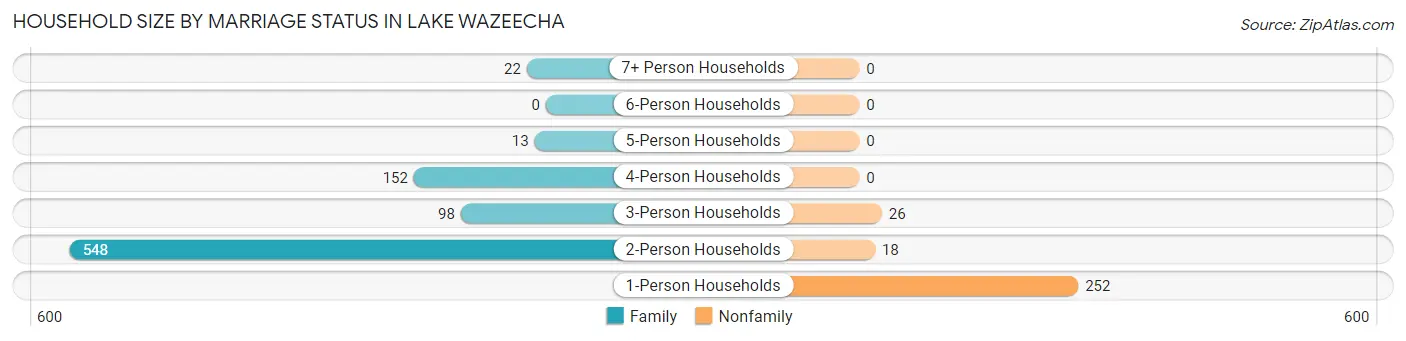
| Household Size | Family Households | Nonfamily Households |
| 1-Person Households | - | 252 (22.3%) |
| 2-Person Households | 548 (48.5%) | 18 (1.6%) |
| 3-Person Households | 98 (8.7%) | 26 (2.3%) |
| 4-Person Households | 152 (13.5%) | 0 (0.0%) |
| 5-Person Households | 13 (1.1%) | 0 (0.0%) |
| 6-Person Households | 0 (0.0%) | 0 (0.0%) |
| 7+ Person Households | 22 (1.9%) | 0 (0.0%) |
| Total | 833 (73.8%) | 296 (26.2%) |
Female Fertility in Lake Wazeecha
Fertility by Age in Lake Wazeecha
Average fertility rate in Lake Wazeecha is 124.0 births per 1,000 women. Women in the age bracket of 35 to 50 years have the highest fertility rate with 198.0 births per 1,000 women. Women in the age bracket of 35 to 50 years acount for 84.3% of all women with births.
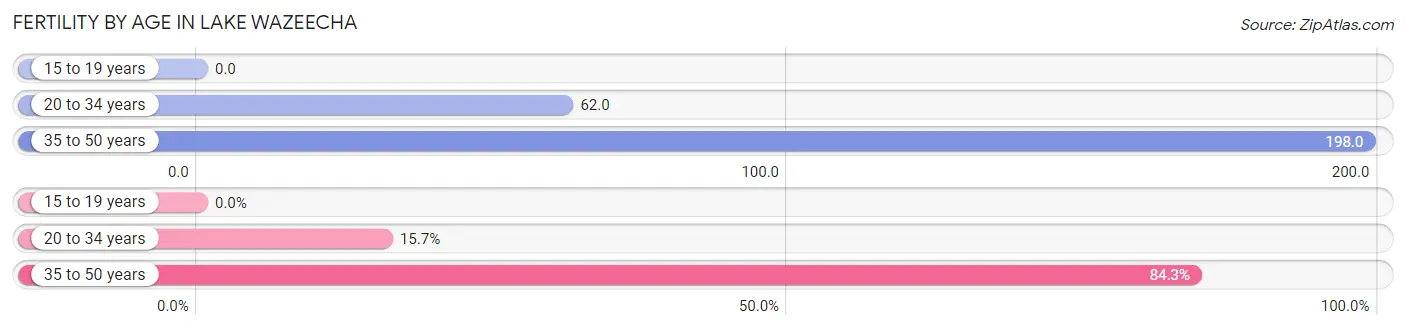
| Age Bracket | Women with Births | Births / 1,000 Women |
| 15 to 19 years | 0 (0.0%) | 0.0 |
| 20 to 34 years | 8 (15.7%) | 62.0 |
| 35 to 50 years | 43 (84.3%) | 198.0 |
| Total | 51 (100.0%) | 124.0 |
Fertility by Age by Marriage Status in Lake Wazeecha
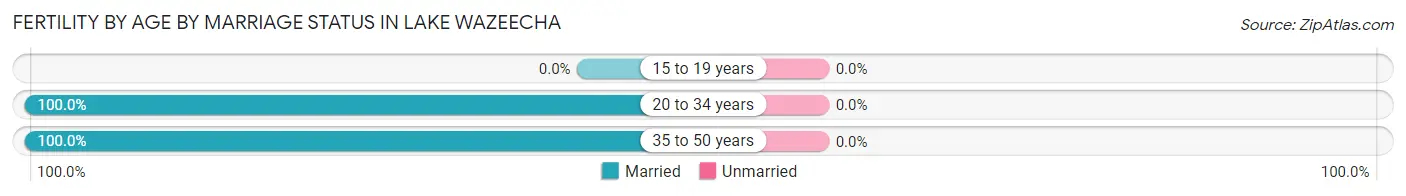
| Age Bracket | Married | Unmarried |
| 15 to 19 years | 0 (0.0%) | 0 (0.0%) |
| 20 to 34 years | 8 (100.0%) | 0 (0.0%) |
| 35 to 50 years | 43 (100.0%) | 0 (0.0%) |
| Total | 51 (100.0%) | 0 (0.0%) |
Fertility by Education in Lake Wazeecha
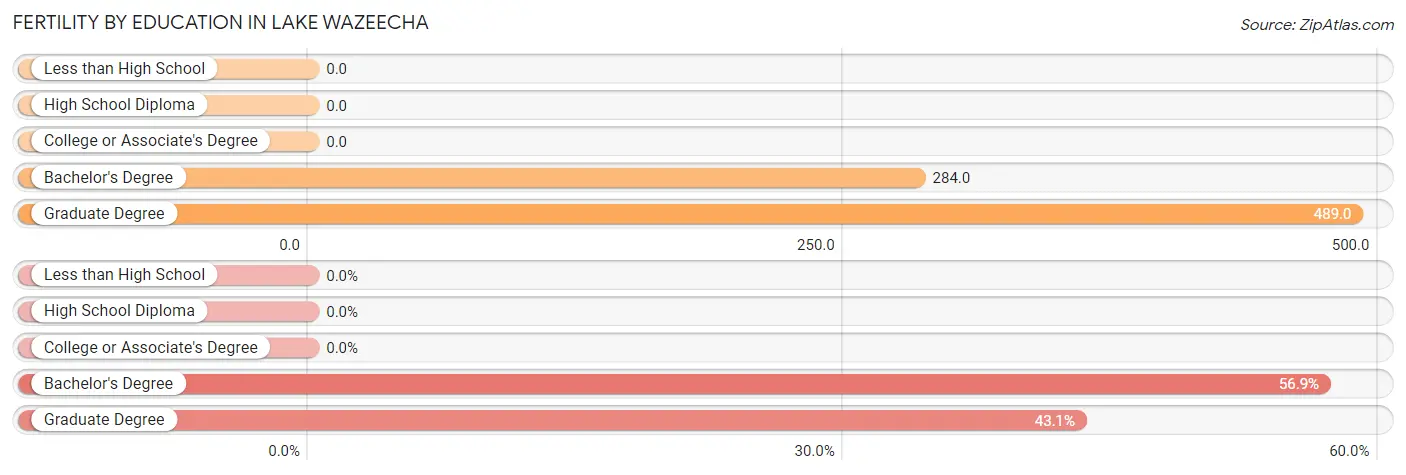
| Educational Attainment | Women with Births | Births / 1,000 Women |
| Less than High School | 0 (0.0%) | 0.0 |
| High School Diploma | 0 (0.0%) | 0.0 |
| College or Associate's Degree | 0 (0.0%) | 0.0 |
| Bachelor's Degree | 29 (56.9%) | 284.0 |
| Graduate Degree | 22 (43.1%) | 489.0 |
| Total | 51 (100.0%) | 124.0 |
Fertility by Education by Marriage Status in Lake Wazeecha
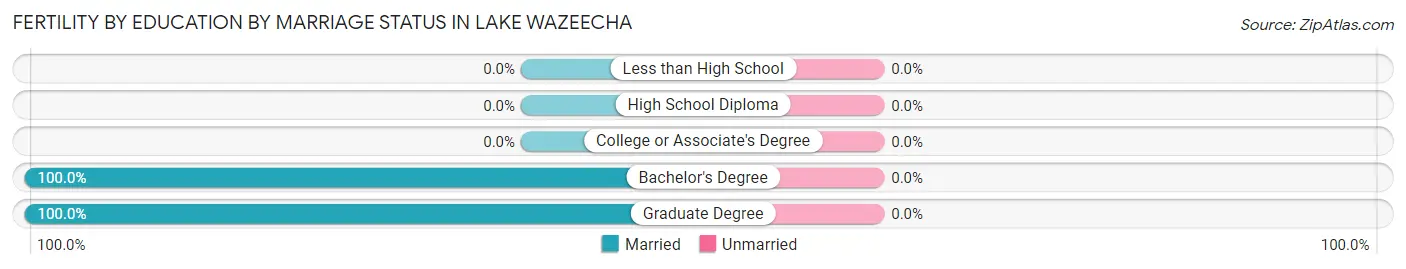
| Educational Attainment | Married | Unmarried |
| Less than High School | 0 (0.0%) | 0 (0.0%) |
| High School Diploma | 0 (0.0%) | 0 (0.0%) |
| College or Associate's Degree | 0 (0.0%) | 0 (0.0%) |
| Bachelor's Degree | 29 (100.0%) | 0 (0.0%) |
| Graduate Degree | 22 (100.0%) | 0 (0.0%) |
| Total | 51 (100.0%) | 0 (0.0%) |
Employment Characteristics in Lake Wazeecha
Employment by Class of Employer in Lake Wazeecha
Among the 1,154 employed individuals in Lake Wazeecha, private company employees (736 | 63.8%), local government employees (166 | 14.4%), and self-employed (not incorporated) (84 | 7.3%) make up the most common classes of employment.
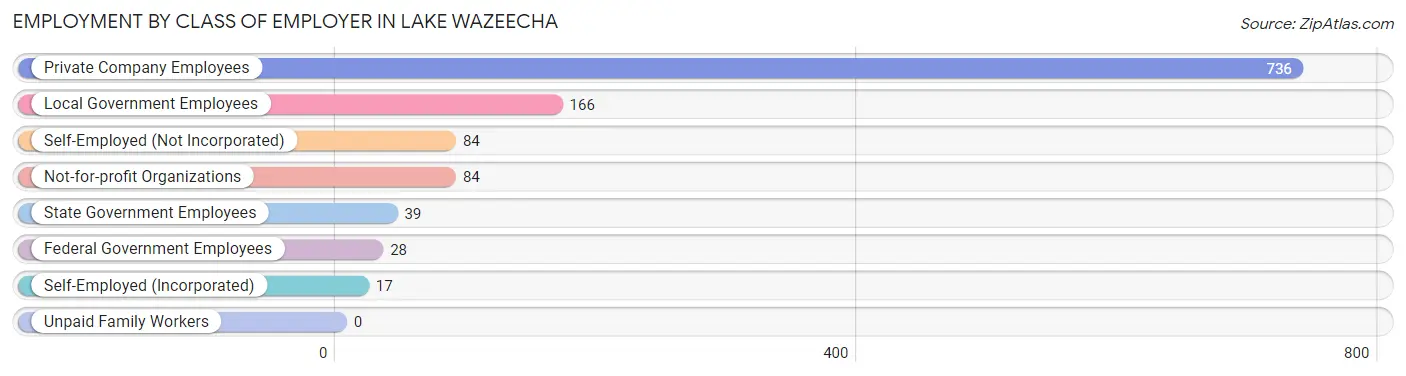
| Employer Class | # Employees | % Employees |
| Private Company Employees | 736 | 63.8% |
| Self-Employed (Incorporated) | 17 | 1.5% |
| Self-Employed (Not Incorporated) | 84 | 7.3% |
| Not-for-profit Organizations | 84 | 7.3% |
| Local Government Employees | 166 | 14.4% |
| State Government Employees | 39 | 3.4% |
| Federal Government Employees | 28 | 2.4% |
| Unpaid Family Workers | 0 | 0.0% |
| Total | 1,154 | 100.0% |
Employment Status by Age in Lake Wazeecha
According to the labor force statistics for Lake Wazeecha, out of the total population over 16 years of age (2,248), 54.1% or 1,216 individuals are in the labor force, with 2.6% or 32 of them unemployed. The age group with the highest labor force participation rate is 20 to 24 years, with 98.7% or 78 individuals in the labor force. Within the labor force, the 25 to 29 years age range has the highest percentage of unemployed individuals, with 29.4% or 32 of them being unemployed.
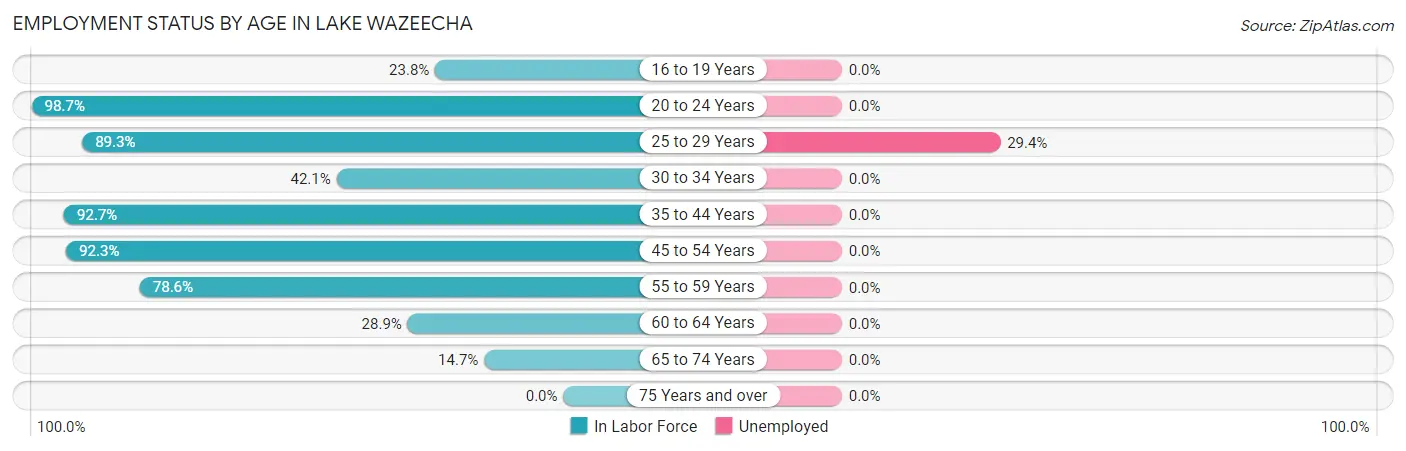
| Age Bracket | In Labor Force | Unemployed |
| 16 to 19 Years | 15 (23.8%) | 0 (0.0%) |
| 20 to 24 Years | 78 (98.7%) | 0 (0.0%) |
| 25 to 29 Years | 109 (89.3%) | 32 (29.4%) |
| 30 to 34 Years | 45 (42.1%) | 0 (0.0%) |
| 35 to 44 Years | 227 (92.7%) | 0 (0.0%) |
| 45 to 54 Years | 361 (92.3%) | 0 (0.0%) |
| 55 to 59 Years | 231 (78.6%) | 0 (0.0%) |
| 60 to 64 Years | 76 (28.9%) | 0 (0.0%) |
| 65 to 74 Years | 74 (14.7%) | 0 (0.0%) |
| 75 Years and over | 0 (0.0%) | 0 (0.0%) |
| Total | 1,216 (54.1%) | 32 (2.6%) |
Employment Status by Educational Attainment in Lake Wazeecha
According to labor force statistics for Lake Wazeecha, 73.8% of individuals (1,049) out of the total population between 25 and 64 years of age (1,422) are in the labor force, with 3.1% or 33 of them being unemployed. The group with the highest labor force participation rate are those with the educational attainment of less than high school, with 95.2% or 20 individuals in the labor force. Within the labor force, individuals with high school diploma education have the highest percentage of unemployment, with 9.2% or 32 of them being unemployed.
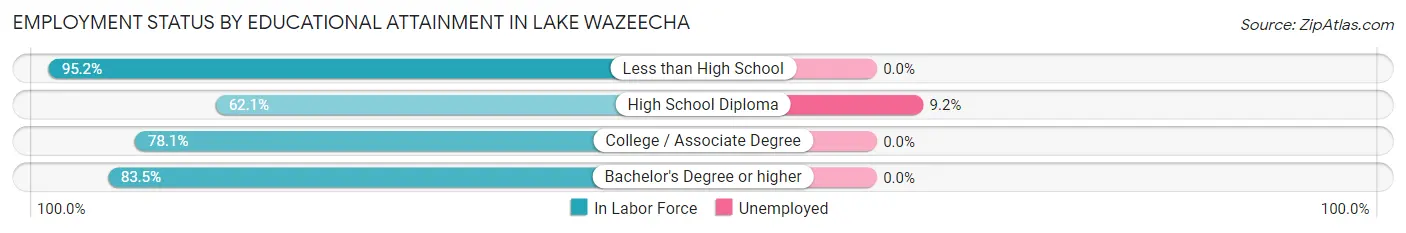
| Educational Attainment | In Labor Force | Unemployed |
| Less than High School | 20 (95.2%) | 0 (0.0%) |
| High School Diploma | 347 (62.1%) | 51 (9.2%) |
| College / Associate Degree | 303 (78.1%) | 0 (0.0%) |
| Bachelor's Degree or higher | 379 (83.5%) | 0 (0.0%) |
| Total | 1,049 (73.8%) | 44 (3.1%) |
Employment Occupations by Sex in Lake Wazeecha
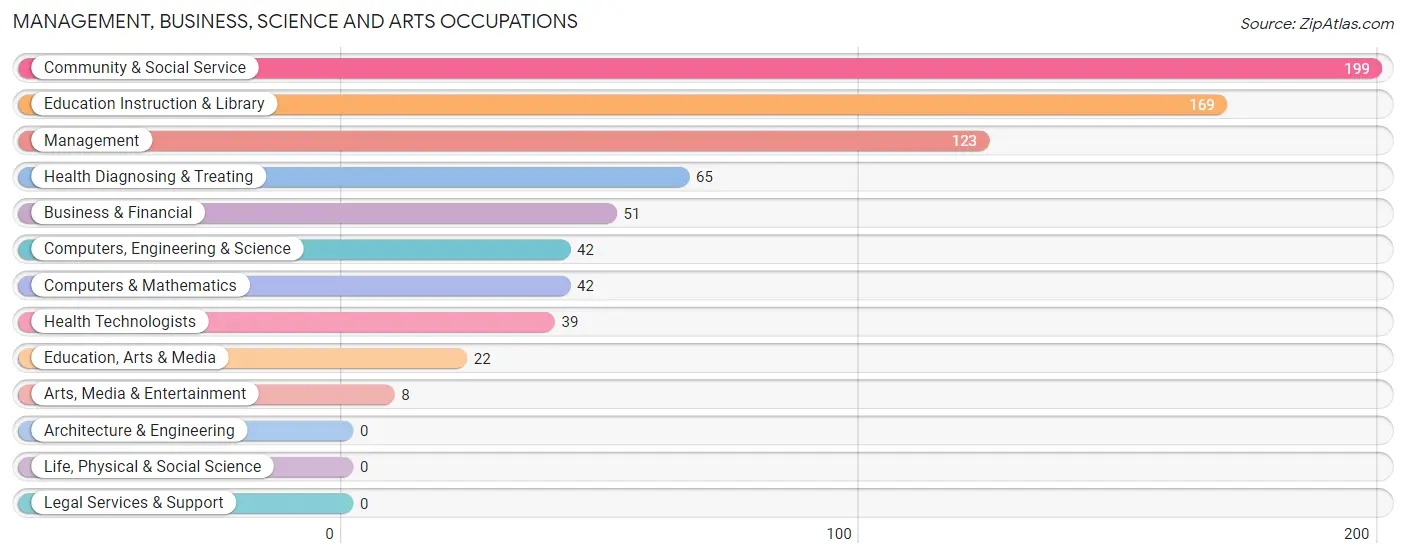
Management, Business, Science and Arts Occupations
The most common Management, Business, Science and Arts occupations in Lake Wazeecha are Community & Social Service (199 | 16.8%), Education Instruction & Library (169 | 14.3%), Management (123 | 10.4%), Health Diagnosing & Treating (65 | 5.5%), and Business & Financial (51 | 4.3%).
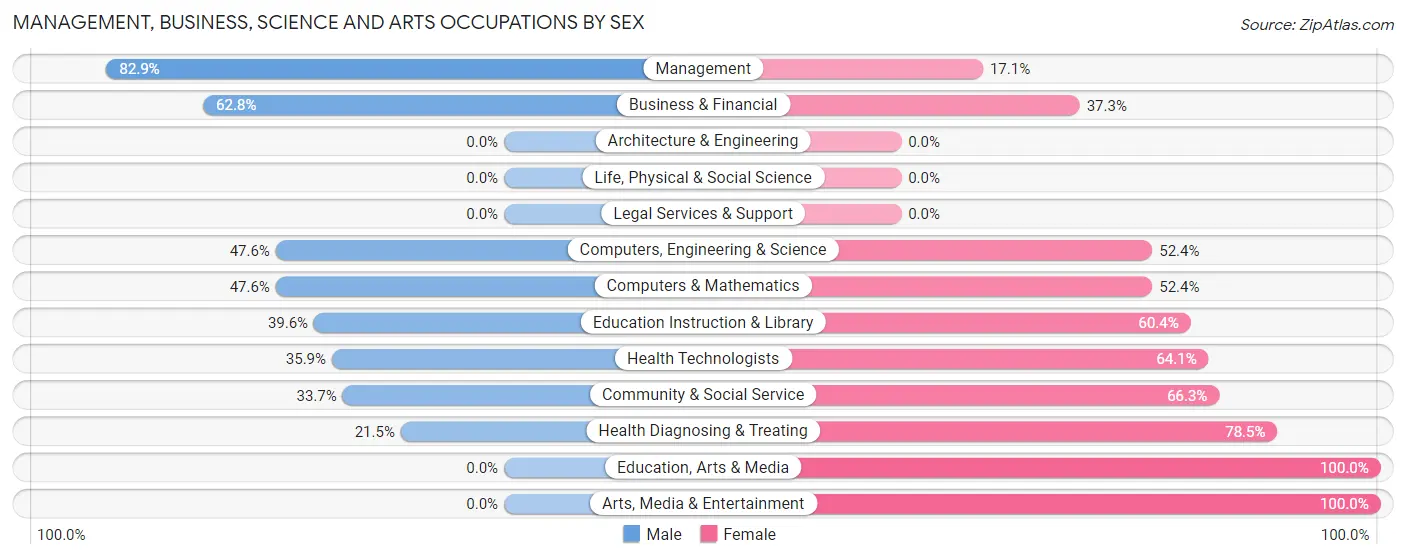
Management, Business, Science and Arts Occupations by Sex
Within the Management, Business, Science and Arts occupations in Lake Wazeecha, the most male-oriented occupations are Management (82.9%), Business & Financial (62.7%), and Computers, Engineering & Science (47.6%), while the most female-oriented occupations are Education, Arts & Media (100.0%), Arts, Media & Entertainment (100.0%), and Health Diagnosing & Treating (78.5%).
| Occupation | Male | Female |
| Management | 102 (82.9%) | 21 (17.1%) |
| Business & Financial | 32 (62.7%) | 19 (37.2%) |
| Computers, Engineering & Science | 20 (47.6%) | 22 (52.4%) |
| Computers & Mathematics | 20 (47.6%) | 22 (52.4%) |
| Architecture & Engineering | 0 (0.0%) | 0 (0.0%) |
| Life, Physical & Social Science | 0 (0.0%) | 0 (0.0%) |
| Community & Social Service | 67 (33.7%) | 132 (66.3%) |
| Education, Arts & Media | 0 (0.0%) | 22 (100.0%) |
| Legal Services & Support | 0 (0.0%) | 0 (0.0%) |
| Education Instruction & Library | 67 (39.6%) | 102 (60.4%) |
| Arts, Media & Entertainment | 0 (0.0%) | 8 (100.0%) |
| Health Diagnosing & Treating | 14 (21.5%) | 51 (78.5%) |
| Health Technologists | 14 (35.9%) | 25 (64.1%) |
| Total (Category) | 235 (49.0%) | 245 (51.0%) |
| Total (Overall) | 655 (55.3%) | 529 (44.7%) |
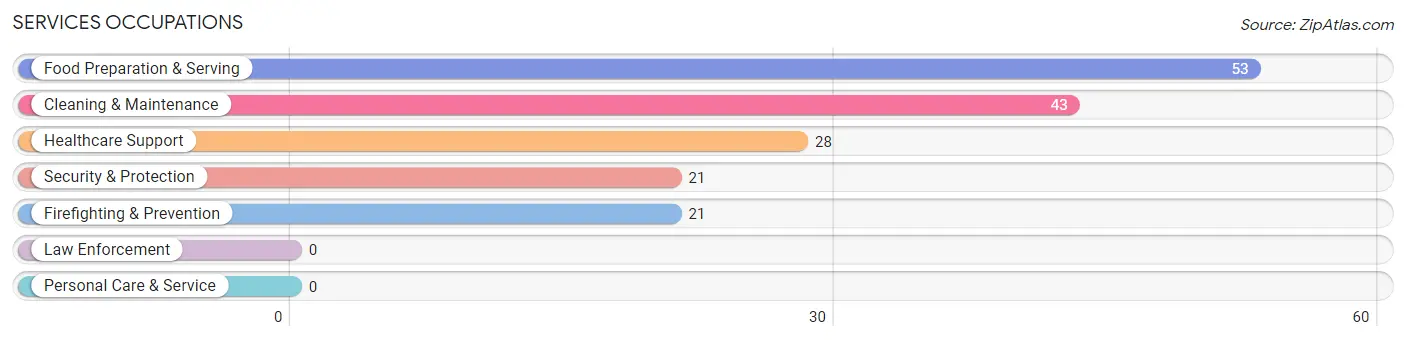
Services Occupations
The most common Services occupations in Lake Wazeecha are Food Preparation & Serving (53 | 4.5%), Cleaning & Maintenance (43 | 3.6%), Healthcare Support (28 | 2.4%), Security & Protection (21 | 1.8%), and Firefighting & Prevention (21 | 1.8%).
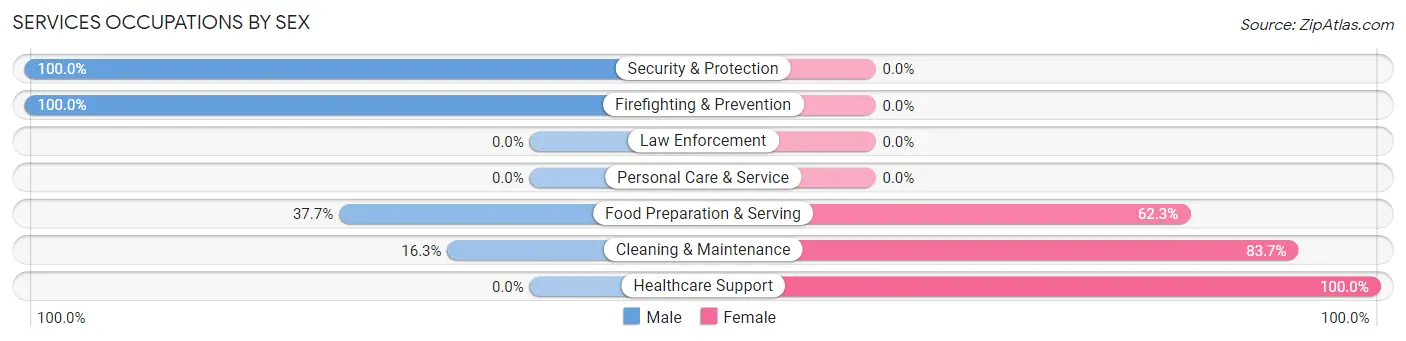
Services Occupations by Sex
Within the Services occupations in Lake Wazeecha, the most male-oriented occupations are Security & Protection (100.0%), Firefighting & Prevention (100.0%), and Food Preparation & Serving (37.7%), while the most female-oriented occupations are Healthcare Support (100.0%), Cleaning & Maintenance (83.7%), and Food Preparation & Serving (62.3%).
| Occupation | Male | Female |
| Healthcare Support | 0 (0.0%) | 28 (100.0%) |
| Security & Protection | 21 (100.0%) | 0 (0.0%) |
| Firefighting & Prevention | 21 (100.0%) | 0 (0.0%) |
| Law Enforcement | 0 (0.0%) | 0 (0.0%) |
| Food Preparation & Serving | 20 (37.7%) | 33 (62.3%) |
| Cleaning & Maintenance | 7 (16.3%) | 36 (83.7%) |
| Personal Care & Service | 0 (0.0%) | 0 (0.0%) |
| Total (Category) | 48 (33.1%) | 97 (66.9%) |
| Total (Overall) | 655 (55.3%) | 529 (44.7%) |
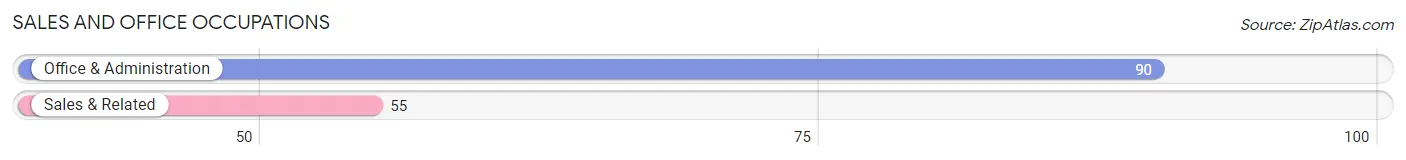
Sales and Office Occupations
The most common Sales and Office occupations in Lake Wazeecha are Office & Administration (90 | 7.6%), and Sales & Related (55 | 4.6%).
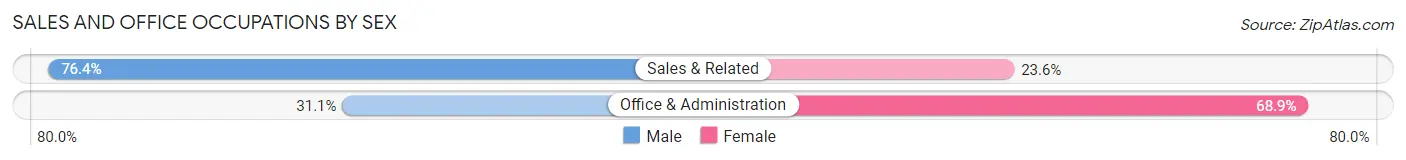
Sales and Office Occupations by Sex
| Occupation | Male | Female |
| Sales & Related | 42 (76.4%) | 13 (23.6%) |
| Office & Administration | 28 (31.1%) | 62 (68.9%) |
| Total (Category) | 70 (48.3%) | 75 (51.7%) |
| Total (Overall) | 655 (55.3%) | 529 (44.7%) |
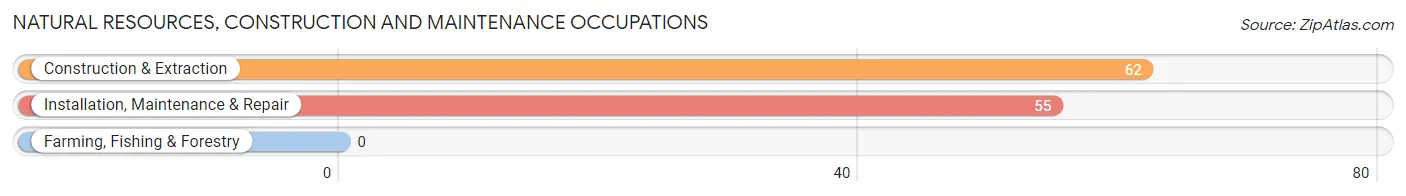
Natural Resources, Construction and Maintenance Occupations
The most common Natural Resources, Construction and Maintenance occupations in Lake Wazeecha are Construction & Extraction (62 | 5.2%), and Installation, Maintenance & Repair (55 | 4.6%).
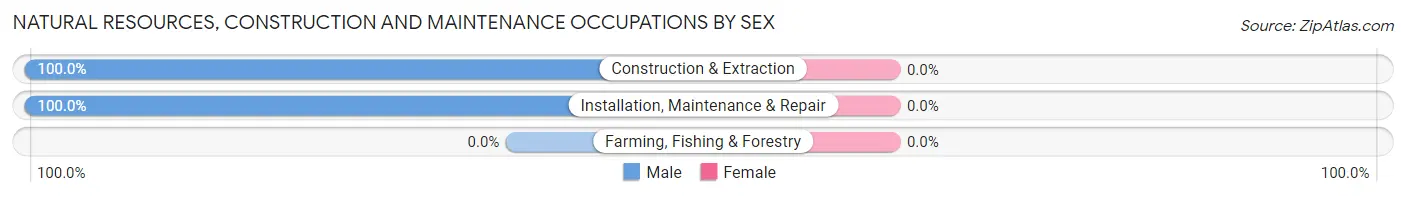
Natural Resources, Construction and Maintenance Occupations by Sex
| Occupation | Male | Female |
| Farming, Fishing & Forestry | 0 (0.0%) | 0 (0.0%) |
| Construction & Extraction | 62 (100.0%) | 0 (0.0%) |
| Installation, Maintenance & Repair | 55 (100.0%) | 0 (0.0%) |
| Total (Category) | 117 (100.0%) | 0 (0.0%) |
| Total (Overall) | 655 (55.3%) | 529 (44.7%) |
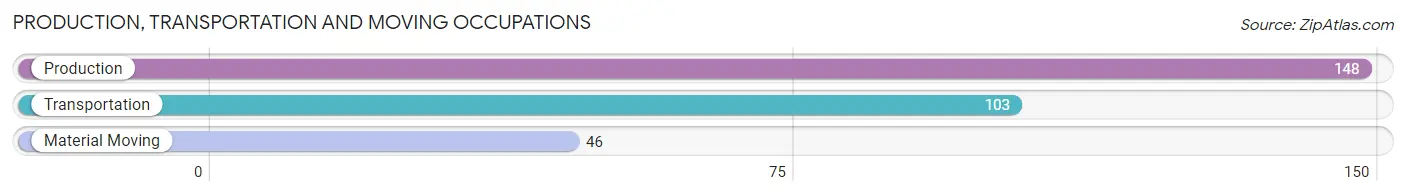
Production, Transportation and Moving Occupations
The most common Production, Transportation and Moving occupations in Lake Wazeecha are Production (148 | 12.5%), Transportation (103 | 8.7%), and Material Moving (46 | 3.9%).
Production, Transportation and Moving Occupations by Sex
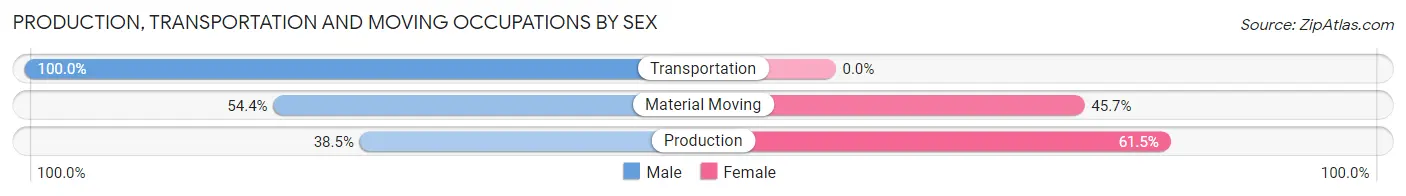
| Occupation | Male | Female |
| Production | 57 (38.5%) | 91 (61.5%) |
| Transportation | 103 (100.0%) | 0 (0.0%) |
| Material Moving | 25 (54.3%) | 21 (45.7%) |
| Total (Category) | 185 (62.3%) | 112 (37.7%) |
| Total (Overall) | 655 (55.3%) | 529 (44.7%) |
Employment Industries by Sex in Lake Wazeecha
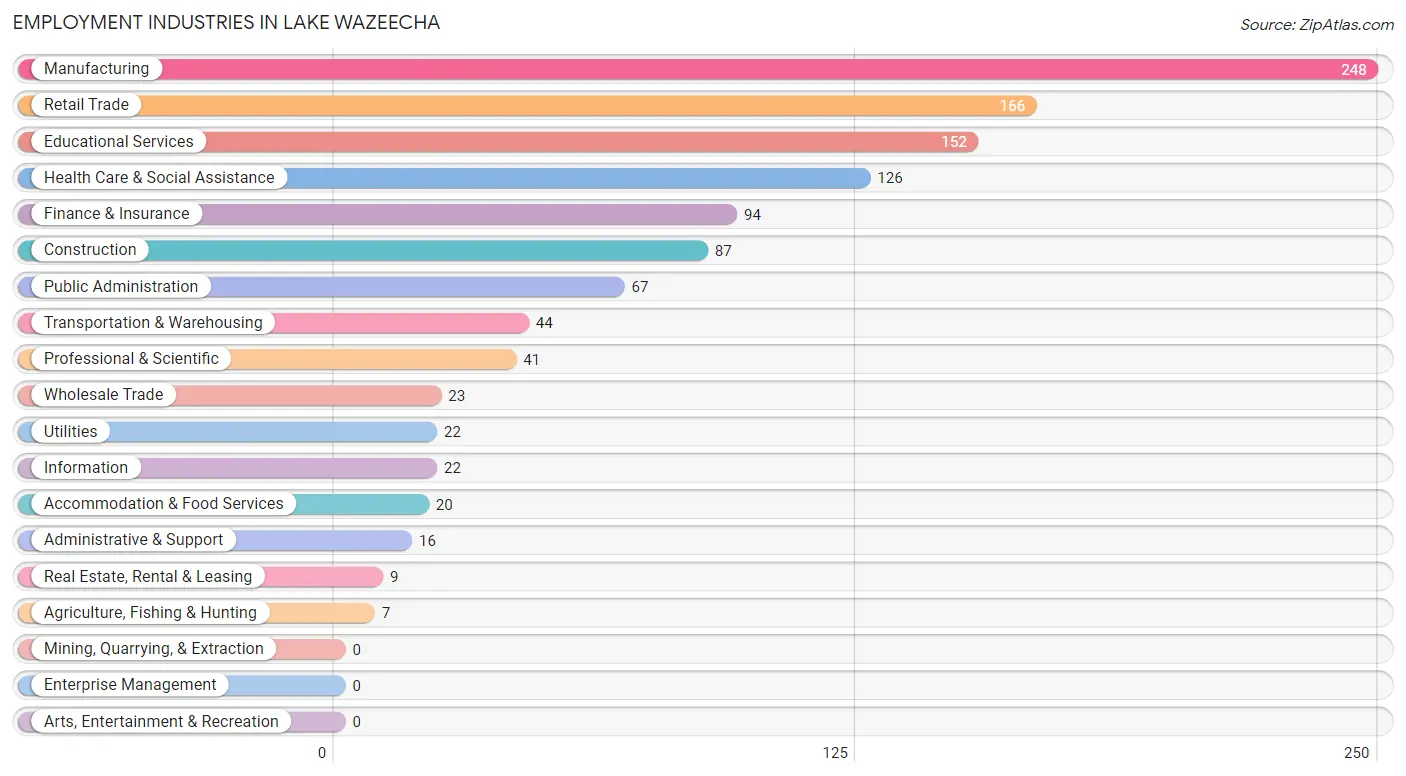
Employment Industries in Lake Wazeecha
The major employment industries in Lake Wazeecha include Manufacturing (248 | 20.9%), Retail Trade (166 | 14.0%), Educational Services (152 | 12.8%), Health Care & Social Assistance (126 | 10.6%), and Finance & Insurance (94 | 7.9%).
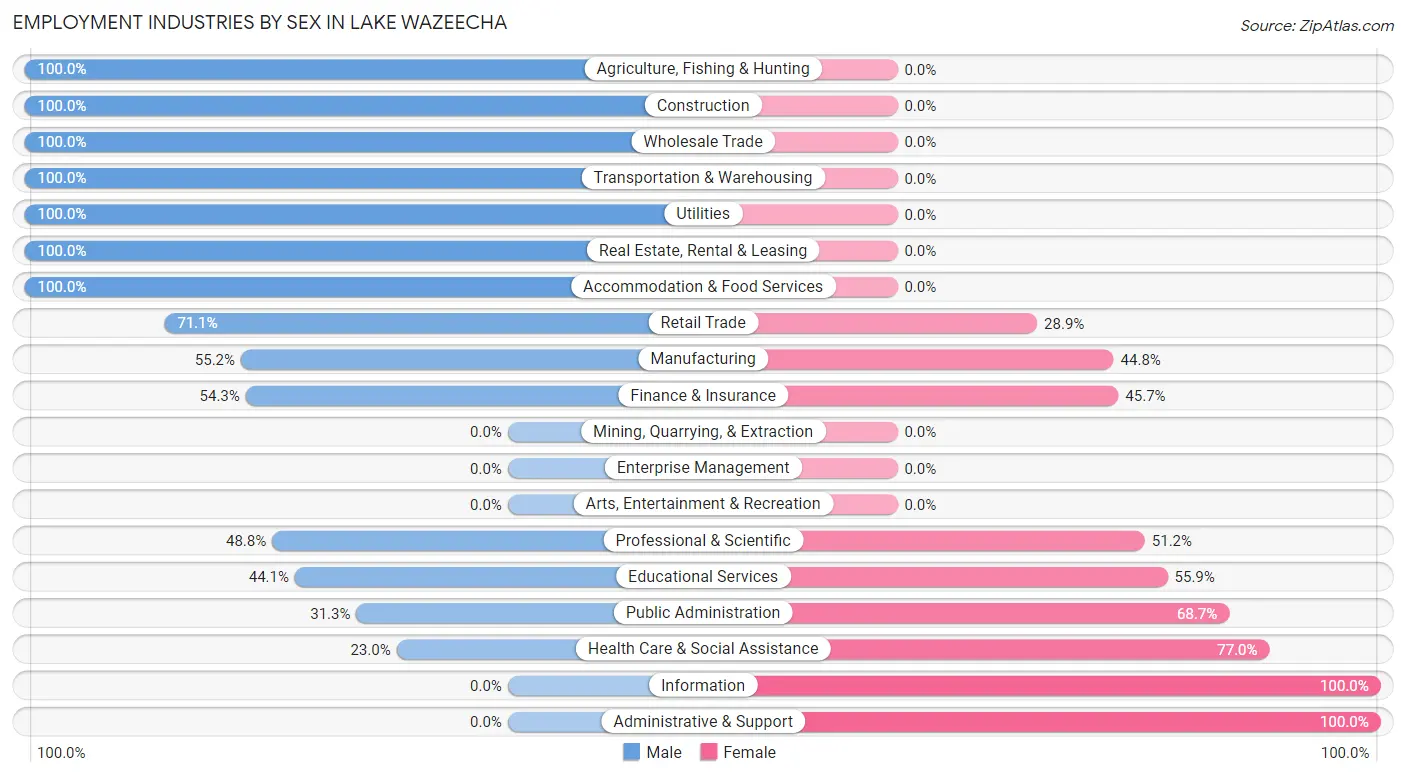
Employment Industries by Sex in Lake Wazeecha
The Lake Wazeecha industries that see more men than women are Agriculture, Fishing & Hunting (100.0%), Construction (100.0%), and Wholesale Trade (100.0%), whereas the industries that tend to have a higher number of women are Information (100.0%), Administrative & Support (100.0%), and Health Care & Social Assistance (77.0%).
| Industry | Male | Female |
| Agriculture, Fishing & Hunting | 7 (100.0%) | 0 (0.0%) |
| Mining, Quarrying, & Extraction | 0 (0.0%) | 0 (0.0%) |
| Construction | 87 (100.0%) | 0 (0.0%) |
| Manufacturing | 137 (55.2%) | 111 (44.8%) |
| Wholesale Trade | 23 (100.0%) | 0 (0.0%) |
| Retail Trade | 118 (71.1%) | 48 (28.9%) |
| Transportation & Warehousing | 44 (100.0%) | 0 (0.0%) |
| Utilities | 22 (100.0%) | 0 (0.0%) |
| Information | 0 (0.0%) | 22 (100.0%) |
| Finance & Insurance | 51 (54.3%) | 43 (45.7%) |
| Real Estate, Rental & Leasing | 9 (100.0%) | 0 (0.0%) |
| Professional & Scientific | 20 (48.8%) | 21 (51.2%) |
| Enterprise Management | 0 (0.0%) | 0 (0.0%) |
| Administrative & Support | 0 (0.0%) | 16 (100.0%) |
| Educational Services | 67 (44.1%) | 85 (55.9%) |
| Health Care & Social Assistance | 29 (23.0%) | 97 (77.0%) |
| Arts, Entertainment & Recreation | 0 (0.0%) | 0 (0.0%) |
| Accommodation & Food Services | 20 (100.0%) | 0 (0.0%) |
| Public Administration | 21 (31.3%) | 46 (68.7%) |
| Total | 655 (55.3%) | 529 (44.7%) |
Education in Lake Wazeecha
School Enrollment in Lake Wazeecha
The most common levels of schooling among the 423 students in Lake Wazeecha are elementary school (219 | 51.8%), high school (92 | 21.7%), and middle school (43 | 10.2%).
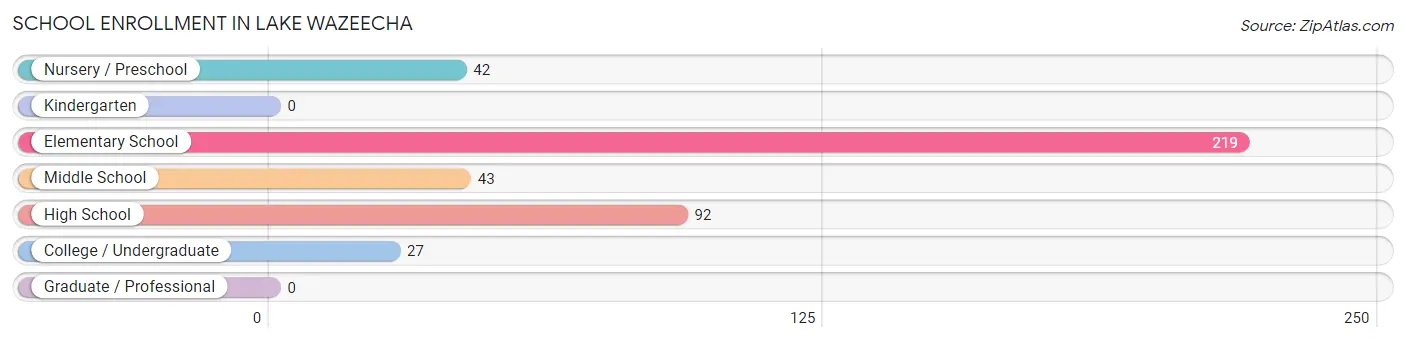
| School Level | # Students | % Students |
| Nursery / Preschool | 42 | 9.9% |
| Kindergarten | 0 | 0.0% |
| Elementary School | 219 | 51.8% |
| Middle School | 43 | 10.2% |
| High School | 92 | 21.7% |
| College / Undergraduate | 27 | 6.4% |
| Graduate / Professional | 0 | 0.0% |
| Total | 423 | 100.0% |
School Enrollment by Age by Funding Source in Lake Wazeecha
Out of a total of 423 students who are enrolled in schools in Lake Wazeecha, 23 (5.4%) attend a private institution, while the remaining 400 (94.6%) are enrolled in public schools. The age group of 5 to 9 year old has the highest likelihood of being enrolled in private schools, with 23 (13.3% in the age bracket) enrolled. Conversely, the age group of 3 to 4 year olds has the lowest likelihood of being enrolled in a private school, with 21 (100.0% in the age bracket) attending a public institution.
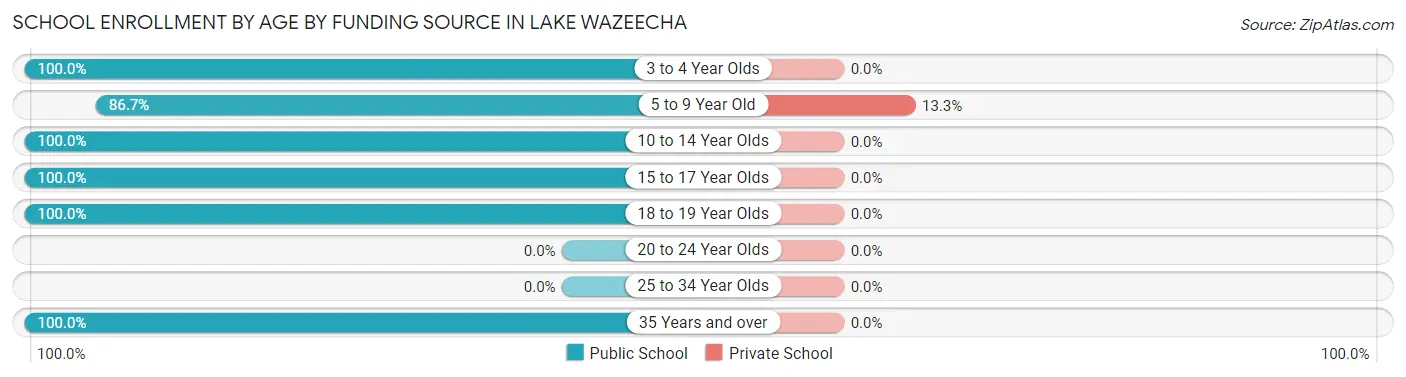
| Age Bracket | Public School | Private School |
| 3 to 4 Year Olds | 21 (100.0%) | 0 (0.0%) |
| 5 to 9 Year Old | 150 (86.7%) | 23 (13.3%) |
| 10 to 14 Year Olds | 110 (100.0%) | 0 (0.0%) |
| 15 to 17 Year Olds | 79 (100.0%) | 0 (0.0%) |
| 18 to 19 Year Olds | 26 (100.0%) | 0 (0.0%) |
| 20 to 24 Year Olds | 0 (0.0%) | 0 (0.0%) |
| 25 to 34 Year Olds | 0 (0.0%) | 0 (0.0%) |
| 35 Years and over | 14 (100.0%) | 0 (0.0%) |
| Total | 400 (94.6%) | 23 (5.4%) |
Educational Attainment by Field of Study in Lake Wazeecha
Education (166 | 28.1%), business (117 | 19.8%), arts & humanities (81 | 13.7%), bio, nature & agricultural (70 | 11.9%), and science & technology (68 | 11.5%) are the most common fields of study among 590 individuals in Lake Wazeecha who have obtained a bachelor's degree or higher.
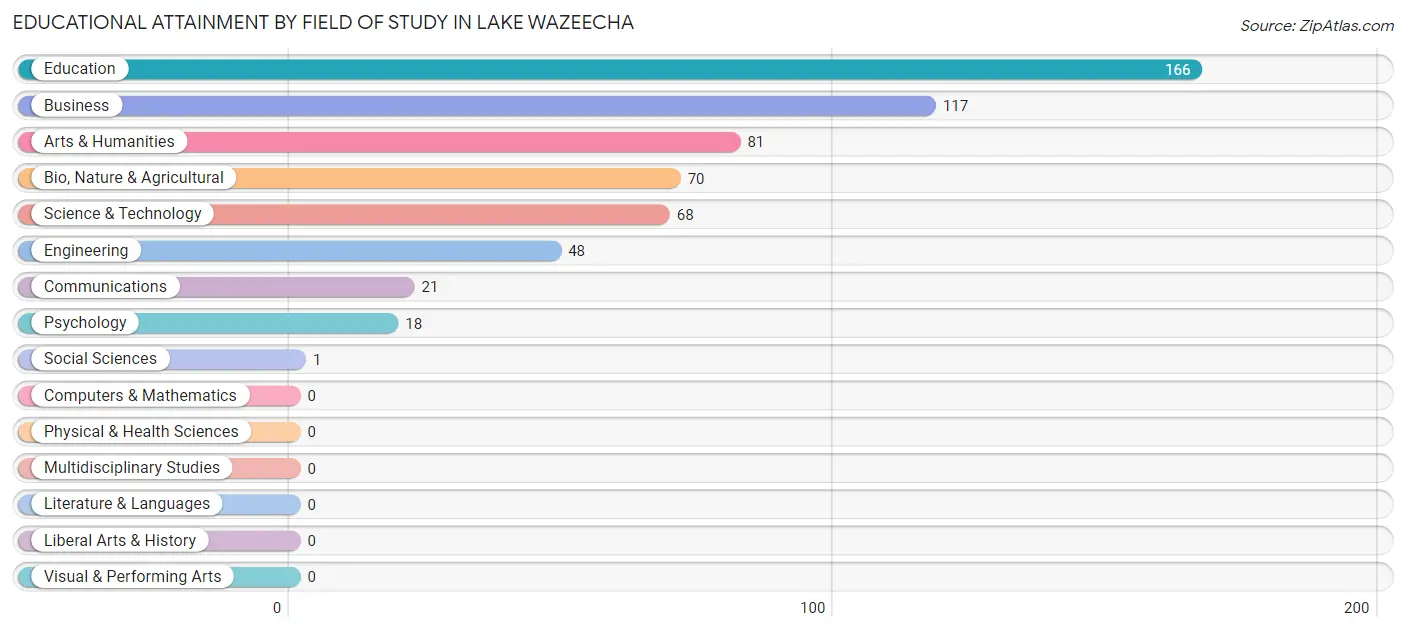
| Field of Study | # Graduates | % Graduates |
| Computers & Mathematics | 0 | 0.0% |
| Bio, Nature & Agricultural | 70 | 11.9% |
| Physical & Health Sciences | 0 | 0.0% |
| Psychology | 18 | 3.0% |
| Social Sciences | 1 | 0.2% |
| Engineering | 48 | 8.1% |
| Multidisciplinary Studies | 0 | 0.0% |
| Science & Technology | 68 | 11.5% |
| Business | 117 | 19.8% |
| Education | 166 | 28.1% |
| Literature & Languages | 0 | 0.0% |
| Liberal Arts & History | 0 | 0.0% |
| Visual & Performing Arts | 0 | 0.0% |
| Communications | 21 | 3.6% |
| Arts & Humanities | 81 | 13.7% |
| Total | 590 | 100.0% |
Transportation & Commute in Lake Wazeecha
Vehicle Availability by Sex in Lake Wazeecha
The most prevalent vehicle ownership categories in Lake Wazeecha are males with 2 vehicles (335, accounting for 51.5%) and females with 2 vehicles (219, making up 67.1%).
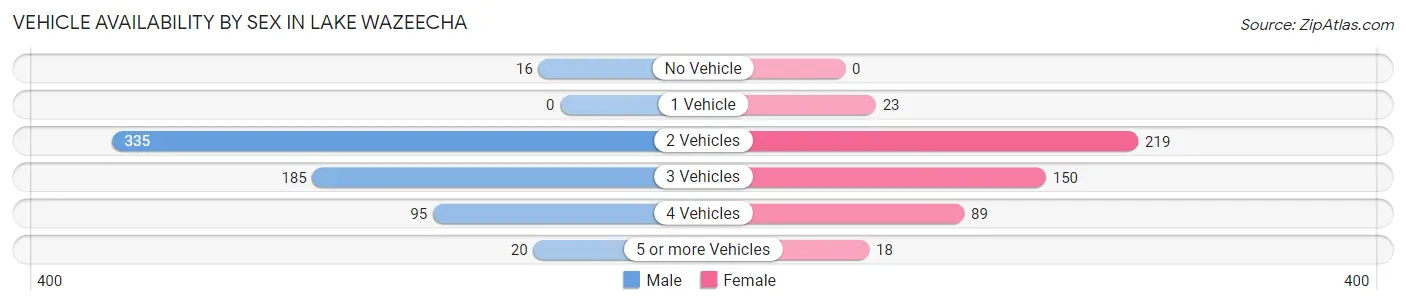
| Vehicles Available | Male | Female |
| No Vehicle | 16 (2.5%) | 0 (0.0%) |
| 1 Vehicle | 0 (0.0%) | 23 (4.6%) |
| 2 Vehicles | 335 (51.5%) | 219 (43.9%) |
| 3 Vehicles | 185 (28.4%) | 150 (30.1%) |
| 4 Vehicles | 95 (14.6%) | 89 (17.8%) |
| 5 or more Vehicles | 20 (3.1%) | 18 (3.6%) |
| Total | 651 (100.0%) | 499 (100.0%) |
Commute Time in Lake Wazeecha
The most frequently occuring commute durations in Lake Wazeecha are 10 to 14 minutes (289 commuters, 27.5%), 15 to 19 minutes (182 commuters, 17.3%), and 30 to 34 minutes (166 commuters, 15.8%).
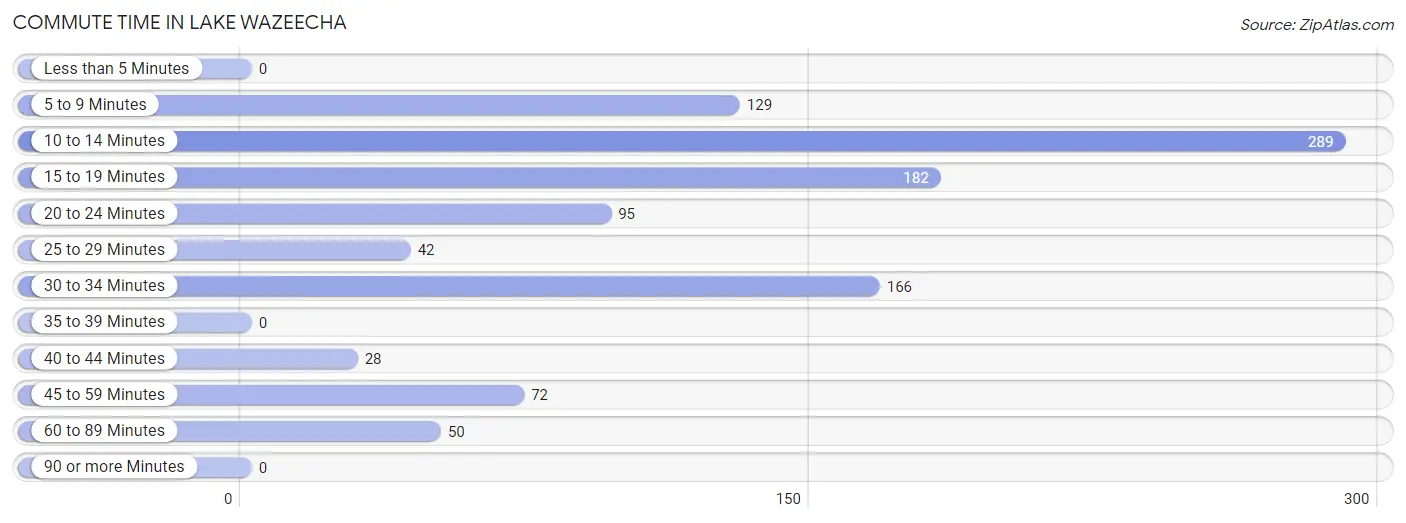
| Commute Time | # Commuters | % Commuters |
| Less than 5 Minutes | 0 | 0.0% |
| 5 to 9 Minutes | 129 | 12.2% |
| 10 to 14 Minutes | 289 | 27.5% |
| 15 to 19 Minutes | 182 | 17.3% |
| 20 to 24 Minutes | 95 | 9.0% |
| 25 to 29 Minutes | 42 | 4.0% |
| 30 to 34 Minutes | 166 | 15.8% |
| 35 to 39 Minutes | 0 | 0.0% |
| 40 to 44 Minutes | 28 | 2.7% |
| 45 to 59 Minutes | 72 | 6.8% |
| 60 to 89 Minutes | 50 | 4.8% |
| 90 or more Minutes | 0 | 0.0% |
Commute Time by Sex in Lake Wazeecha
The most common commute times in Lake Wazeecha are 10 to 14 minutes (178 commuters, 27.2%) for males and 10 to 14 minutes (111 commuters, 27.9%) for females.
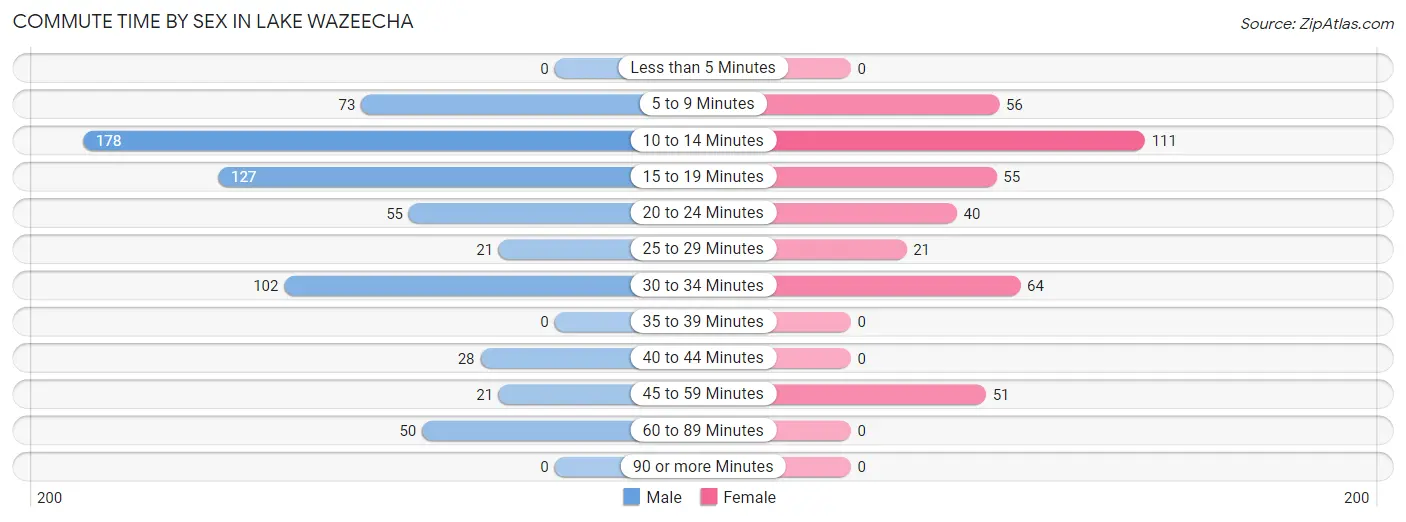
| Commute Time | Male | Female |
| Less than 5 Minutes | 0 (0.0%) | 0 (0.0%) |
| 5 to 9 Minutes | 73 (11.2%) | 56 (14.1%) |
| 10 to 14 Minutes | 178 (27.2%) | 111 (27.9%) |
| 15 to 19 Minutes | 127 (19.4%) | 55 (13.8%) |
| 20 to 24 Minutes | 55 (8.4%) | 40 (10.1%) |
| 25 to 29 Minutes | 21 (3.2%) | 21 (5.3%) |
| 30 to 34 Minutes | 102 (15.6%) | 64 (16.1%) |
| 35 to 39 Minutes | 0 (0.0%) | 0 (0.0%) |
| 40 to 44 Minutes | 28 (4.3%) | 0 (0.0%) |
| 45 to 59 Minutes | 21 (3.2%) | 51 (12.8%) |
| 60 to 89 Minutes | 50 (7.6%) | 0 (0.0%) |
| 90 or more Minutes | 0 (0.0%) | 0 (0.0%) |
Time of Departure to Work by Sex in Lake Wazeecha
The most frequent times of departure to work in Lake Wazeecha are 6:00 AM to 6:29 AM (116, 17.7%) for males and 5:30 AM to 5:59 AM (104, 26.1%) for females.
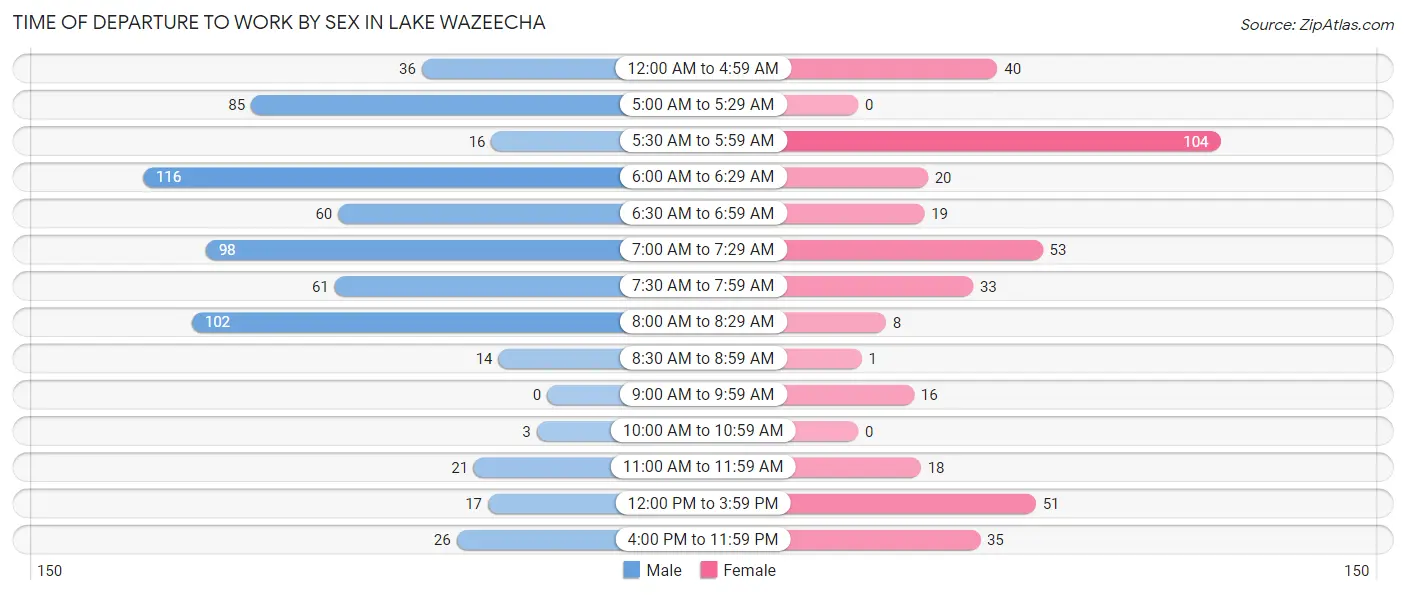
| Time of Departure | Male | Female |
| 12:00 AM to 4:59 AM | 36 (5.5%) | 40 (10.1%) |
| 5:00 AM to 5:29 AM | 85 (13.0%) | 0 (0.0%) |
| 5:30 AM to 5:59 AM | 16 (2.4%) | 104 (26.1%) |
| 6:00 AM to 6:29 AM | 116 (17.7%) | 20 (5.0%) |
| 6:30 AM to 6:59 AM | 60 (9.2%) | 19 (4.8%) |
| 7:00 AM to 7:29 AM | 98 (15.0%) | 53 (13.3%) |
| 7:30 AM to 7:59 AM | 61 (9.3%) | 33 (8.3%) |
| 8:00 AM to 8:29 AM | 102 (15.6%) | 8 (2.0%) |
| 8:30 AM to 8:59 AM | 14 (2.1%) | 1 (0.3%) |
| 9:00 AM to 9:59 AM | 0 (0.0%) | 16 (4.0%) |
| 10:00 AM to 10:59 AM | 3 (0.5%) | 0 (0.0%) |
| 11:00 AM to 11:59 AM | 21 (3.2%) | 18 (4.5%) |
| 12:00 PM to 3:59 PM | 17 (2.6%) | 51 (12.8%) |
| 4:00 PM to 11:59 PM | 26 (4.0%) | 35 (8.8%) |
| Total | 655 (100.0%) | 398 (100.0%) |
Housing Occupancy in Lake Wazeecha
Occupancy by Ownership in Lake Wazeecha
Of the total 1,129 dwellings in Lake Wazeecha, owner-occupied units account for 1,034 (91.6%), while renter-occupied units make up 95 (8.4%).
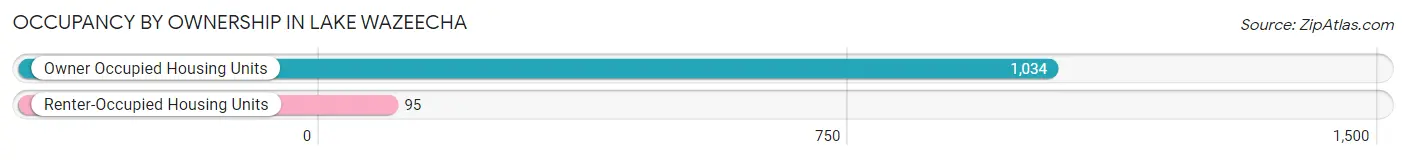
| Occupancy | # Housing Units | % Housing Units |
| Owner Occupied Housing Units | 1,034 | 91.6% |
| Renter-Occupied Housing Units | 95 | 8.4% |
| Total Occupied Housing Units | 1,129 | 100.0% |
Occupancy by Household Size in Lake Wazeecha
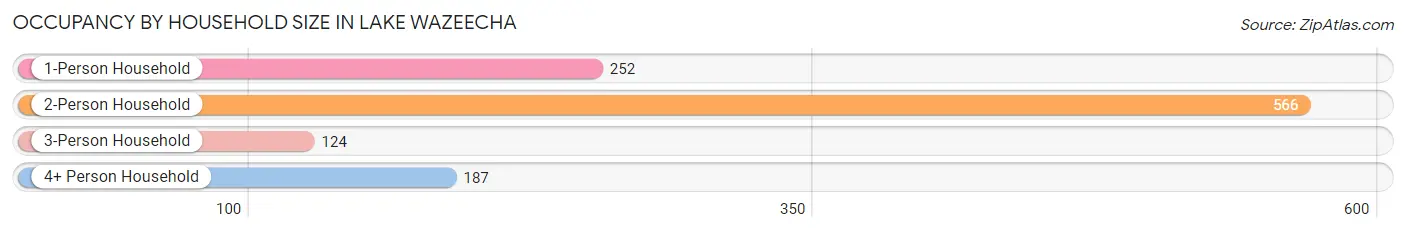
| Household Size | # Housing Units | % Housing Units |
| 1-Person Household | 252 | 22.3% |
| 2-Person Household | 566 | 50.1% |
| 3-Person Household | 124 | 11.0% |
| 4+ Person Household | 187 | 16.6% |
| Total Housing Units | 1,129 | 100.0% |
Occupancy by Ownership by Household Size in Lake Wazeecha
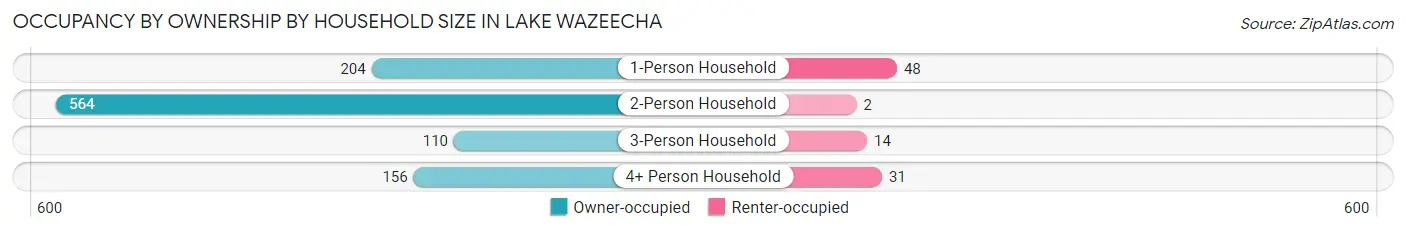
| Household Size | Owner-occupied | Renter-occupied |
| 1-Person Household | 204 (80.9%) | 48 (19.1%) |
| 2-Person Household | 564 (99.7%) | 2 (0.4%) |
| 3-Person Household | 110 (88.7%) | 14 (11.3%) |
| 4+ Person Household | 156 (83.4%) | 31 (16.6%) |
| Total Housing Units | 1,034 (91.6%) | 95 (8.4%) |
Occupancy by Educational Attainment in Lake Wazeecha
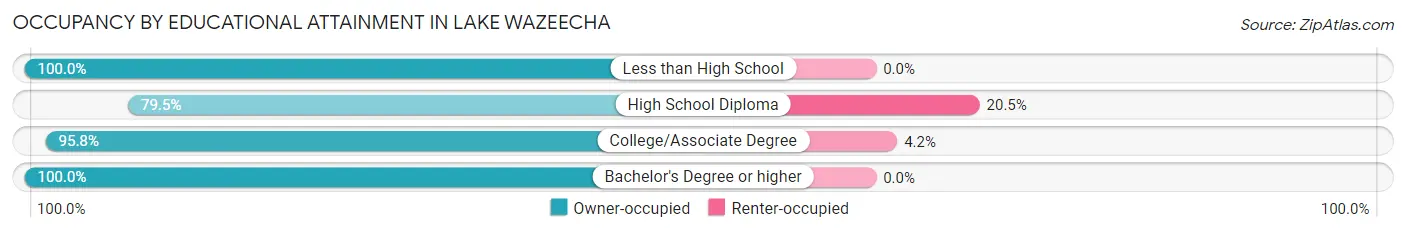
| Household Size | Owner-occupied | Renter-occupied |
| Less than High School | 30 (100.0%) | 0 (0.0%) |
| High School Diploma | 310 (79.5%) | 80 (20.5%) |
| College/Associate Degree | 345 (95.8%) | 15 (4.2%) |
| Bachelor's Degree or higher | 349 (100.0%) | 0 (0.0%) |
Occupancy by Age of Householder in Lake Wazeecha
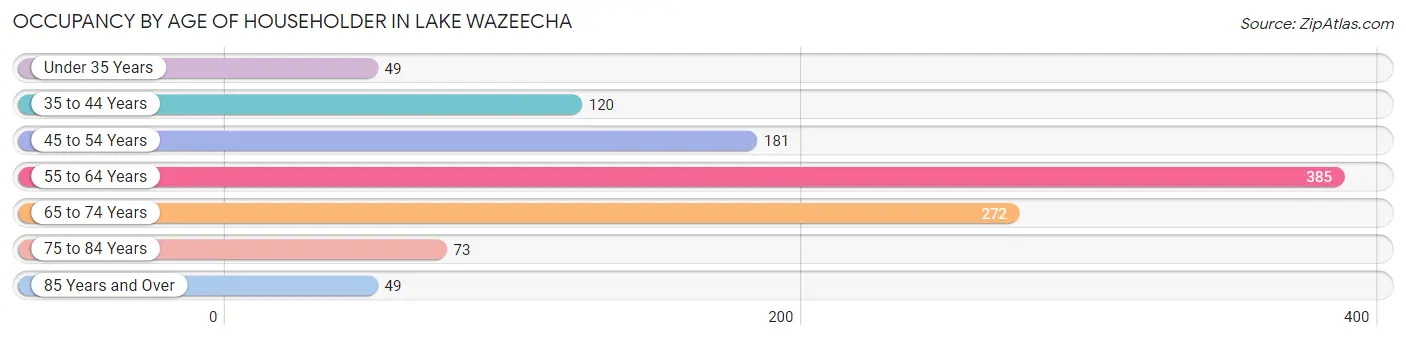
| Age Bracket | # Households | % Households |
| Under 35 Years | 49 | 4.3% |
| 35 to 44 Years | 120 | 10.6% |
| 45 to 54 Years | 181 | 16.0% |
| 55 to 64 Years | 385 | 34.1% |
| 65 to 74 Years | 272 | 24.1% |
| 75 to 84 Years | 73 | 6.5% |
| 85 Years and Over | 49 | 4.3% |
| Total | 1,129 | 100.0% |
Housing Finances in Lake Wazeecha
Median Income by Occupancy in Lake Wazeecha
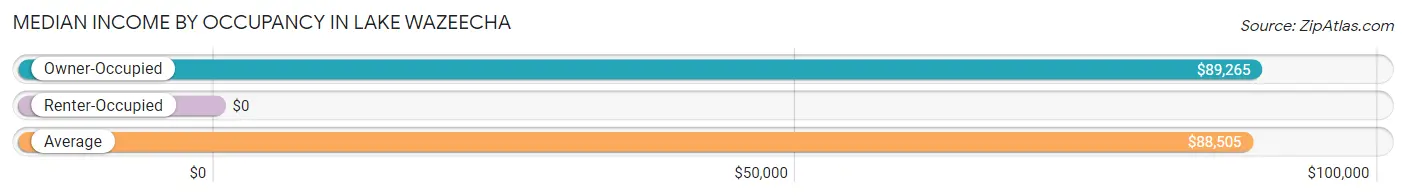
| Occupancy Type | # Households | Median Income |
| Owner-Occupied | 1,034 (91.6%) | $89,265 |
| Renter-Occupied | 95 (8.4%) | $0 |
| Average | 1,129 (100.0%) | $88,505 |
Occupancy by Householder Income Bracket in Lake Wazeecha
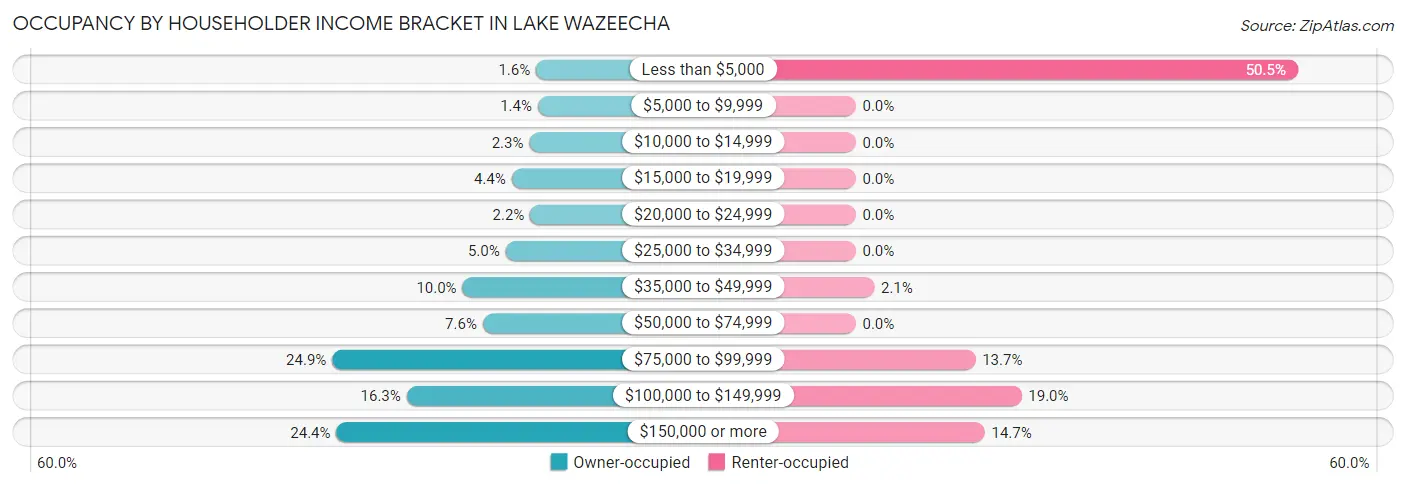
| Income Bracket | Owner-occupied | Renter-occupied |
| Less than $5,000 | 16 (1.5%) | 48 (50.5%) |
| $5,000 to $9,999 | 14 (1.3%) | 0 (0.0%) |
| $10,000 to $14,999 | 24 (2.3%) | 0 (0.0%) |
| $15,000 to $19,999 | 45 (4.3%) | 0 (0.0%) |
| $20,000 to $24,999 | 23 (2.2%) | 0 (0.0%) |
| $25,000 to $34,999 | 52 (5.0%) | 0 (0.0%) |
| $35,000 to $49,999 | 103 (10.0%) | 2 (2.1%) |
| $50,000 to $74,999 | 79 (7.6%) | 0 (0.0%) |
| $75,000 to $99,999 | 257 (24.8%) | 13 (13.7%) |
| $100,000 to $149,999 | 169 (16.3%) | 18 (19.0%) |
| $150,000 or more | 252 (24.4%) | 14 (14.7%) |
| Total | 1,034 (100.0%) | 95 (100.0%) |
Monthly Housing Cost Tiers in Lake Wazeecha
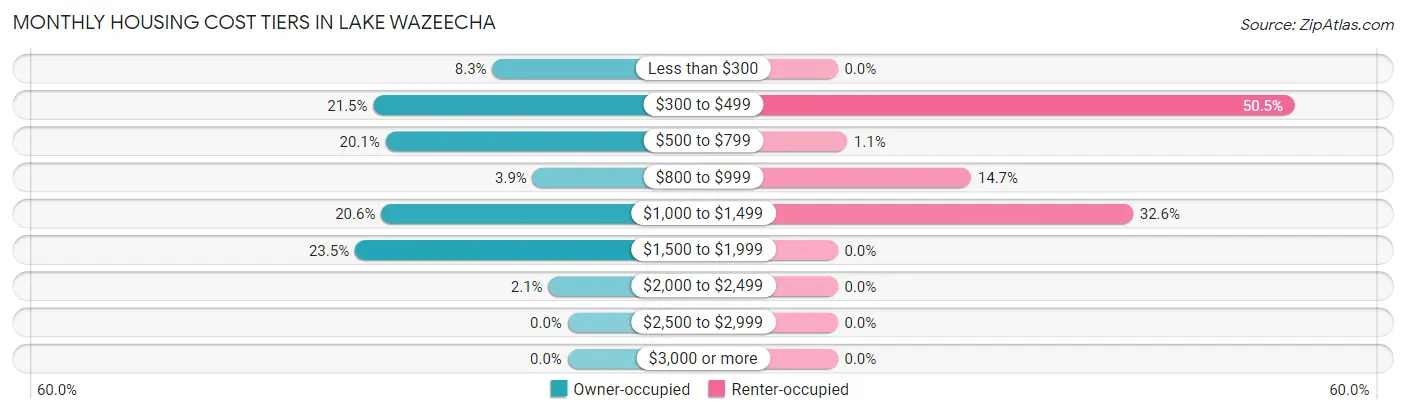
| Monthly Cost | Owner-occupied | Renter-occupied |
| Less than $300 | 86 (8.3%) | 0 (0.0%) |
| $300 to $499 | 222 (21.5%) | 48 (50.5%) |
| $500 to $799 | 208 (20.1%) | 1 (1.1%) |
| $800 to $999 | 40 (3.9%) | 14 (14.7%) |
| $1,000 to $1,499 | 213 (20.6%) | 31 (32.6%) |
| $1,500 to $1,999 | 243 (23.5%) | 0 (0.0%) |
| $2,000 to $2,499 | 22 (2.1%) | 0 (0.0%) |
| $2,500 to $2,999 | 0 (0.0%) | 0 (0.0%) |
| $3,000 or more | 0 (0.0%) | 0 (0.0%) |
| Total | 1,034 (100.0%) | 95 (100.0%) |
Physical Housing Characteristics in Lake Wazeecha
Housing Structures in Lake Wazeecha
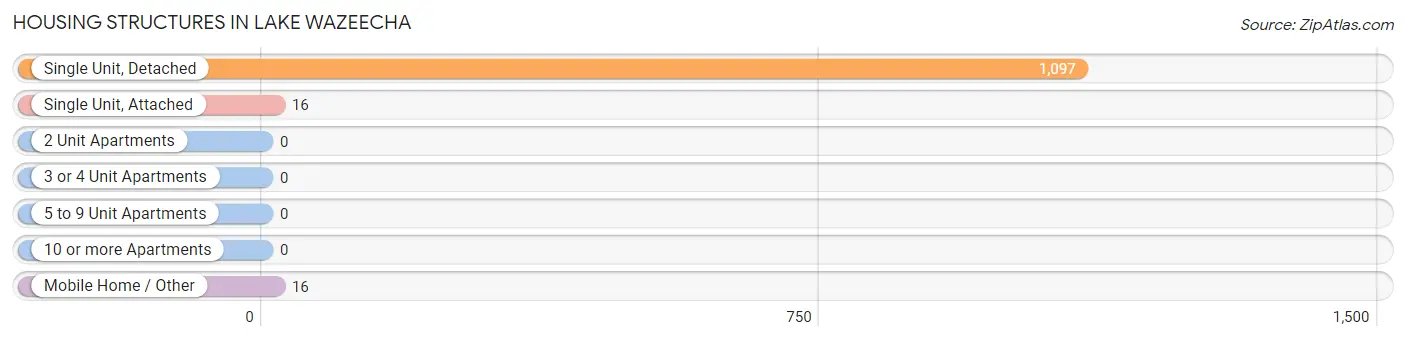
| Structure Type | # Housing Units | % Housing Units |
| Single Unit, Detached | 1,097 | 97.2% |
| Single Unit, Attached | 16 | 1.4% |
| 2 Unit Apartments | 0 | 0.0% |
| 3 or 4 Unit Apartments | 0 | 0.0% |
| 5 to 9 Unit Apartments | 0 | 0.0% |
| 10 or more Apartments | 0 | 0.0% |
| Mobile Home / Other | 16 | 1.4% |
| Total | 1,129 | 100.0% |
Housing Structures by Occupancy in Lake Wazeecha
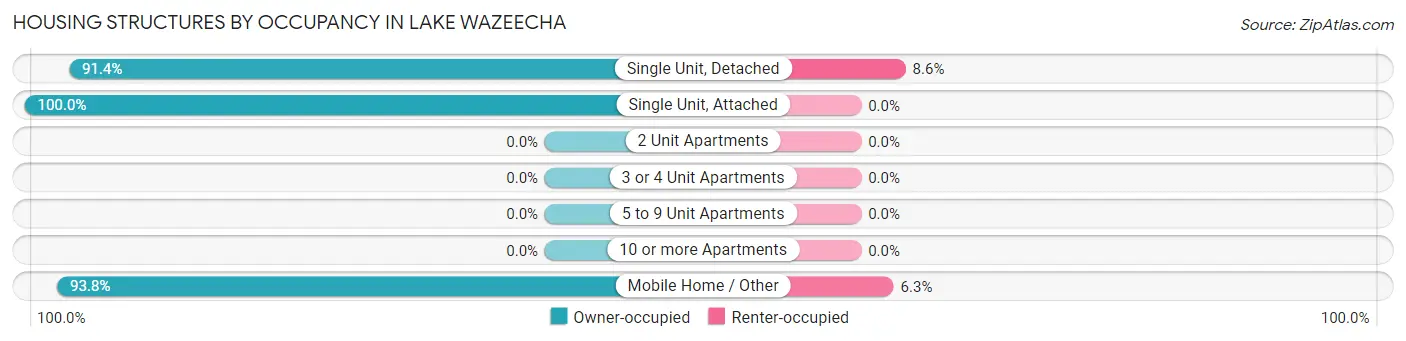
| Structure Type | Owner-occupied | Renter-occupied |
| Single Unit, Detached | 1,003 (91.4%) | 94 (8.6%) |
| Single Unit, Attached | 16 (100.0%) | 0 (0.0%) |
| 2 Unit Apartments | 0 (0.0%) | 0 (0.0%) |
| 3 or 4 Unit Apartments | 0 (0.0%) | 0 (0.0%) |
| 5 to 9 Unit Apartments | 0 (0.0%) | 0 (0.0%) |
| 10 or more Apartments | 0 (0.0%) | 0 (0.0%) |
| Mobile Home / Other | 15 (93.8%) | 1 (6.2%) |
| Total | 1,034 (91.6%) | 95 (8.4%) |
Housing Structures by Number of Rooms in Lake Wazeecha
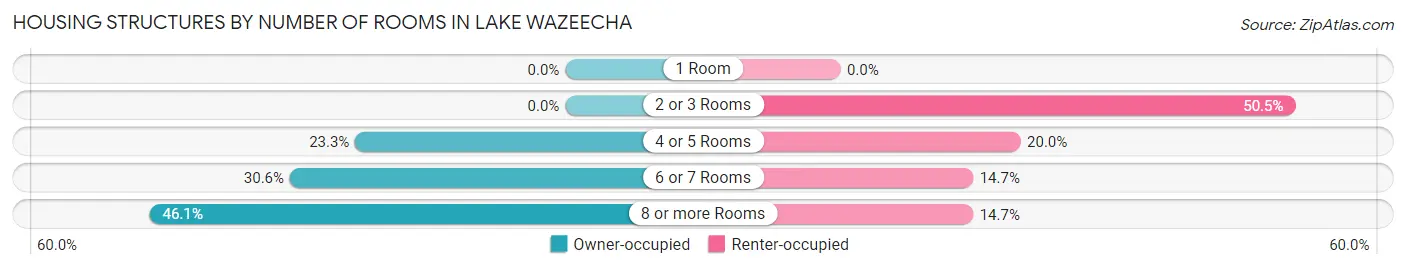
| Number of Rooms | Owner-occupied | Renter-occupied |
| 1 Room | 0 (0.0%) | 0 (0.0%) |
| 2 or 3 Rooms | 0 (0.0%) | 48 (50.5%) |
| 4 or 5 Rooms | 241 (23.3%) | 19 (20.0%) |
| 6 or 7 Rooms | 316 (30.6%) | 14 (14.7%) |
| 8 or more Rooms | 477 (46.1%) | 14 (14.7%) |
| Total | 1,034 (100.0%) | 95 (100.0%) |
Housing Structure by Heating Type in Lake Wazeecha
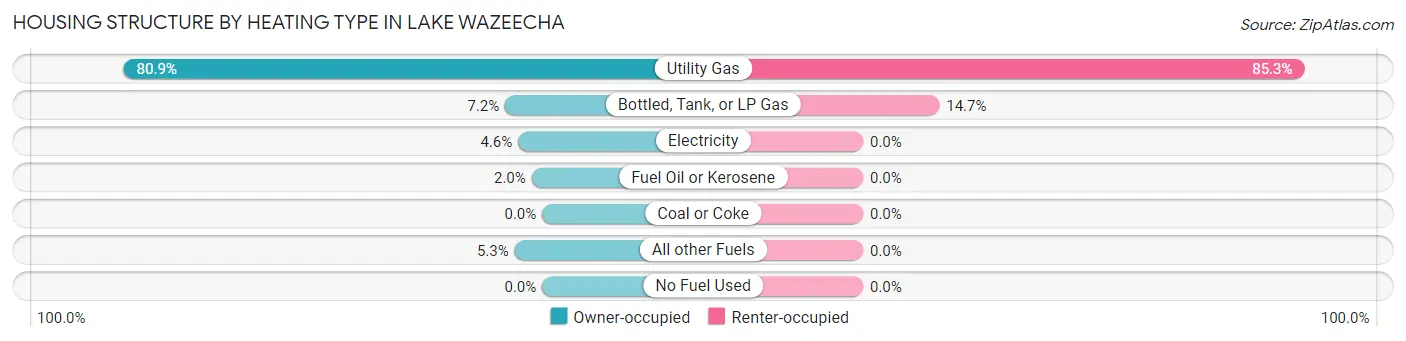
| Heating Type | Owner-occupied | Renter-occupied |
| Utility Gas | 836 (80.8%) | 81 (85.3%) |
| Bottled, Tank, or LP Gas | 74 (7.2%) | 14 (14.7%) |
| Electricity | 48 (4.6%) | 0 (0.0%) |
| Fuel Oil or Kerosene | 21 (2.0%) | 0 (0.0%) |
| Coal or Coke | 0 (0.0%) | 0 (0.0%) |
| All other Fuels | 55 (5.3%) | 0 (0.0%) |
| No Fuel Used | 0 (0.0%) | 0 (0.0%) |
| Total | 1,034 (100.0%) | 95 (100.0%) |
Household Vehicle Usage in Lake Wazeecha
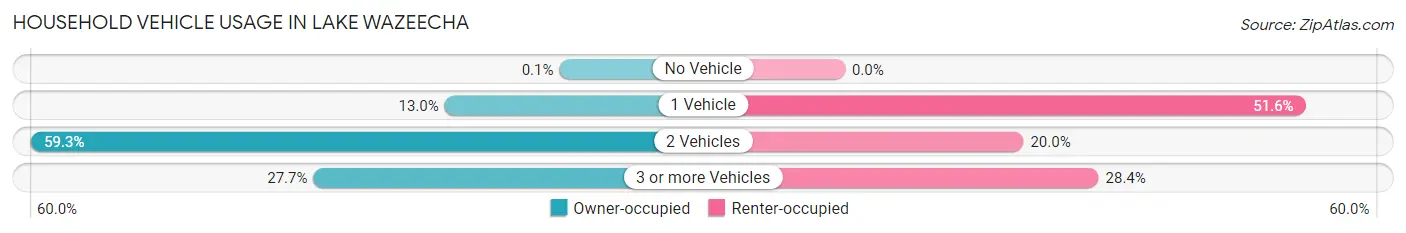
| Vehicles per Household | Owner-occupied | Renter-occupied |
| No Vehicle | 1 (0.1%) | 0 (0.0%) |
| 1 Vehicle | 134 (13.0%) | 49 (51.6%) |
| 2 Vehicles | 613 (59.3%) | 19 (20.0%) |
| 3 or more Vehicles | 286 (27.7%) | 27 (28.4%) |
| Total | 1,034 (100.0%) | 95 (100.0%) |
Real Estate & Mortgages in Lake Wazeecha
Real Estate and Mortgage Overview in Lake Wazeecha
| Characteristic | Without Mortgage | With Mortgage |
| Housing Units | 469 | 565 |
| Median Property Value | $183,300 | $233,600 |
| Median Household Income | $59,609 | $149 |
| Monthly Housing Costs | $387 | $0 |
| Real Estate Taxes | $2,400 | $15 |
Property Value by Mortgage Status in Lake Wazeecha
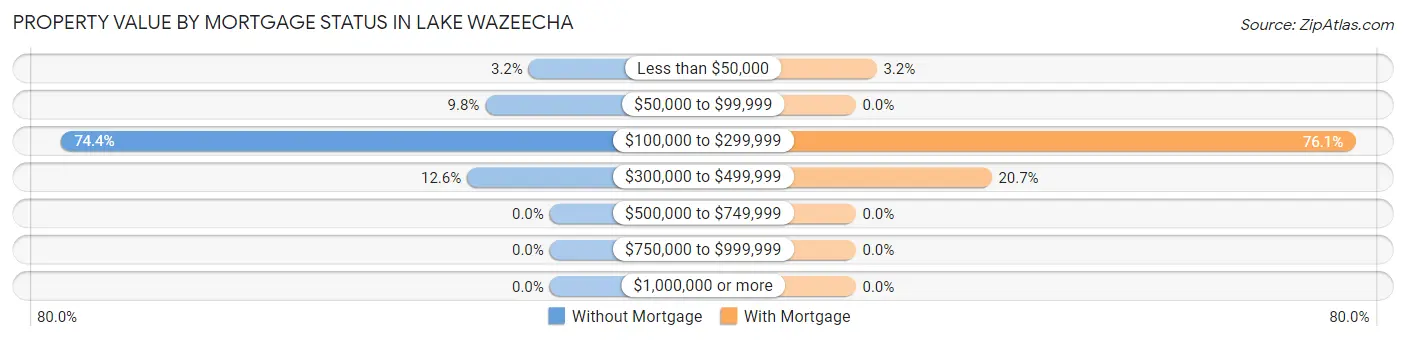
| Property Value | Without Mortgage | With Mortgage |
| Less than $50,000 | 15 (3.2%) | 18 (3.2%) |
| $50,000 to $99,999 | 46 (9.8%) | 0 (0.0%) |
| $100,000 to $299,999 | 349 (74.4%) | 430 (76.1%) |
| $300,000 to $499,999 | 59 (12.6%) | 117 (20.7%) |
| $500,000 to $749,999 | 0 (0.0%) | 0 (0.0%) |
| $750,000 to $999,999 | 0 (0.0%) | 0 (0.0%) |
| $1,000,000 or more | 0 (0.0%) | 0 (0.0%) |
| Total | 469 (100.0%) | 565 (100.0%) |
Household Income by Mortgage Status in Lake Wazeecha
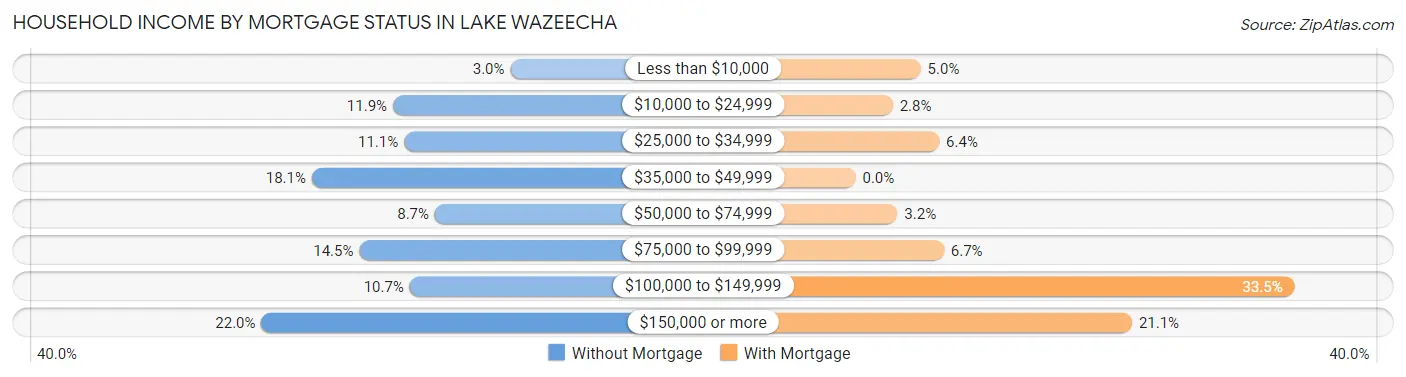
| Household Income | Without Mortgage | With Mortgage |
| Less than $10,000 | 14 (3.0%) | 28 (5.0%) |
| $10,000 to $24,999 | 56 (11.9%) | 16 (2.8%) |
| $25,000 to $34,999 | 52 (11.1%) | 36 (6.4%) |
| $35,000 to $49,999 | 85 (18.1%) | 0 (0.0%) |
| $50,000 to $74,999 | 41 (8.7%) | 18 (3.2%) |
| $75,000 to $99,999 | 68 (14.5%) | 38 (6.7%) |
| $100,000 to $149,999 | 50 (10.7%) | 189 (33.5%) |
| $150,000 or more | 103 (22.0%) | 119 (21.1%) |
| Total | 469 (100.0%) | 565 (100.0%) |
Property Value to Household Income Ratio in Lake Wazeecha
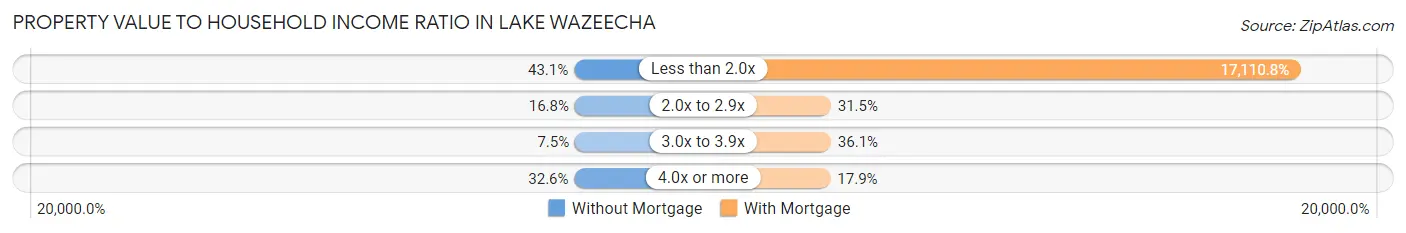
| Value-to-Income Ratio | Without Mortgage | With Mortgage |
| Less than 2.0x | 202 (43.1%) | 96,676 (17,110.8%) |
| 2.0x to 2.9x | 79 (16.8%) | 178 (31.5%) |
| 3.0x to 3.9x | 35 (7.5%) | 204 (36.1%) |
| 4.0x or more | 153 (32.6%) | 101 (17.9%) |
| Total | 469 (100.0%) | 565 (100.0%) |
Real Estate Taxes by Mortgage Status in Lake Wazeecha
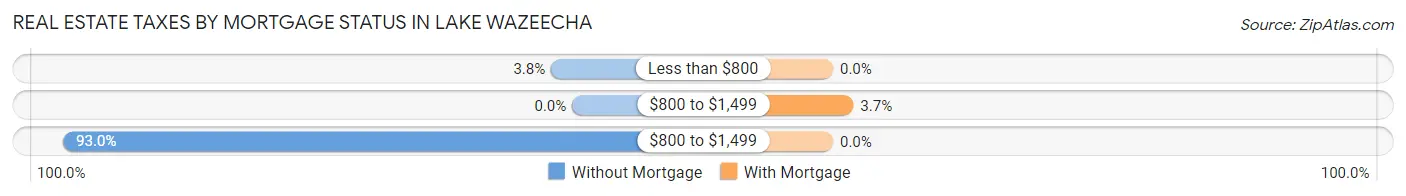
| Property Taxes | Without Mortgage | With Mortgage |
| Less than $800 | 18 (3.8%) | 0 (0.0%) |
| $800 to $1,499 | 0 (0.0%) | 21 (3.7%) |
| $800 to $1,499 | 436 (93.0%) | 0 (0.0%) |
| Total | 469 (100.0%) | 565 (100.0%) |
Health & Disability in Lake Wazeecha
Health Insurance Coverage by Age in Lake Wazeecha
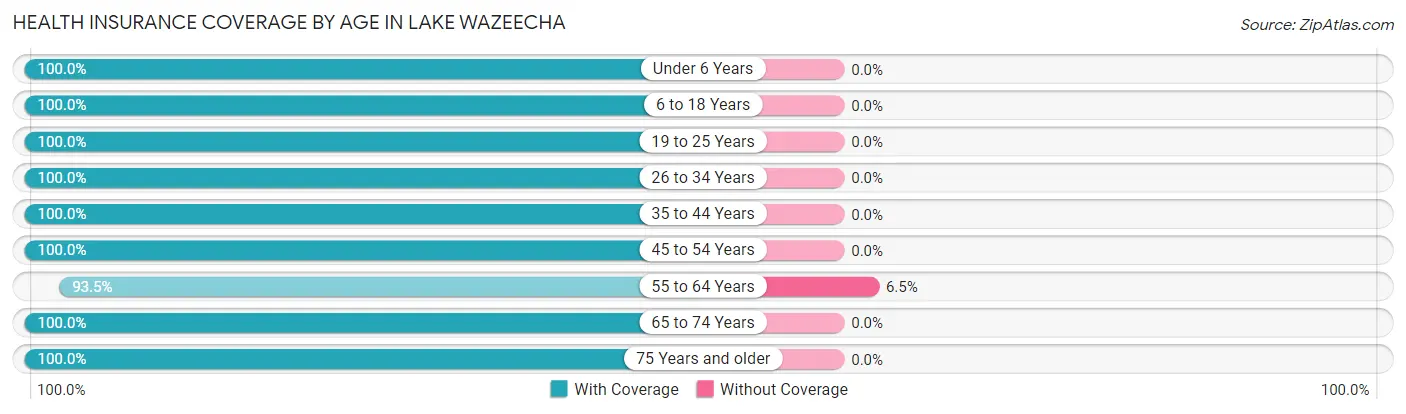
| Age Bracket | With Coverage | Without Coverage |
| Under 6 Years | 130 (100.0%) | 0 (0.0%) |
| 6 to 18 Years | 354 (100.0%) | 0 (0.0%) |
| 19 to 25 Years | 92 (100.0%) | 0 (0.0%) |
| 26 to 34 Years | 229 (100.0%) | 0 (0.0%) |
| 35 to 44 Years | 245 (100.0%) | 0 (0.0%) |
| 45 to 54 Years | 391 (100.0%) | 0 (0.0%) |
| 55 to 64 Years | 521 (93.5%) | 36 (6.5%) |
| 65 to 74 Years | 503 (100.0%) | 0 (0.0%) |
| 75 Years and older | 181 (100.0%) | 0 (0.0%) |
| Total | 2,646 (98.7%) | 36 (1.3%) |
Health Insurance Coverage by Citizenship Status in Lake Wazeecha
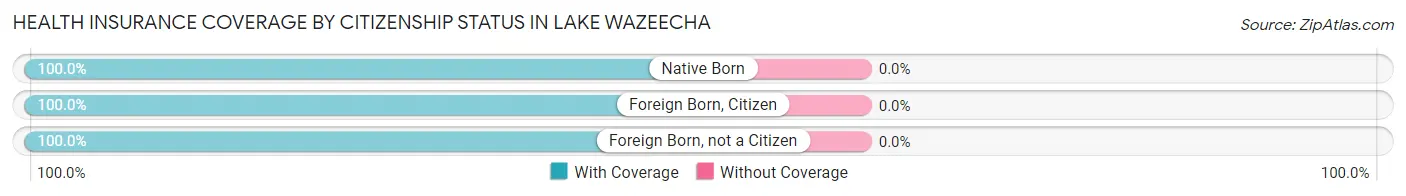
| Citizenship Status | With Coverage | Without Coverage |
| Native Born | 130 (100.0%) | 0 (0.0%) |
| Foreign Born, Citizen | 354 (100.0%) | 0 (0.0%) |
| Foreign Born, not a Citizen | 92 (100.0%) | 0 (0.0%) |
Health Insurance Coverage by Household Income in Lake Wazeecha
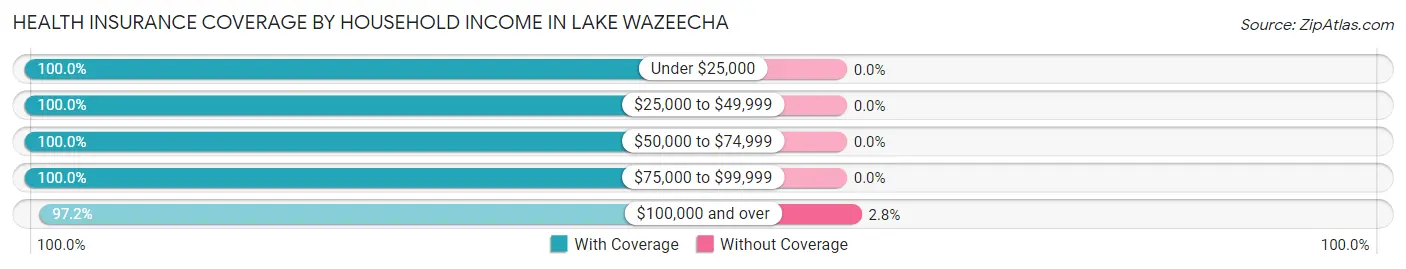
| Household Income | With Coverage | Without Coverage |
| Under $25,000 | 265 (100.0%) | 0 (0.0%) |
| $25,000 to $49,999 | 237 (100.0%) | 0 (0.0%) |
| $50,000 to $74,999 | 122 (100.0%) | 0 (0.0%) |
| $75,000 to $99,999 | 746 (100.0%) | 0 (0.0%) |
| $100,000 and over | 1,269 (97.2%) | 36 (2.8%) |
Public vs Private Health Insurance Coverage by Age in Lake Wazeecha
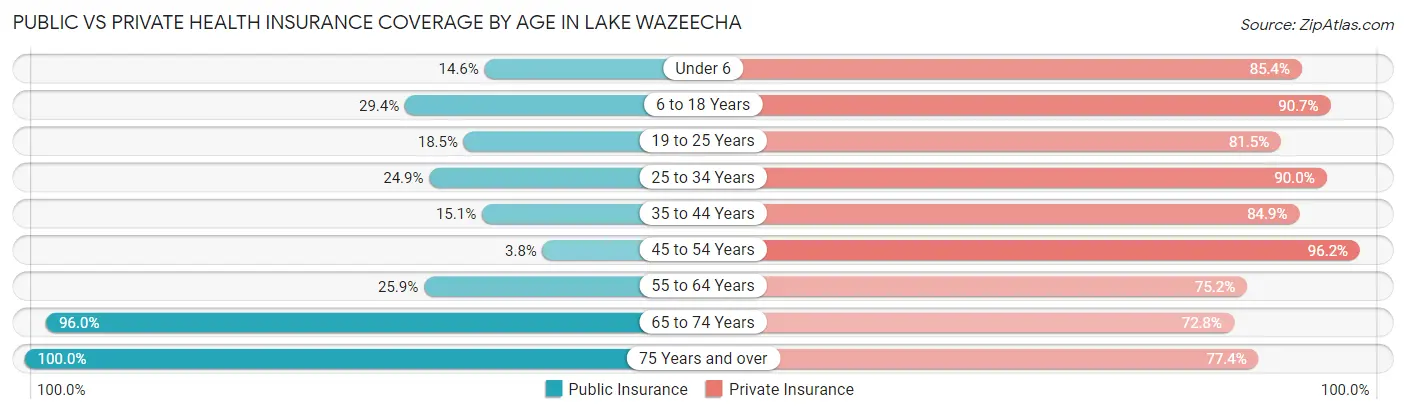
| Age Bracket | Public Insurance | Private Insurance |
| Under 6 | 19 (14.6%) | 111 (85.4%) |
| 6 to 18 Years | 104 (29.4%) | 321 (90.7%) |
| 19 to 25 Years | 17 (18.5%) | 75 (81.5%) |
| 25 to 34 Years | 57 (24.9%) | 206 (90.0%) |
| 35 to 44 Years | 37 (15.1%) | 208 (84.9%) |
| 45 to 54 Years | 15 (3.8%) | 376 (96.2%) |
| 55 to 64 Years | 144 (25.9%) | 419 (75.2%) |
| 65 to 74 Years | 483 (96.0%) | 366 (72.8%) |
| 75 Years and over | 181 (100.0%) | 140 (77.3%) |
| Total | 1,057 (39.4%) | 2,222 (82.9%) |
Disability Status by Sex by Age in Lake Wazeecha
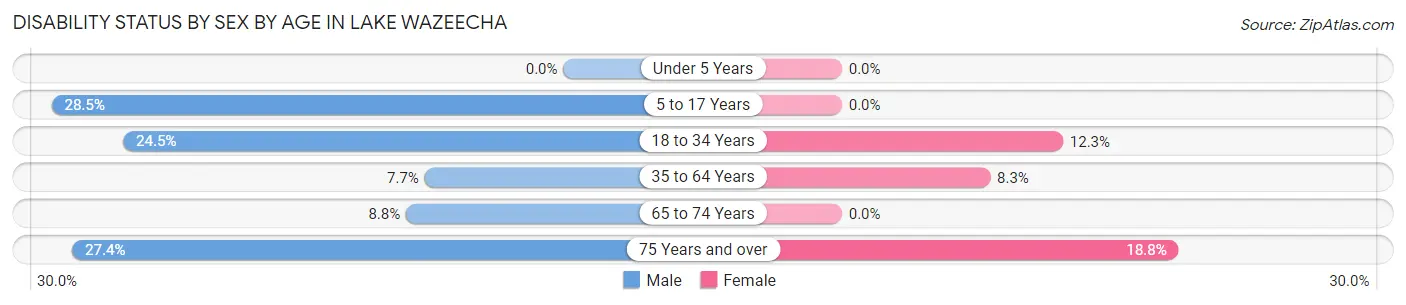
| Age Bracket | Male | Female |
| Under 5 Years | 0 (0.0%) | 0 (0.0%) |
| 5 to 17 Years | 59 (28.5%) | 0 (0.0%) |
| 18 to 34 Years | 50 (24.5%) | 16 (12.3%) |
| 35 to 64 Years | 50 (7.7%) | 45 (8.3%) |
| 65 to 74 Years | 22 (8.8%) | 0 (0.0%) |
| 75 Years and over | 32 (27.4%) | 12 (18.8%) |
Disability Class by Sex by Age in Lake Wazeecha
Disability Class: Hearing Difficulty
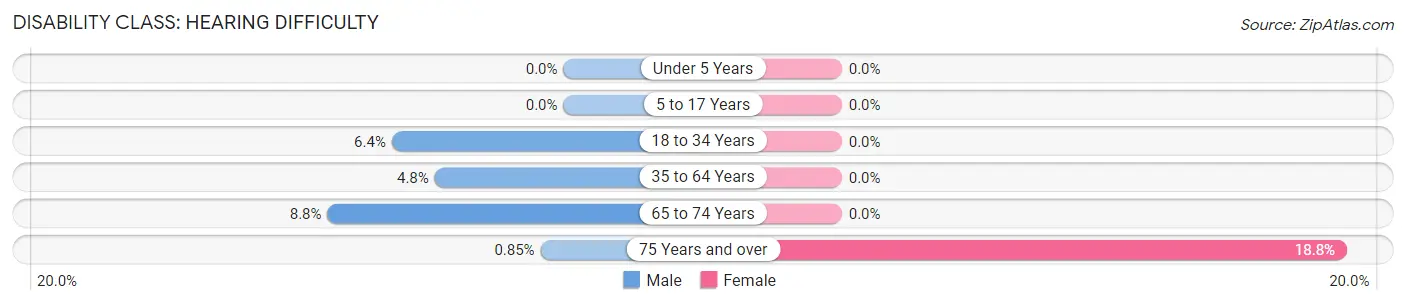
| Age Bracket | Male | Female |
| Under 5 Years | 0 (0.0%) | 0 (0.0%) |
| 5 to 17 Years | 0 (0.0%) | 0 (0.0%) |
| 18 to 34 Years | 13 (6.4%) | 0 (0.0%) |
| 35 to 64 Years | 31 (4.8%) | 0 (0.0%) |
| 65 to 74 Years | 22 (8.8%) | 0 (0.0%) |
| 75 Years and over | 1 (0.9%) | 12 (18.8%) |
Disability Class: Vision Difficulty
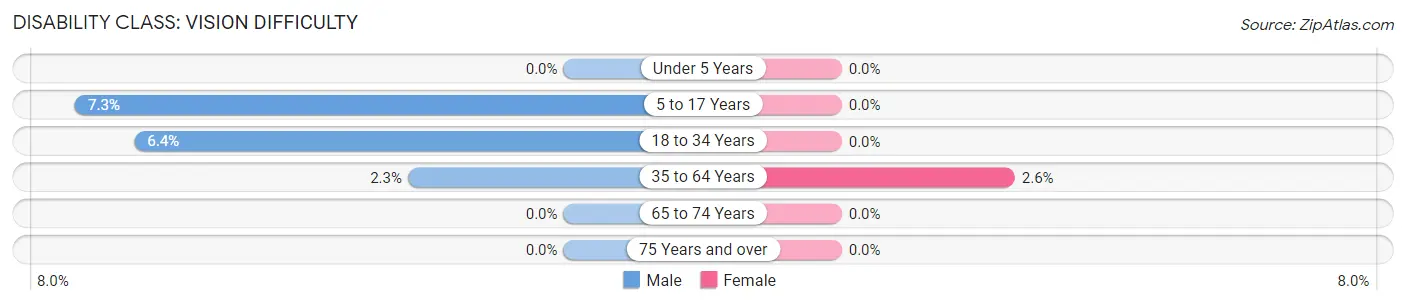
| Age Bracket | Male | Female |
| Under 5 Years | 0 (0.0%) | 0 (0.0%) |
| 5 to 17 Years | 15 (7.2%) | 0 (0.0%) |
| 18 to 34 Years | 13 (6.4%) | 0 (0.0%) |
| 35 to 64 Years | 15 (2.3%) | 14 (2.6%) |
| 65 to 74 Years | 0 (0.0%) | 0 (0.0%) |
| 75 Years and over | 0 (0.0%) | 0 (0.0%) |
Disability Class: Cognitive Difficulty
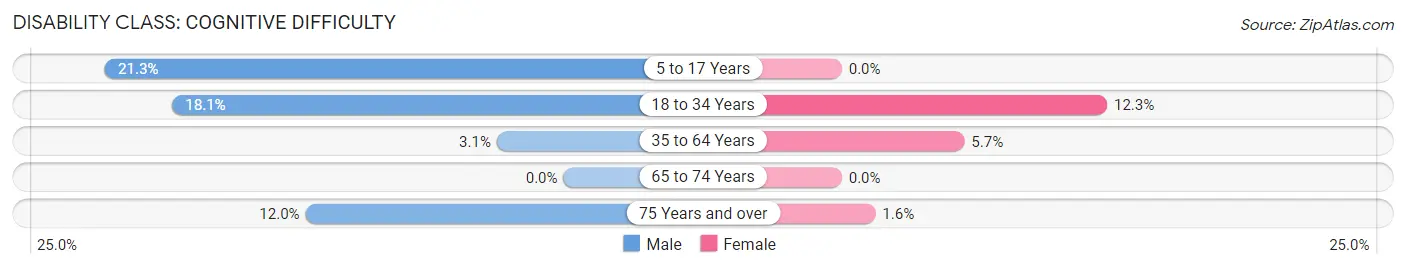
| Age Bracket | Male | Female |
| 5 to 17 Years | 44 (21.3%) | 0 (0.0%) |
| 18 to 34 Years | 37 (18.1%) | 16 (12.3%) |
| 35 to 64 Years | 20 (3.1%) | 31 (5.7%) |
| 65 to 74 Years | 0 (0.0%) | 0 (0.0%) |
| 75 Years and over | 14 (12.0%) | 1 (1.6%) |
Disability Class: Ambulatory Difficulty
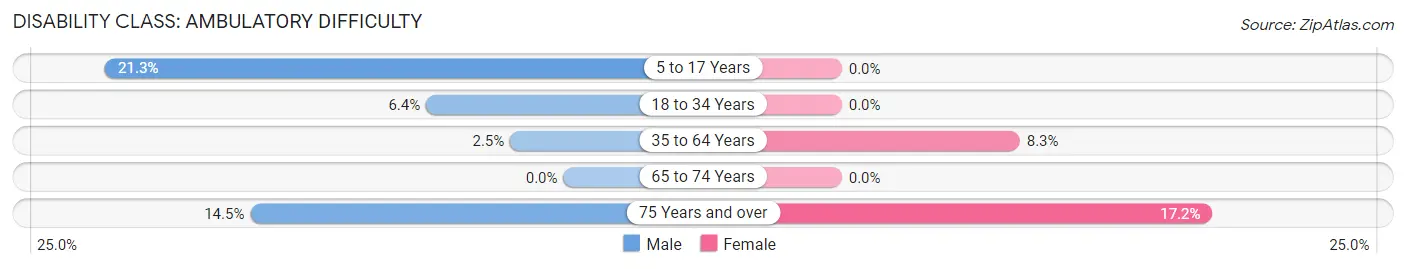
| Age Bracket | Male | Female |
| 5 to 17 Years | 44 (21.3%) | 0 (0.0%) |
| 18 to 34 Years | 13 (6.4%) | 0 (0.0%) |
| 35 to 64 Years | 16 (2.5%) | 45 (8.3%) |
| 65 to 74 Years | 0 (0.0%) | 0 (0.0%) |
| 75 Years and over | 17 (14.5%) | 11 (17.2%) |
Disability Class: Self-Care Difficulty
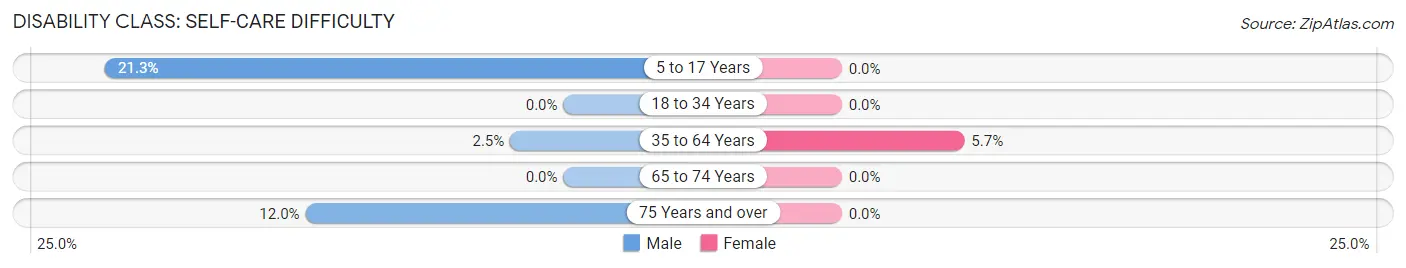
| Age Bracket | Male | Female |
| 5 to 17 Years | 44 (21.3%) | 0 (0.0%) |
| 18 to 34 Years | 0 (0.0%) | 0 (0.0%) |
| 35 to 64 Years | 16 (2.5%) | 31 (5.7%) |
| 65 to 74 Years | 0 (0.0%) | 0 (0.0%) |
| 75 Years and over | 14 (12.0%) | 0 (0.0%) |
Technology Access in Lake Wazeecha
Computing Device Access in Lake Wazeecha
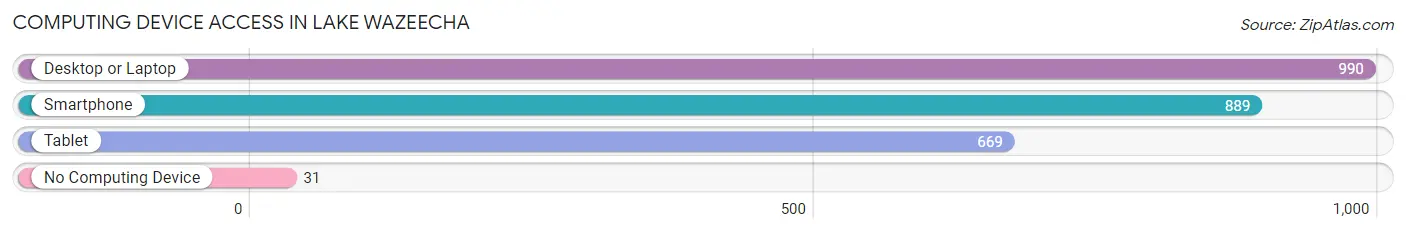
| Device Type | # Households | % Households |
| Desktop or Laptop | 990 | 87.7% |
| Smartphone | 889 | 78.7% |
| Tablet | 669 | 59.3% |
| No Computing Device | 31 | 2.8% |
| Total | 1,129 | 100.0% |
Internet Access in Lake Wazeecha
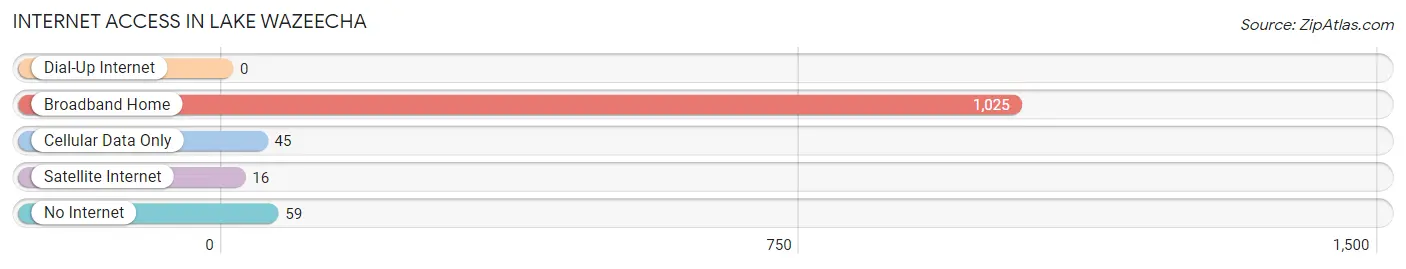
| Internet Type | # Households | % Households |
| Dial-Up Internet | 0 | 0.0% |
| Broadband Home | 1,025 | 90.8% |
| Cellular Data Only | 45 | 4.0% |
| Satellite Internet | 16 | 1.4% |
| No Internet | 59 | 5.2% |
| Total | 1,129 | 100.0% |
Lake Wazeecha Summary
Lake Wazeecha is a small lake located in Wood County, Wisconsin. It is part of the Wisconsin River system and is located just south of Wisconsin Rapids. The lake is approximately 1,000 acres in size and is a popular destination for fishing, swimming, and boating.
Geography
Lake Wazeecha is located in the Central Sands region of Wisconsin. The lake is surrounded by rolling hills and is part of the Wisconsin River system. The lake is approximately 1,000 acres in size and has a maximum depth of 30 feet. The lake is fed by the Wisconsin River and is drained by the Wisconsin River. The lake is located just south of Wisconsin Rapids and is bordered by the towns of Grand Rapids, Rudolph, and Saratoga.
Economy
Lake Wazeecha is a popular destination for fishing, swimming, and boating. The lake is home to a variety of fish species including largemouth bass, northern pike, walleye, and panfish. The lake is also popular for recreational activities such as swimming, boating, and water skiing. The lake is also home to several marinas and boat launches.
Demographics
The population of Lake Wazeecha is approximately 1,000 people. The majority of the population is white (90%) with the remaining 10% being of other races. The median household income is $50,000 and the median age is 44. The majority of the population is married (60%) and the majority of the population is employed (80%).
History
Lake Wazeecha was originally inhabited by the Ho-Chunk Native American tribe. The lake was named after Chief Wazeecha, who was a leader of the Ho-Chunk tribe. The lake was first settled by European settlers in the late 1800s. The lake was used for logging and fishing and was a popular destination for recreational activities. In the early 1900s, the lake was used for hydroelectric power generation. In the 1950s, the lake was developed for recreational activities such as fishing, swimming, and boating. The lake is now a popular destination for fishing, swimming, and boating.
Common Questions
What is Per Capita Income in Lake Wazeecha?
Per Capita income in Lake Wazeecha is $49,673.
What is the Median Family Income in Lake Wazeecha?
Median Family Income in Lake Wazeecha is $100,772.
What is the Median Household income in Lake Wazeecha?
Median Household Income in Lake Wazeecha is $88,505.
What is Income or Wage Gap in Lake Wazeecha?
Income or Wage Gap in Lake Wazeecha is 33.5%.
Women in Lake Wazeecha earn 66.5 cents for every dollar earned by a man.
What is Inequality or Gini Index in Lake Wazeecha?
Inequality or Gini Index in Lake Wazeecha is 0.46.
What is the Total Population of Lake Wazeecha?
Total Population of Lake Wazeecha is 2,682.
What is the Total Male Population of Lake Wazeecha?
Total Male Population of Lake Wazeecha is 1,473.
What is the Total Female Population of Lake Wazeecha?
Total Female Population of Lake Wazeecha is 1,209.
What is the Ratio of Males per 100 Females in Lake Wazeecha?
There are 121.84 Males per 100 Females in Lake Wazeecha.
What is the Ratio of Females per 100 Males in Lake Wazeecha?
There are 82.08 Females per 100 Males in Lake Wazeecha.
What is the Median Population Age in Lake Wazeecha?
Median Population Age in Lake Wazeecha is 52.8 Years.
What is the Average Family Size in Lake Wazeecha
Average Family Size in Lake Wazeecha is 2.7 People.
What is the Average Household Size in Lake Wazeecha
Average Household Size in Lake Wazeecha is 2.4 People.
How Large is the Labor Force in Lake Wazeecha?
There are 1,216 People in the Labor Forcein in Lake Wazeecha.
What is the Percentage of People in the Labor Force in Lake Wazeecha?
54.1% of People are in the Labor Force in Lake Wazeecha.
What is the Unemployment Rate in Lake Wazeecha?
Unemployment Rate in Lake Wazeecha is 2.6%.