Galesville, WI Map & Demographics
Galesville Map
Galesville Overview
$32,288
PER CAPITA INCOME
$87,500
AVG FAMILY INCOME
$66,774
AVG HOUSEHOLD INCOME
46.1%
WAGE / INCOME GAP [ % ]
53.9¢/ $1
WAGE / INCOME GAP [ $ ]
0.36
INEQUALITY / GINI INDEX
1,582
TOTAL POPULATION
817
MALE POPULATION
765
FEMALE POPULATION
106.80
MALES / 100 FEMALES
93.64
FEMALES / 100 MALES
33.9
MEDIAN AGE
3.0
AVG FAMILY SIZE
2.3
AVG HOUSEHOLD SIZE
916
LABOR FORCE [ PEOPLE ]
72.5%
PERCENT IN LABOR FORCE
0.3%
UNEMPLOYMENT RATE
Galesville Zip Codes
Galesville Area Codes
Income in Galesville
Income Overview in Galesville
Per Capita Income in Galesville is $32,288, while median incomes of families and households are $87,500 and $66,774 respectively.
| Characteristic | Number | Measure |
| Per Capita Income | 1,582 | $32,288 |
| Median Family Income | 364 | $87,500 |
| Mean Family Income | 364 | $89,387 |
| Median Household Income | 678 | $66,774 |
| Mean Household Income | 678 | $73,746 |
| Income Deficit | 364 | $0 |
| Wage / Income Gap (%) | 1,582 | 46.13% |
| Wage / Income Gap ($) | 1,582 | 53.87¢ per $1 |
| Gini / Inequality Index | 1,582 | 0.36 |
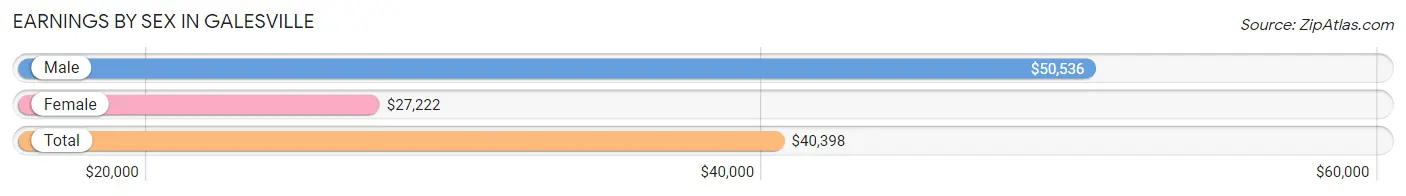
Earnings by Sex in Galesville
Average Earnings in Galesville are $40,398, $50,536 for men and $27,222 for women, a difference of 46.1%.
| Sex | Number | Average Earnings |
| Male | 498 (52.2%) | $50,536 |
| Female | 456 (47.8%) | $27,222 |
| Total | 954 (100.0%) | $40,398 |
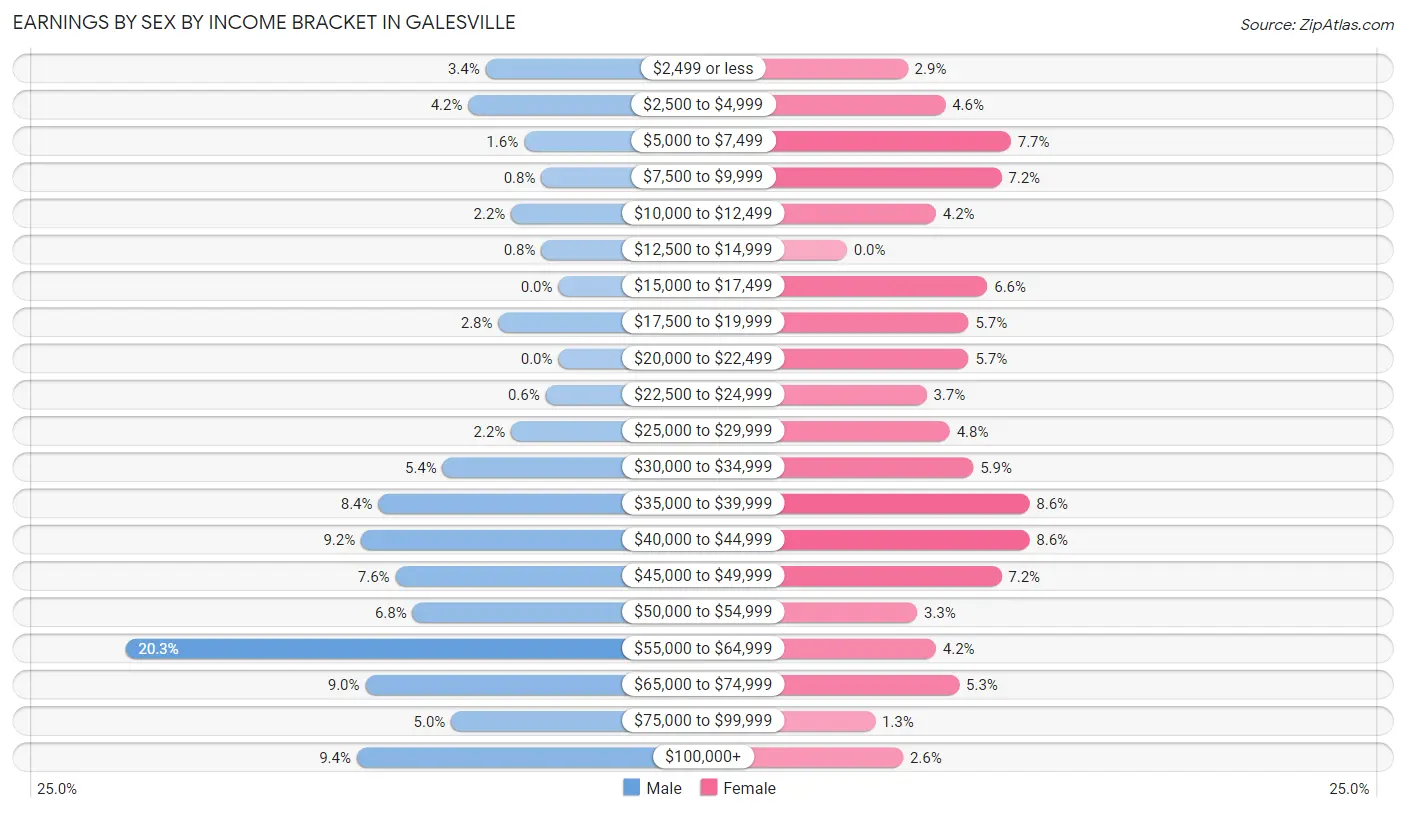
Earnings by Sex by Income Bracket in Galesville
The most common earnings brackets in Galesville are $55,000 to $64,999 for men (101 | 20.3%) and $35,000 to $39,999 for women (39 | 8.6%).
| Income | Male | Female |
| $2,499 or less | 17 (3.4%) | 13 (2.9%) |
| $2,500 to $4,999 | 21 (4.2%) | 21 (4.6%) |
| $5,000 to $7,499 | 8 (1.6%) | 35 (7.7%) |
| $7,500 to $9,999 | 4 (0.8%) | 33 (7.2%) |
| $10,000 to $12,499 | 11 (2.2%) | 19 (4.2%) |
| $12,500 to $14,999 | 4 (0.8%) | 0 (0.0%) |
| $15,000 to $17,499 | 0 (0.0%) | 30 (6.6%) |
| $17,500 to $19,999 | 14 (2.8%) | 26 (5.7%) |
| $20,000 to $22,499 | 0 (0.0%) | 26 (5.7%) |
| $22,500 to $24,999 | 3 (0.6%) | 17 (3.7%) |
| $25,000 to $29,999 | 11 (2.2%) | 22 (4.8%) |
| $30,000 to $34,999 | 27 (5.4%) | 27 (5.9%) |
| $35,000 to $39,999 | 42 (8.4%) | 39 (8.6%) |
| $40,000 to $44,999 | 46 (9.2%) | 39 (8.6%) |
| $45,000 to $49,999 | 38 (7.6%) | 33 (7.2%) |
| $50,000 to $54,999 | 34 (6.8%) | 15 (3.3%) |
| $55,000 to $64,999 | 101 (20.3%) | 19 (4.2%) |
| $65,000 to $74,999 | 45 (9.0%) | 24 (5.3%) |
| $75,000 to $99,999 | 25 (5.0%) | 6 (1.3%) |
| $100,000+ | 47 (9.4%) | 12 (2.6%) |
| Total | 498 (100.0%) | 456 (100.0%) |
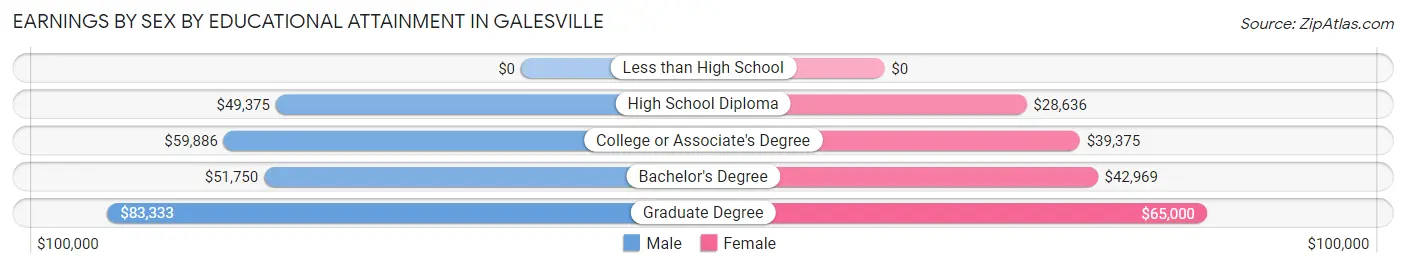
Earnings by Sex by Educational Attainment in Galesville
Average earnings in Galesville are $55,417 for men and $35,729 for women, a difference of 35.5%. Men with an educational attainment of graduate degree enjoy the highest average annual earnings of $83,333, while those with high school diploma education earn the least with $49,375. Women with an educational attainment of graduate degree earn the most with the average annual earnings of $65,000, while those with high school diploma education have the smallest earnings of $28,636.
| Educational Attainment | Male Income | Female Income |
| Less than High School | - | - |
| High School Diploma | $49,375 | $28,636 |
| College or Associate's Degree | $59,886 | $39,375 |
| Bachelor's Degree | $51,750 | $42,969 |
| Graduate Degree | $83,333 | $65,000 |
| Total | $55,417 | $35,729 |
Family Income in Galesville
Family Income Brackets in Galesville
According to the Galesville family income data, there are 102 families falling into the $75,000 to $99,999 income range, which is the most common income bracket and makes up 28.0% of all families.
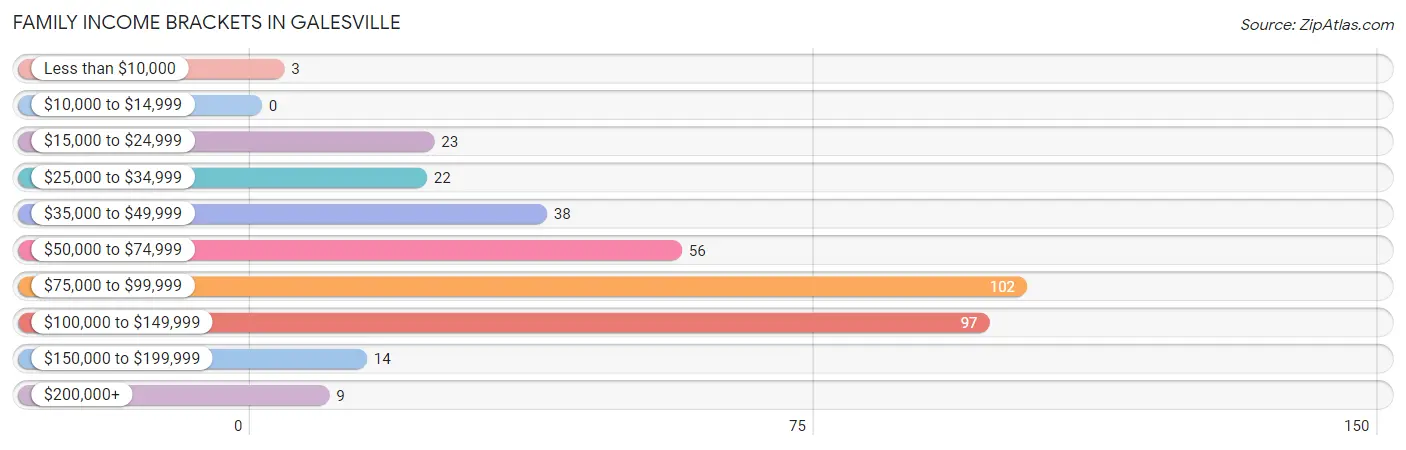
| Income Bracket | # Families | % Families |
| Less than $10,000 | 3 | 0.8% |
| $10,000 to $14,999 | 0 | 0.0% |
| $15,000 to $24,999 | 23 | 6.3% |
| $25,000 to $34,999 | 22 | 6.0% |
| $35,000 to $49,999 | 38 | 10.4% |
| $50,000 to $74,999 | 56 | 15.4% |
| $75,000 to $99,999 | 102 | 28.0% |
| $100,000 to $149,999 | 97 | 26.6% |
| $150,000 to $199,999 | 14 | 3.8% |
| $200,000+ | 9 | 2.5% |
Family Income by Famaliy Size in Galesville
4-person families (40 | 11.0%) account for the highest median family income in Galesville with $128,750 per family, while 2-person families (207 | 56.9%) have the highest median income of $41,875 per family member.
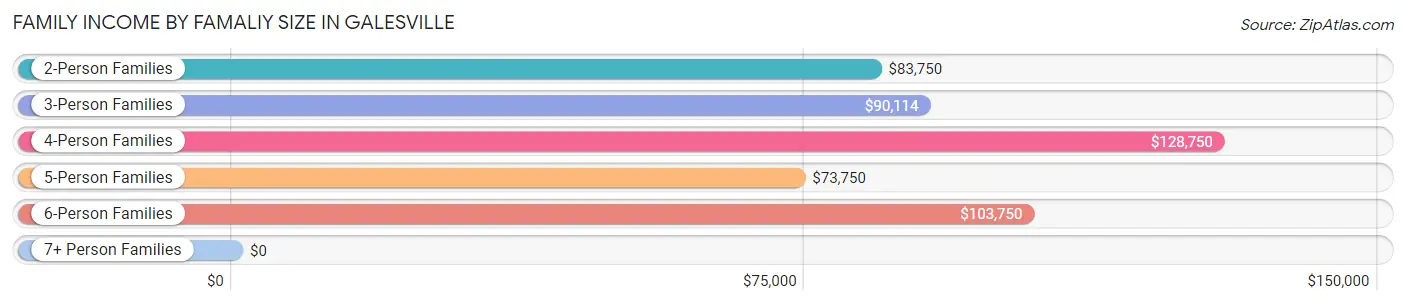
| Income Bracket | # Families | Median Income |
| 2-Person Families | 207 (56.9%) | $83,750 |
| 3-Person Families | 55 (15.1%) | $90,114 |
| 4-Person Families | 40 (11.0%) | $128,750 |
| 5-Person Families | 43 (11.8%) | $73,750 |
| 6-Person Families | 9 (2.5%) | $103,750 |
| 7+ Person Families | 10 (2.8%) | $0 |
| Total | 364 (100.0%) | $87,500 |
Family Income by Number of Earners in Galesville
The median family income in Galesville is $87,500, with families comprising 3+ earners (49) having the highest median family income of $107,125, while families with 1 earner (84) have the lowest median family income of $37,143, accounting for 13.5% and 23.1% of families, respectively.
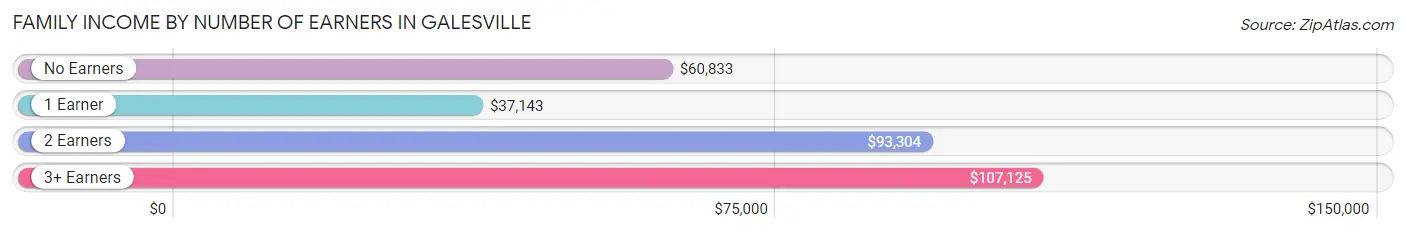
| Number of Earners | # Families | Median Income |
| No Earners | 36 (9.9%) | $60,833 |
| 1 Earner | 84 (23.1%) | $37,143 |
| 2 Earners | 195 (53.6%) | $93,304 |
| 3+ Earners | 49 (13.5%) | $107,125 |
| Total | 364 (100.0%) | $87,500 |
Household Income in Galesville
Household Income Brackets in Galesville
With 142 households falling in the category, the $50,000 to $74,999 income range is the most frequent in Galesville, accounting for 20.9% of all households. In contrast, only 14 households (2.1%) fall into the $10,000 to $14,999 income bracket, making it the least populous group.
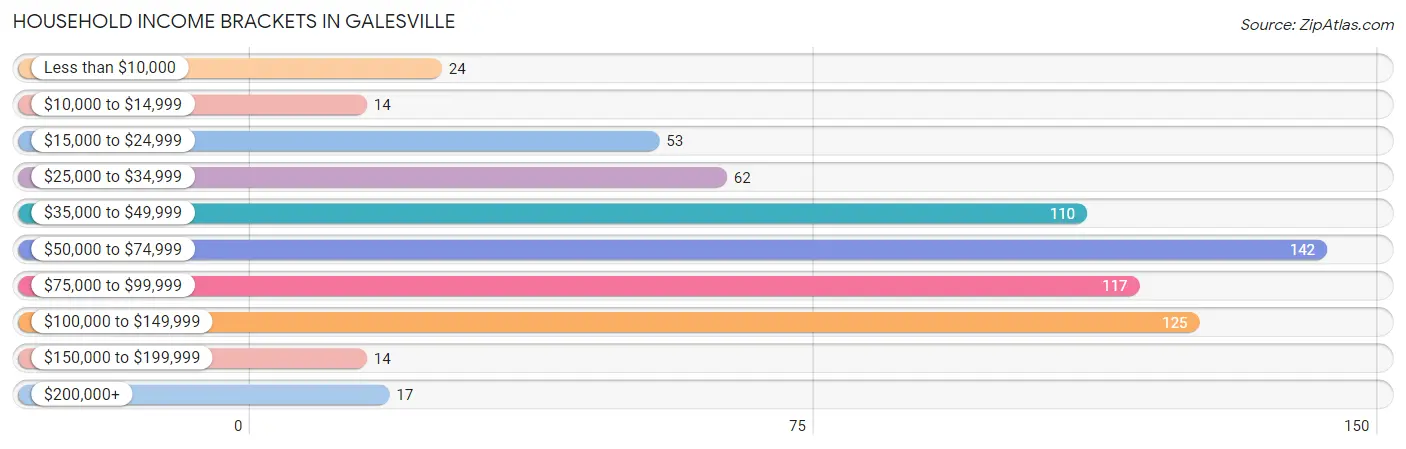
| Income Bracket | # Households | % Households |
| Less than $10,000 | 24 | 3.5% |
| $10,000 to $14,999 | 14 | 2.1% |
| $15,000 to $24,999 | 53 | 7.8% |
| $25,000 to $34,999 | 62 | 9.1% |
| $35,000 to $49,999 | 110 | 16.2% |
| $50,000 to $74,999 | 142 | 20.9% |
| $75,000 to $99,999 | 117 | 17.3% |
| $100,000 to $149,999 | 125 | 18.4% |
| $150,000 to $199,999 | 14 | 2.1% |
| $200,000+ | 17 | 2.5% |
Household Income by Householder Age in Galesville
The median household income in Galesville is $66,774, with the highest median household income of $77,639 found in the 25 to 44 years age bracket for the primary householder. A total of 241 households (35.5%) fall into this category. Meanwhile, the 65+ years age bracket for the primary householder has the lowest median household income of $44,375, with 149 households (22.0%) in this group.
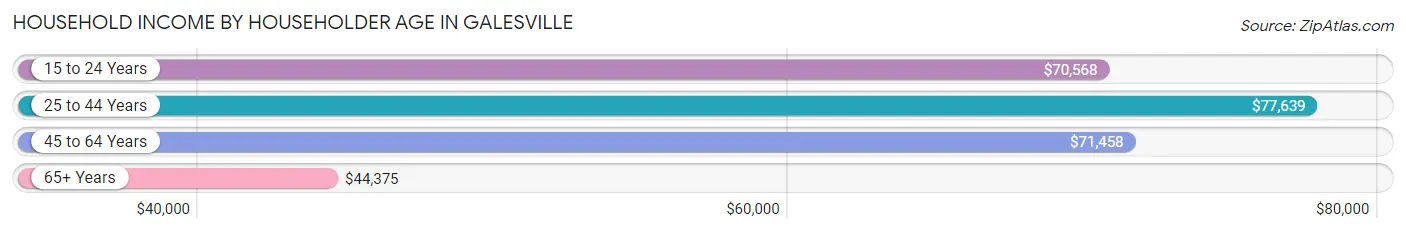
| Income Bracket | # Households | Median Income |
| 15 to 24 Years | 89 (13.1%) | $70,568 |
| 25 to 44 Years | 241 (35.5%) | $77,639 |
| 45 to 64 Years | 199 (29.3%) | $71,458 |
| 65+ Years | 149 (22.0%) | $44,375 |
| Total | 678 (100.0%) | $66,774 |
Poverty in Galesville
Income Below Poverty by Sex and Age in Galesville
With 5.1% poverty level for males and 12.7% for females among the residents of Galesville, 45 to 54 year old males and 5 year old females are the most vulnerable to poverty, with 12 males (17.4%) and 4 females (30.8%) in their respective age groups living below the poverty level.
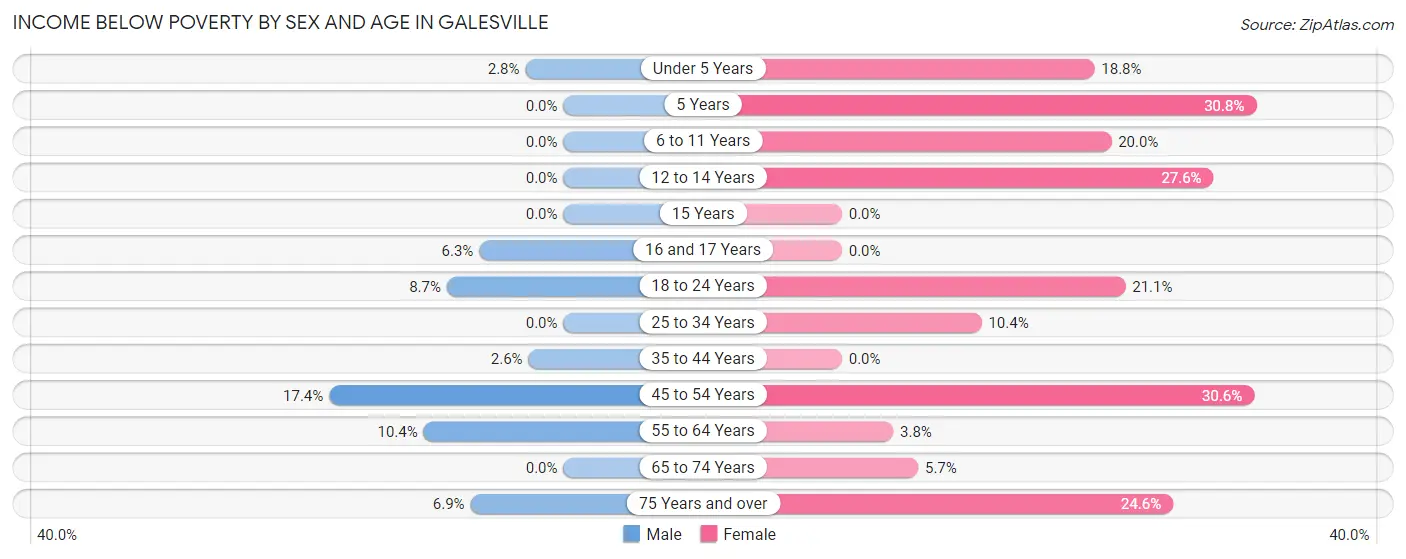
| Age Bracket | Male | Female |
| Under 5 Years | 2 (2.8%) | 6 (18.8%) |
| 5 Years | 0 (0.0%) | 4 (30.8%) |
| 6 to 11 Years | 0 (0.0%) | 7 (20.0%) |
| 12 to 14 Years | 0 (0.0%) | 8 (27.6%) |
| 15 Years | 0 (0.0%) | 0 (0.0%) |
| 16 and 17 Years | 2 (6.2%) | 0 (0.0%) |
| 18 to 24 Years | 9 (8.6%) | 16 (21.0%) |
| 25 to 34 Years | 0 (0.0%) | 14 (10.4%) |
| 35 to 44 Years | 3 (2.6%) | 0 (0.0%) |
| 45 to 54 Years | 12 (17.4%) | 15 (30.6%) |
| 55 to 64 Years | 11 (10.4%) | 4 (3.8%) |
| 65 to 74 Years | 0 (0.0%) | 3 (5.7%) |
| 75 Years and over | 2 (6.9%) | 15 (24.6%) |
| Total | 41 (5.1%) | 92 (12.7%) |
Income Above Poverty by Sex and Age in Galesville
According to the poverty statistics in Galesville, males aged 5 years and females aged 15 years are the age groups that are most secure financially, with 100.0% of males and 100.0% of females in these age groups living above the poverty line.
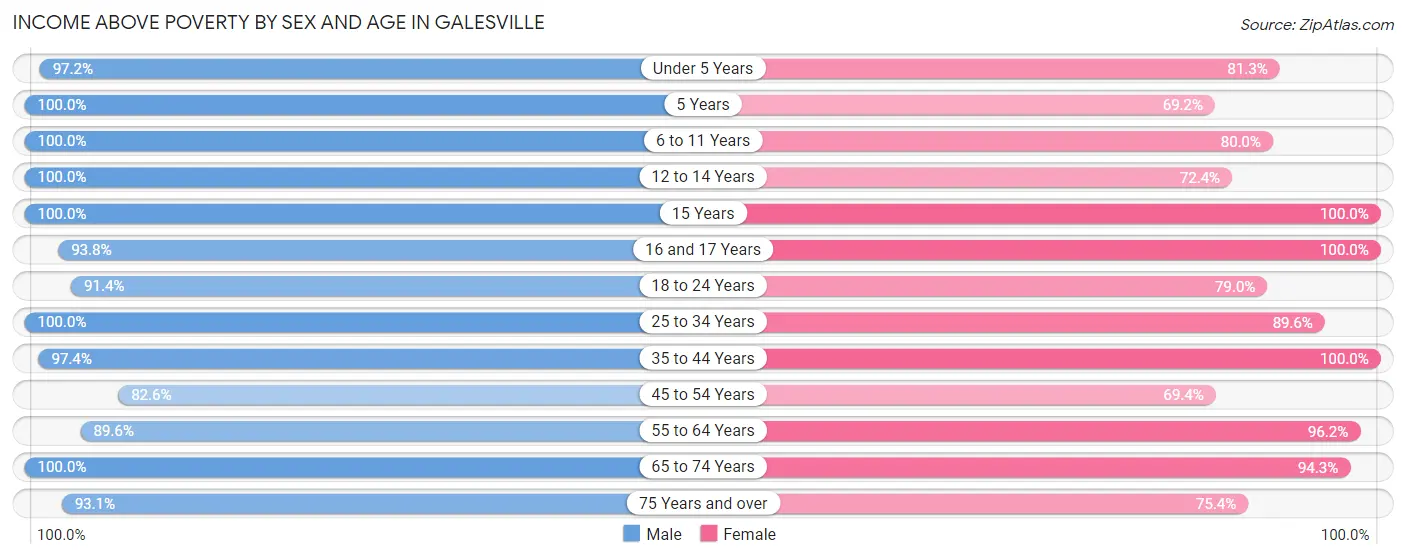
| Age Bracket | Male | Female |
| Under 5 Years | 69 (97.2%) | 26 (81.2%) |
| 5 Years | 10 (100.0%) | 9 (69.2%) |
| 6 to 11 Years | 55 (100.0%) | 28 (80.0%) |
| 12 to 14 Years | 32 (100.0%) | 21 (72.4%) |
| 15 Years | 28 (100.0%) | 9 (100.0%) |
| 16 and 17 Years | 30 (93.8%) | 49 (100.0%) |
| 18 to 24 Years | 95 (91.3%) | 60 (78.9%) |
| 25 to 34 Years | 94 (100.0%) | 121 (89.6%) |
| 35 to 44 Years | 113 (97.4%) | 79 (100.0%) |
| 45 to 54 Years | 57 (82.6%) | 34 (69.4%) |
| 55 to 64 Years | 95 (89.6%) | 101 (96.2%) |
| 65 to 74 Years | 62 (100.0%) | 50 (94.3%) |
| 75 Years and over | 27 (93.1%) | 46 (75.4%) |
| Total | 767 (94.9%) | 633 (87.3%) |
Income Below Poverty Among Married-Couple Families in Galesville
The poverty statistics for married-couple families in Galesville show that 1.1% or 3 of the total 269 families live below the poverty line. Families with no children have the highest poverty rate of 1.9%, comprising of 3 families. On the other hand, families with 1 or 2 children have the lowest poverty rate of 0.0%, which includes 0 families.
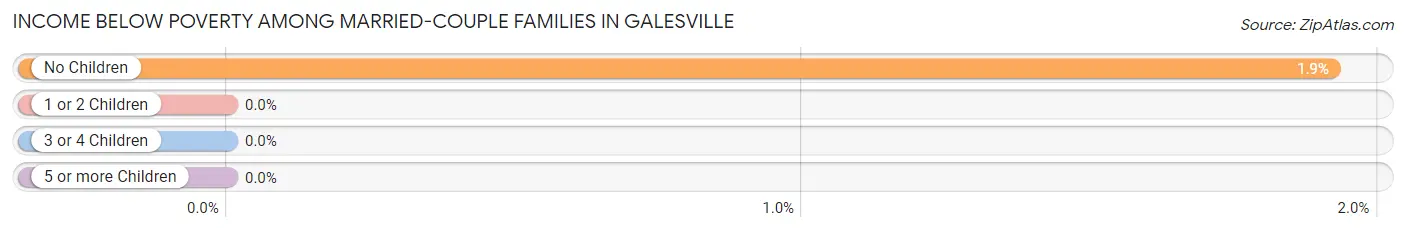
| Children | Above Poverty | Below Poverty |
| No Children | 153 (98.1%) | 3 (1.9%) |
| 1 or 2 Children | 69 (100.0%) | 0 (0.0%) |
| 3 or 4 Children | 44 (100.0%) | 0 (0.0%) |
| 5 or more Children | 0 (0.0%) | 0 (0.0%) |
| Total | 266 (98.9%) | 3 (1.1%) |
Income Below Poverty Among Single-Parent Households in Galesville
According to the poverty data in Galesville, 14.5% or 9 single-father households and 15.1% or 5 single-mother households are living below the poverty line. Among single-father households, those with 1 or 2 children have the highest poverty rate, with 9 households (23.7%) experiencing poverty. Likewise, among single-mother households, those with 3 or 4 children have the highest poverty rate, with 3 households (100.0%) falling below the poverty line.
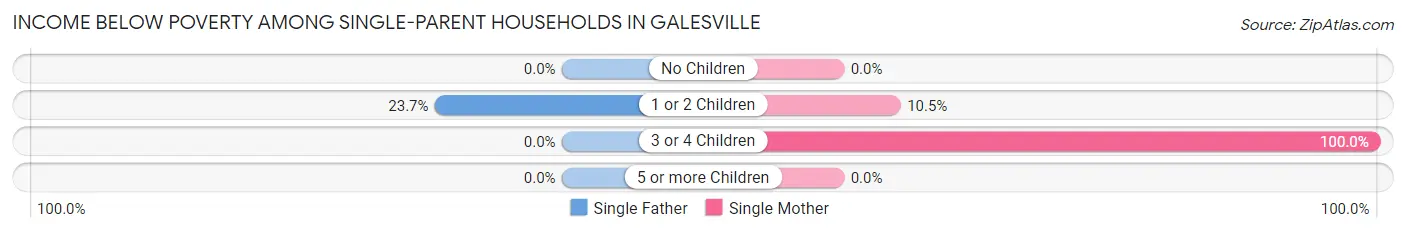
| Children | Single Father | Single Mother |
| No Children | 0 (0.0%) | 0 (0.0%) |
| 1 or 2 Children | 9 (23.7%) | 2 (10.5%) |
| 3 or 4 Children | 0 (0.0%) | 3 (100.0%) |
| 5 or more Children | 0 (0.0%) | 0 (0.0%) |
| Total | 9 (14.5%) | 5 (15.1%) |
Income Below Poverty Among Married-Couple vs Single-Parent Households in Galesville
The poverty data for Galesville shows that 3 of the married-couple family households (1.1%) and 14 of the single-parent households (14.7%) are living below the poverty level. Within the married-couple family households, those with no children have the highest poverty rate, with 3 households (1.9%) falling below the poverty line. Among the single-parent households, those with 3 or 4 children have the highest poverty rate, with 3 household (25.0%) living below poverty.
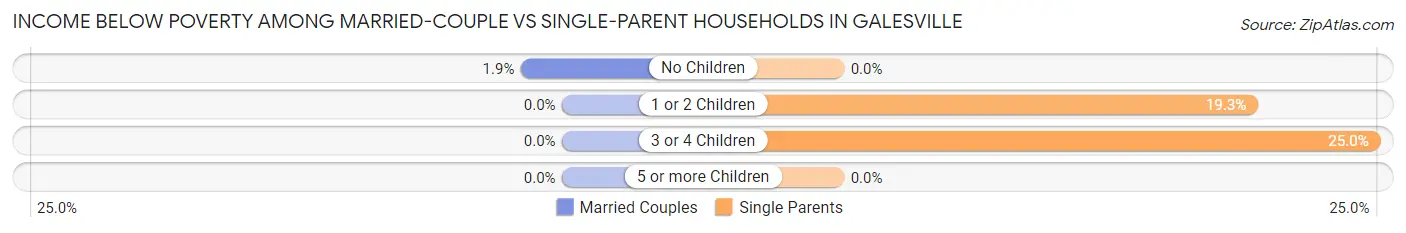
| Children | Married-Couple Families | Single-Parent Households |
| No Children | 3 (1.9%) | 0 (0.0%) |
| 1 or 2 Children | 0 (0.0%) | 11 (19.3%) |
| 3 or 4 Children | 0 (0.0%) | 3 (25.0%) |
| 5 or more Children | 0 (0.0%) | 0 (0.0%) |
| Total | 3 (1.1%) | 14 (14.7%) |
Race in Galesville
The most populous races in Galesville are White / Caucasian (1,535 | 97.0%), Two or more Races (38 | 2.4%), and Hispanic or Latino (9 | 0.6%).
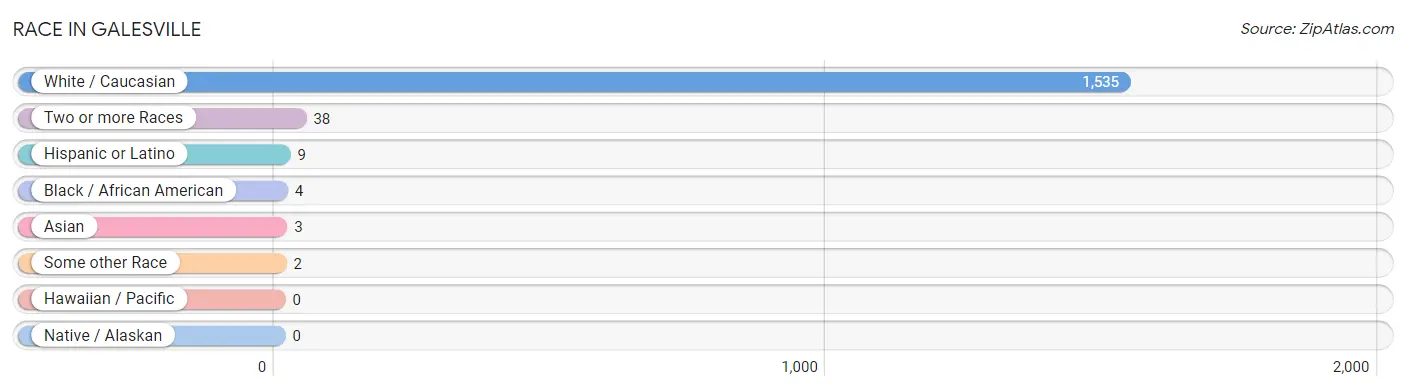
| Race | # Population | % Population |
| Asian | 3 | 0.2% |
| Black / African American | 4 | 0.3% |
| Hawaiian / Pacific | 0 | 0.0% |
| Hispanic or Latino | 9 | 0.6% |
| Native / Alaskan | 0 | 0.0% |
| White / Caucasian | 1,535 | 97.0% |
| Two or more Races | 38 | 2.4% |
| Some other Race | 2 | 0.1% |
| Total | 1,582 | 100.0% |
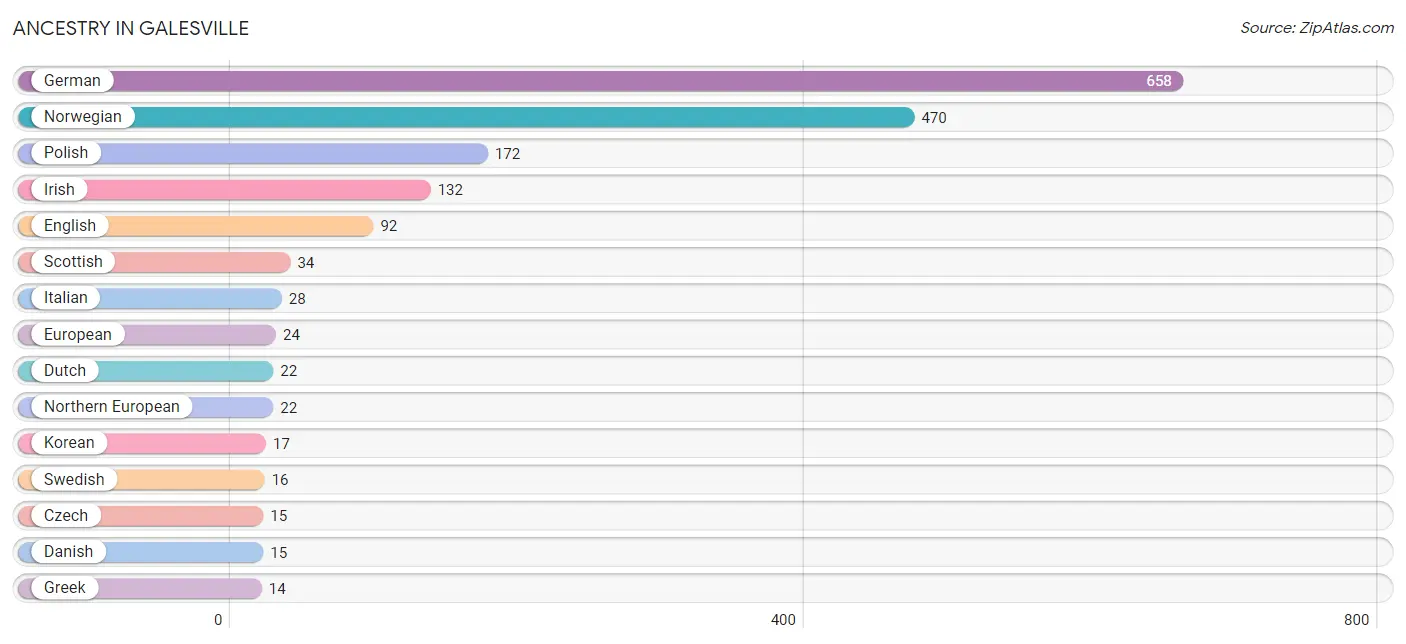
Ancestry in Galesville
The most populous ancestries reported in Galesville are German (658 | 41.6%), Norwegian (470 | 29.7%), Polish (172 | 10.9%), Irish (132 | 8.3%), and English (92 | 5.8%), together accounting for 96.3% of all Galesville residents.
| Ancestry | # Population | % Population |
| American | 10 | 0.6% |
| Austrian | 3 | 0.2% |
| Czech | 15 | 0.9% |
| Czechoslovakian | 3 | 0.2% |
| Danish | 15 | 0.9% |
| Dutch | 22 | 1.4% |
| Eastern European | 3 | 0.2% |
| English | 92 | 5.8% |
| European | 24 | 1.5% |
| Finnish | 10 | 0.6% |
| French | 7 | 0.4% |
| French Canadian | 12 | 0.8% |
| German | 658 | 41.6% |
| Greek | 14 | 0.9% |
| Irish | 132 | 8.3% |
| Italian | 28 | 1.8% |
| Korean | 17 | 1.1% |
| Mexican | 2 | 0.1% |
| Northern European | 22 | 1.4% |
| Norwegian | 470 | 29.7% |
| Peruvian | 7 | 0.4% |
| Polish | 172 | 10.9% |
| Scandinavian | 2 | 0.1% |
| Scotch-Irish | 5 | 0.3% |
| Scottish | 34 | 2.1% |
| South American | 7 | 0.4% |
| Swedish | 16 | 1.0% |
| Swiss | 4 | 0.3% |
| Ukrainian | 7 | 0.4% | View All 29 Rows |
Immigrants in Galesville
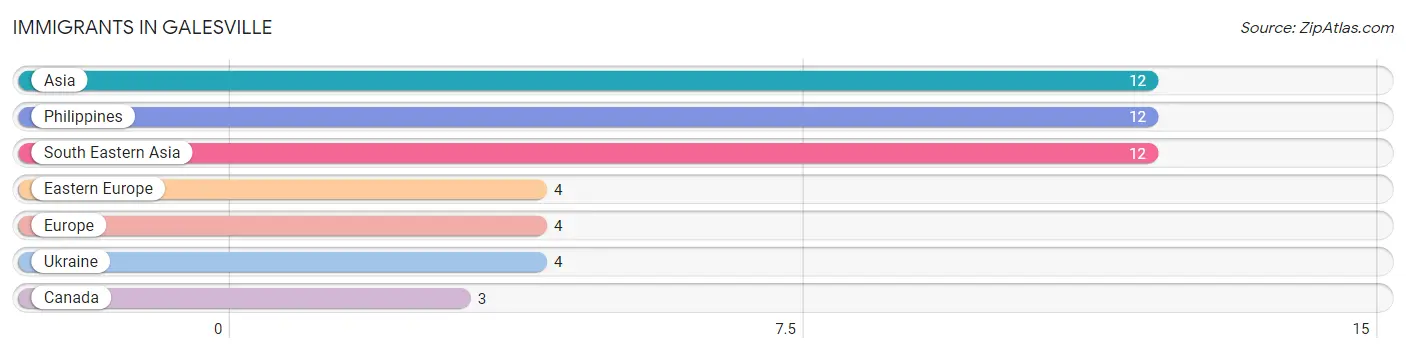
The most numerous immigrant groups reported in Galesville came from Asia (12 | 0.8%), Philippines (12 | 0.8%), South Eastern Asia (12 | 0.8%), Eastern Europe (4 | 0.3%), and Europe (4 | 0.3%), together accounting for 2.8% of all Galesville residents.
| Immigration Origin | # Population | % Population |
| Asia | 12 | 0.8% |
| Canada | 3 | 0.2% |
| Eastern Europe | 4 | 0.3% |
| Europe | 4 | 0.3% |
| Philippines | 12 | 0.8% |
| South Eastern Asia | 12 | 0.8% |
| Ukraine | 4 | 0.3% | View All 7 Rows |
Sex and Age in Galesville
Sex and Age in Galesville
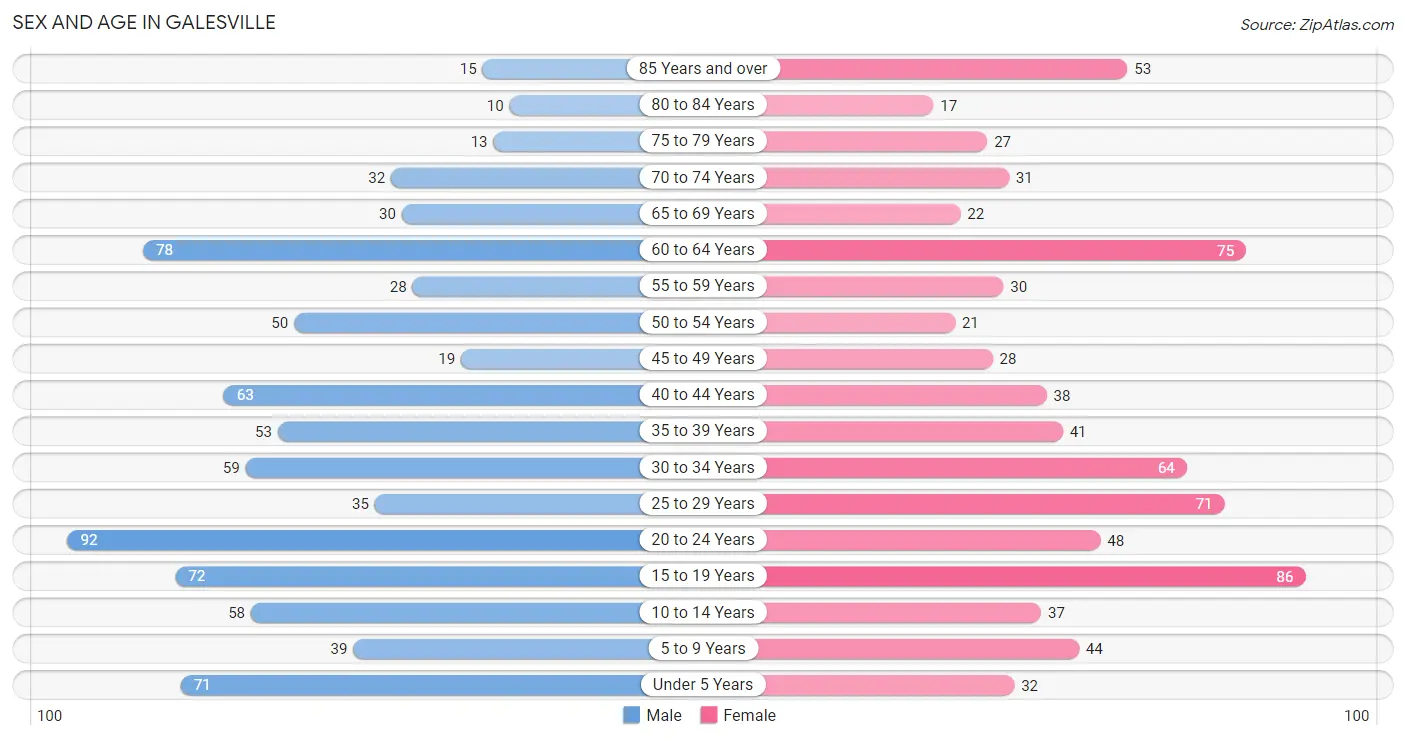
The most populous age groups in Galesville are 20 to 24 Years (92 | 11.3%) for men and 15 to 19 Years (86 | 11.2%) for women.
| Age Bracket | Male | Female |
| Under 5 Years | 71 (8.7%) | 32 (4.2%) |
| 5 to 9 Years | 39 (4.8%) | 44 (5.8%) |
| 10 to 14 Years | 58 (7.1%) | 37 (4.8%) |
| 15 to 19 Years | 72 (8.8%) | 86 (11.2%) |
| 20 to 24 Years | 92 (11.3%) | 48 (6.3%) |
| 25 to 29 Years | 35 (4.3%) | 71 (9.3%) |
| 30 to 34 Years | 59 (7.2%) | 64 (8.4%) |
| 35 to 39 Years | 53 (6.5%) | 41 (5.4%) |
| 40 to 44 Years | 63 (7.7%) | 38 (5.0%) |
| 45 to 49 Years | 19 (2.3%) | 28 (3.7%) |
| 50 to 54 Years | 50 (6.1%) | 21 (2.8%) |
| 55 to 59 Years | 28 (3.4%) | 30 (3.9%) |
| 60 to 64 Years | 78 (9.6%) | 75 (9.8%) |
| 65 to 69 Years | 30 (3.7%) | 22 (2.9%) |
| 70 to 74 Years | 32 (3.9%) | 31 (4.1%) |
| 75 to 79 Years | 13 (1.6%) | 27 (3.5%) |
| 80 to 84 Years | 10 (1.2%) | 17 (2.2%) |
| 85 Years and over | 15 (1.8%) | 53 (6.9%) |
| Total | 817 (100.0%) | 765 (100.0%) |
Families and Households in Galesville
Median Family Size in Galesville
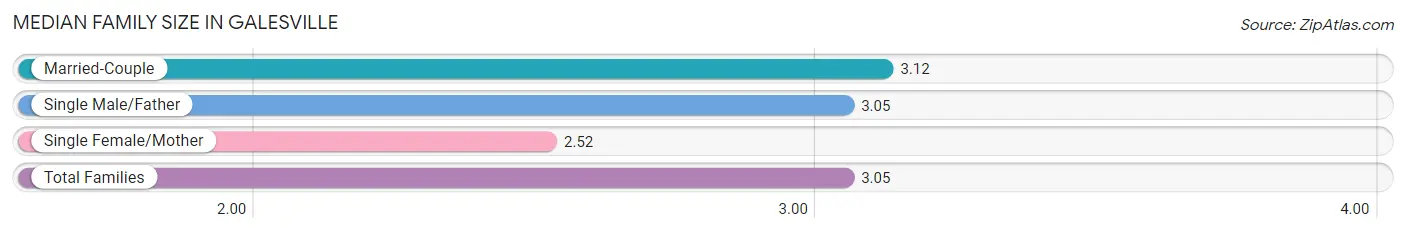
The median family size in Galesville is 3.05 persons per family, with married-couple families (269 | 73.9%) accounting for the largest median family size of 3.12 persons per family. On the other hand, single female/mother families (33 | 9.1%) represent the smallest median family size with 2.52 persons per family.
| Family Type | # Families | Family Size |
| Married-Couple | 269 (73.9%) | 3.12 |
| Single Male/Father | 62 (17.0%) | 3.05 |
| Single Female/Mother | 33 (9.1%) | 2.52 |
| Total Families | 364 (100.0%) | 3.05 |
Median Household Size in Galesville
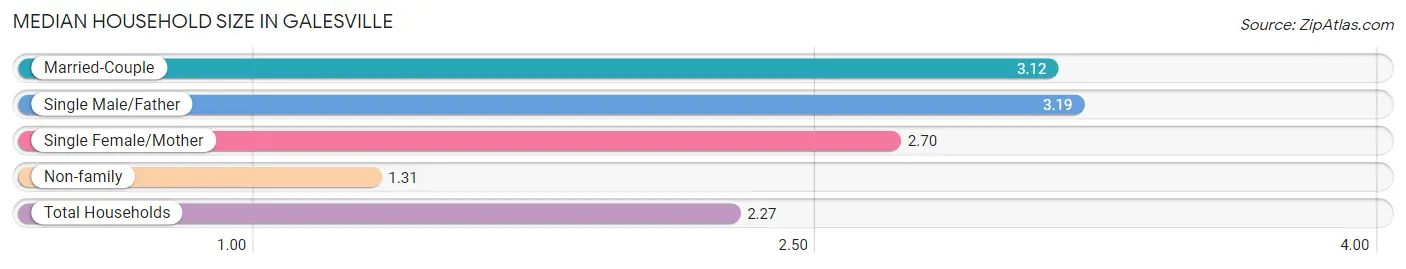
The median household size in Galesville is 2.27 persons per household, with single male/father households (62 | 9.1%) accounting for the largest median household size of 3.19 persons per household. non-family households (314 | 46.3%) represent the smallest median household size with 1.31 persons per household.
| Household Type | # Households | Household Size |
| Married-Couple | 269 (39.7%) | 3.12 |
| Single Male/Father | 62 (9.1%) | 3.19 |
| Single Female/Mother | 33 (4.9%) | 2.70 |
| Non-family | 314 (46.3%) | 1.31 |
| Total Households | 678 (100.0%) | 2.27 |
Household Size by Marriage Status in Galesville
Out of a total of 678 households in Galesville, 364 (53.7%) are family households, while 314 (46.3%) are nonfamily households. The most numerous type of family households are 2-person households, comprising 197, and the most common type of nonfamily households are 1-person households, comprising 228.
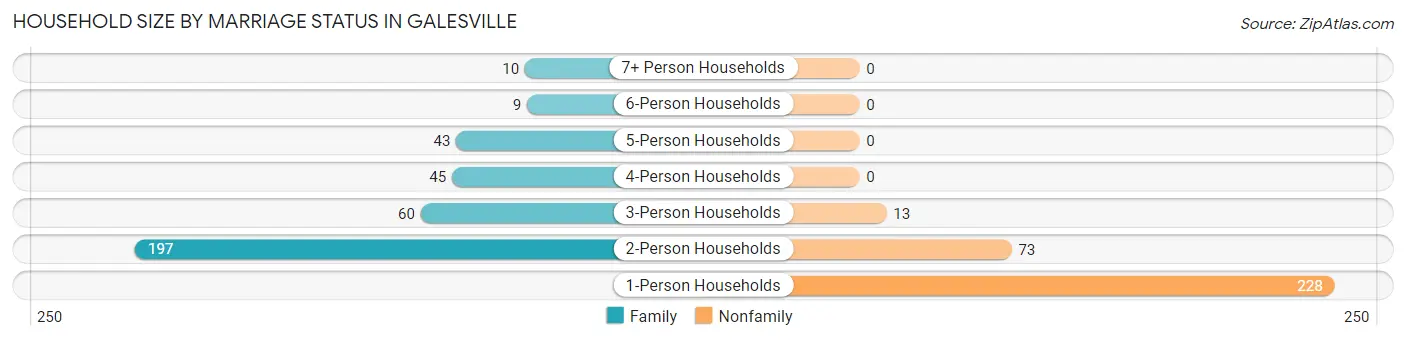
| Household Size | Family Households | Nonfamily Households |
| 1-Person Households | - | 228 (33.6%) |
| 2-Person Households | 197 (29.1%) | 73 (10.8%) |
| 3-Person Households | 60 (8.8%) | 13 (1.9%) |
| 4-Person Households | 45 (6.6%) | 0 (0.0%) |
| 5-Person Households | 43 (6.3%) | 0 (0.0%) |
| 6-Person Households | 9 (1.3%) | 0 (0.0%) |
| 7+ Person Households | 10 (1.5%) | 0 (0.0%) |
| Total | 364 (53.7%) | 314 (46.3%) |
Female Fertility in Galesville
Fertility by Age in Galesville
Average fertility rate in Galesville is 63.0 births per 1,000 women. Women in the age bracket of 20 to 34 years have the highest fertility rate with 98.0 births per 1,000 women. Women in the age bracket of 20 to 34 years acount for 75.0% of all women with births.
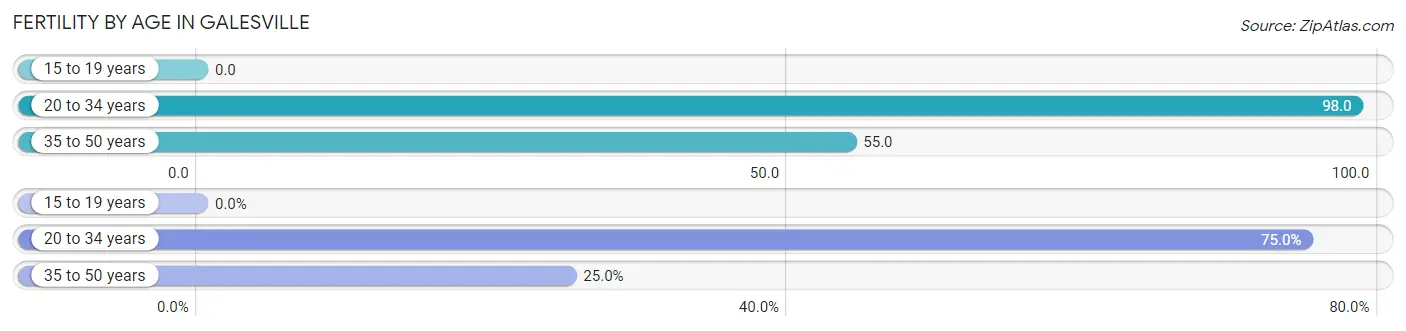
| Age Bracket | Women with Births | Births / 1,000 Women |
| 15 to 19 years | 0 (0.0%) | 0.0 |
| 20 to 34 years | 18 (75.0%) | 98.0 |
| 35 to 50 years | 6 (25.0%) | 55.0 |
| Total | 24 (100.0%) | 63.0 |
Fertility by Age by Marriage Status in Galesville
87.5% of women with births (24) in Galesville are married. The highest percentage of unmarried women with births falls into 20 to 34 years age bracket with 16.7% of them unmarried at the time of birth, while the lowest percentage of unmarried women with births belong to 35 to 50 years age bracket with 0.0% of them unmarried.
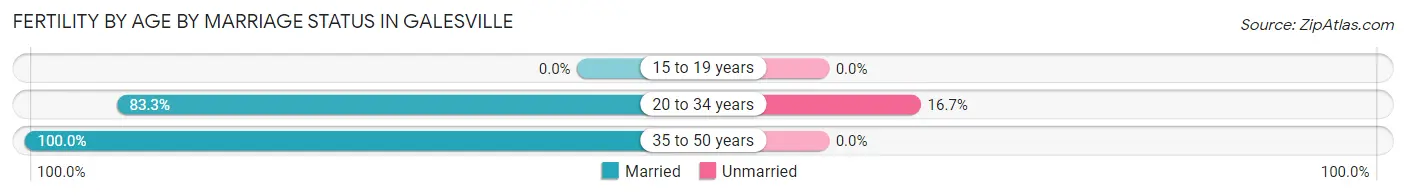
| Age Bracket | Married | Unmarried |
| 15 to 19 years | 0 (0.0%) | 0 (0.0%) |
| 20 to 34 years | 15 (83.3%) | 3 (16.7%) |
| 35 to 50 years | 6 (100.0%) | 0 (0.0%) |
| Total | 21 (87.5%) | 3 (12.5%) |
Fertility by Education in Galesville
Average fertility rate in Galesville is 63.0 births per 1,000 women. Women with the education attainment of graduate degree have the highest fertility rate of 214.0 births per 1,000 women, while women with the education attainment of high school diploma have the lowest fertility at 23.0 births per 1,000 women. Women with the education attainment of bachelor's degree represent 37.5% of all women with births.
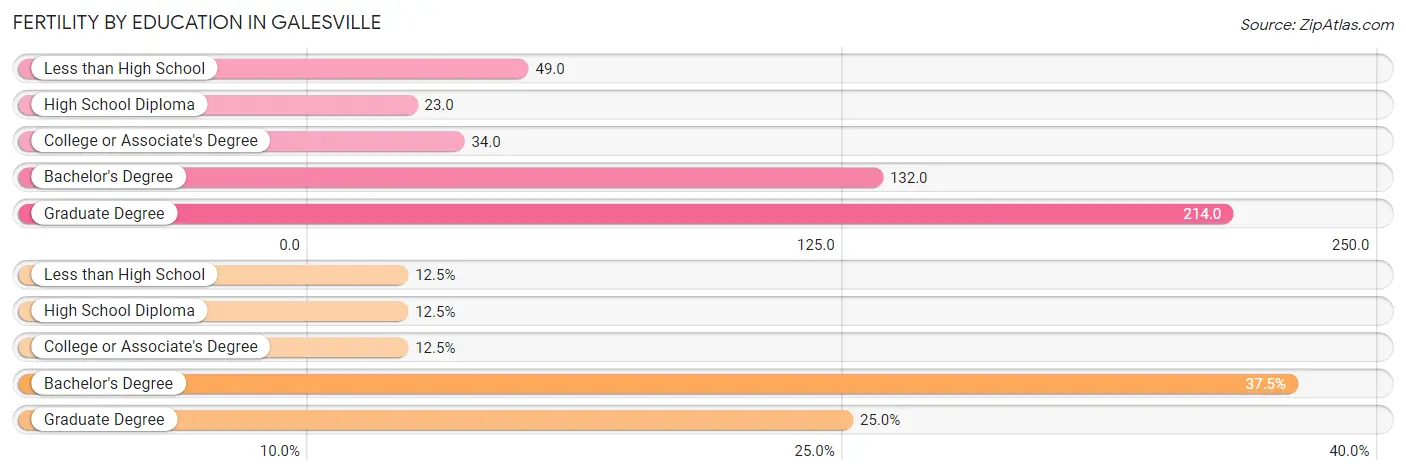
| Educational Attainment | Women with Births | Births / 1,000 Women |
| Less than High School | 3 (12.5%) | 49.0 |
| High School Diploma | 3 (12.5%) | 23.0 |
| College or Associate's Degree | 3 (12.5%) | 34.0 |
| Bachelor's Degree | 9 (37.5%) | 132.0 |
| Graduate Degree | 6 (25.0%) | 214.0 |
| Total | 24 (100.0%) | 63.0 |
Fertility by Education by Marriage Status in Galesville
12.5% of women with births in Galesville are unmarried. Women with the educational attainment of high school diploma are most likely to be married with 100.0% of them married at childbirth, while women with the educational attainment of less than high school are least likely to be married with 100.0% of them unmarried at childbirth.
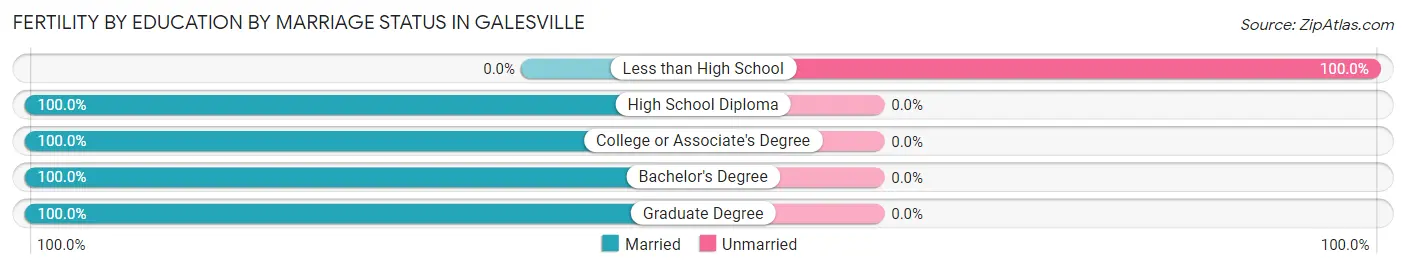
| Educational Attainment | Married | Unmarried |
| Less than High School | 0 (0.0%) | 3 (100.0%) |
| High School Diploma | 3 (100.0%) | 0 (0.0%) |
| College or Associate's Degree | 3 (100.0%) | 0 (0.0%) |
| Bachelor's Degree | 9 (100.0%) | 0 (0.0%) |
| Graduate Degree | 6 (100.0%) | 0 (0.0%) |
| Total | 21 (87.5%) | 3 (12.5%) |
Employment Characteristics in Galesville
Employment by Class of Employer in Galesville
Among the 889 employed individuals in Galesville, private company employees (674 | 75.8%), self-employed (not incorporated) (62 | 7.0%), and not-for-profit organizations (51 | 5.7%) make up the most common classes of employment.
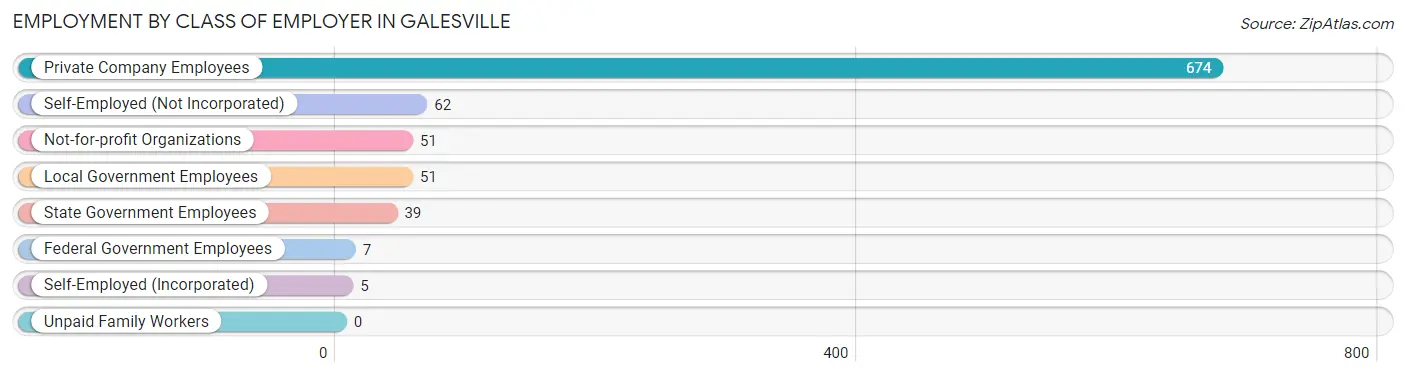
| Employer Class | # Employees | % Employees |
| Private Company Employees | 674 | 75.8% |
| Self-Employed (Incorporated) | 5 | 0.6% |
| Self-Employed (Not Incorporated) | 62 | 7.0% |
| Not-for-profit Organizations | 51 | 5.7% |
| Local Government Employees | 51 | 5.7% |
| State Government Employees | 39 | 4.4% |
| Federal Government Employees | 7 | 0.8% |
| Unpaid Family Workers | 0 | 0.0% |
| Total | 889 | 100.0% |
Employment Status by Age in Galesville
According to the labor force statistics for Galesville, out of the total population over 16 years of age (1,264), 72.5% or 916 individuals are in the labor force, with 0.3% or 3 of them unemployed. The age group with the highest labor force participation rate is 20 to 24 years, with 93.6% or 131 individuals in the labor force. Within the labor force, the 55 to 59 years age range has the highest percentage of unemployed individuals, with 6.5% or 3 of them being unemployed.
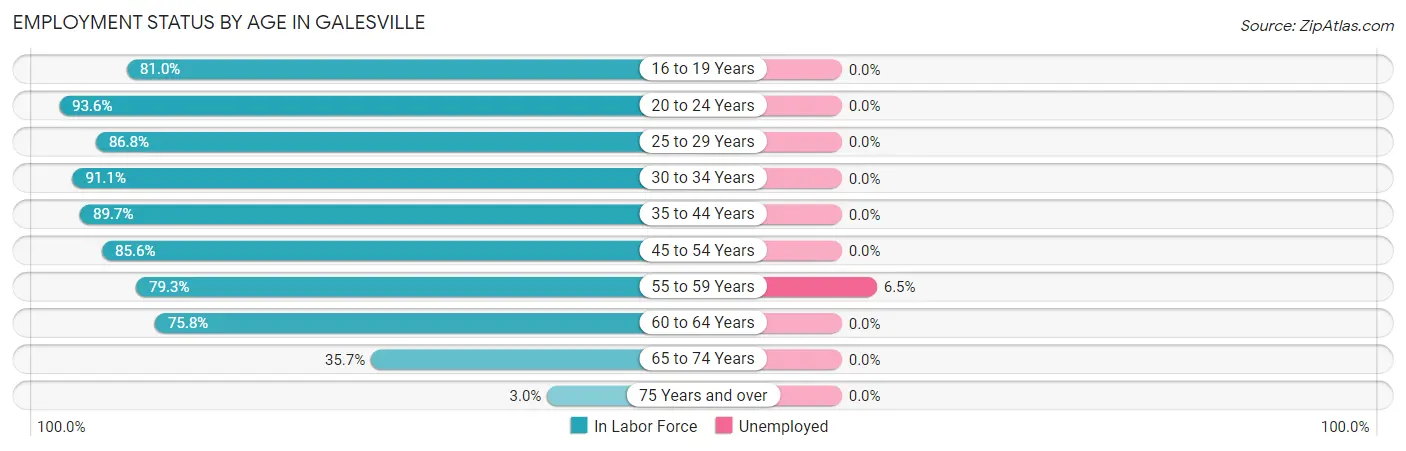
| Age Bracket | In Labor Force | Unemployed |
| 16 to 19 Years | 98 (81.0%) | 0 (0.0%) |
| 20 to 24 Years | 131 (93.6%) | 0 (0.0%) |
| 25 to 29 Years | 92 (86.8%) | 0 (0.0%) |
| 30 to 34 Years | 112 (91.1%) | 0 (0.0%) |
| 35 to 44 Years | 175 (89.7%) | 0 (0.0%) |
| 45 to 54 Years | 101 (85.6%) | 0 (0.0%) |
| 55 to 59 Years | 46 (79.3%) | 3 (6.5%) |
| 60 to 64 Years | 116 (75.8%) | 0 (0.0%) |
| 65 to 74 Years | 41 (35.7%) | 0 (0.0%) |
| 75 Years and over | 4 (3.0%) | 0 (0.0%) |
| Total | 916 (72.5%) | 3 (0.3%) |
Employment Status by Educational Attainment in Galesville
According to labor force statistics for Galesville, 85.3% of individuals (642) out of the total population between 25 and 64 years of age (753) are in the labor force, with 0.5% or 3 of them being unemployed. The group with the highest labor force participation rate are those with the educational attainment of less than high school, with 100.0% or 24 individuals in the labor force. Within the labor force, individuals with less than high school education have the highest percentage of unemployment, with 12.5% or 3 of them being unemployed.
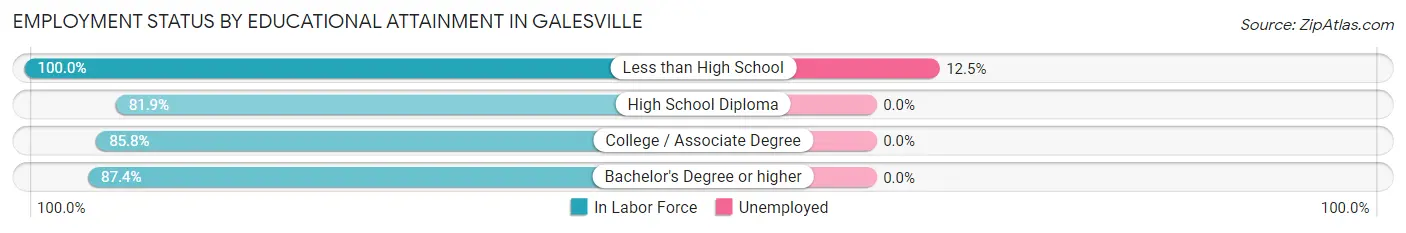
| Educational Attainment | In Labor Force | Unemployed |
| Less than High School | 24 (100.0%) | 3 (12.5%) |
| High School Diploma | 221 (81.9%) | 0 (0.0%) |
| College / Associate Degree | 230 (85.8%) | 0 (0.0%) |
| Bachelor's Degree or higher | 167 (87.4%) | 0 (0.0%) |
| Total | 642 (85.3%) | 4 (0.5%) |
Employment Occupations by Sex in Galesville
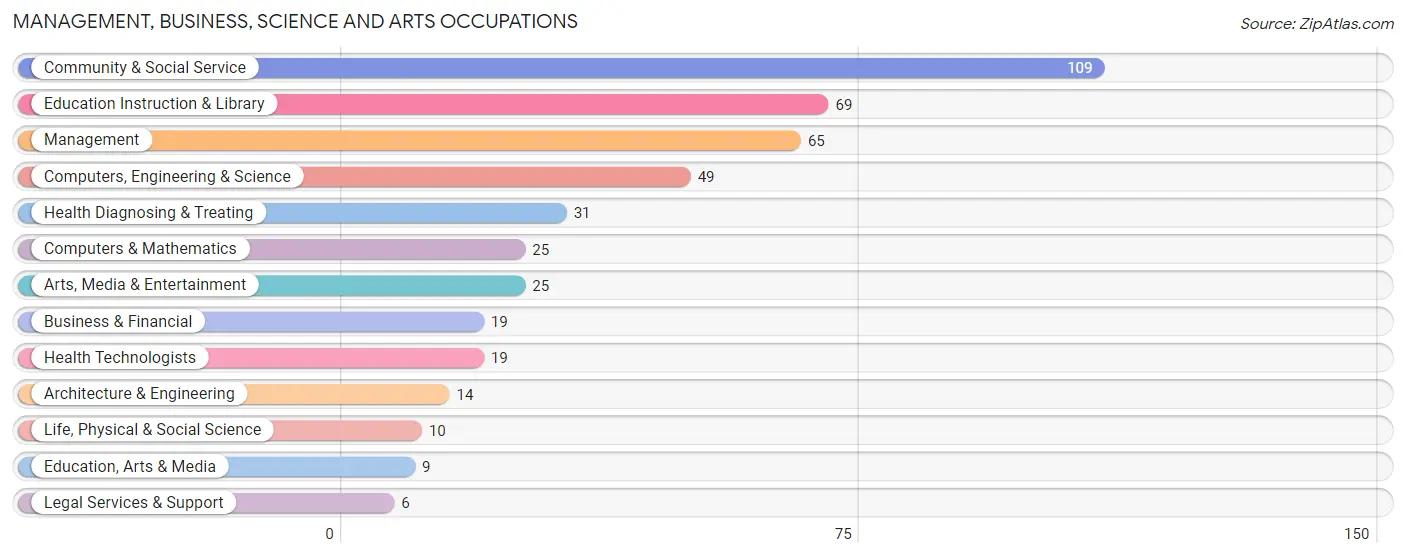
Management, Business, Science and Arts Occupations
The most common Management, Business, Science and Arts occupations in Galesville are Community & Social Service (109 | 11.9%), Education Instruction & Library (69 | 7.6%), Management (65 | 7.1%), Computers, Engineering & Science (49 | 5.4%), and Health Diagnosing & Treating (31 | 3.4%).
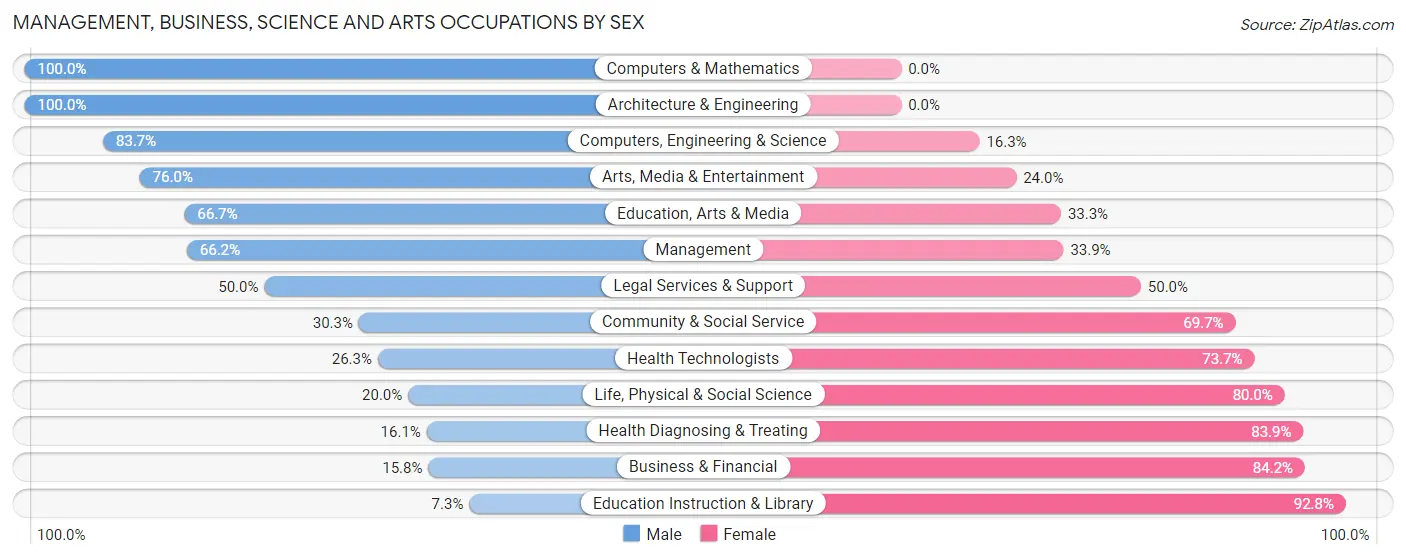
Management, Business, Science and Arts Occupations by Sex
Within the Management, Business, Science and Arts occupations in Galesville, the most male-oriented occupations are Computers & Mathematics (100.0%), Architecture & Engineering (100.0%), and Computers, Engineering & Science (83.7%), while the most female-oriented occupations are Education Instruction & Library (92.7%), Business & Financial (84.2%), and Health Diagnosing & Treating (83.9%).
| Occupation | Male | Female |
| Management | 43 (66.1%) | 22 (33.9%) |
| Business & Financial | 3 (15.8%) | 16 (84.2%) |
| Computers, Engineering & Science | 41 (83.7%) | 8 (16.3%) |
| Computers & Mathematics | 25 (100.0%) | 0 (0.0%) |
| Architecture & Engineering | 14 (100.0%) | 0 (0.0%) |
| Life, Physical & Social Science | 2 (20.0%) | 8 (80.0%) |
| Community & Social Service | 33 (30.3%) | 76 (69.7%) |
| Education, Arts & Media | 6 (66.7%) | 3 (33.3%) |
| Legal Services & Support | 3 (50.0%) | 3 (50.0%) |
| Education Instruction & Library | 5 (7.2%) | 64 (92.7%) |
| Arts, Media & Entertainment | 19 (76.0%) | 6 (24.0%) |
| Health Diagnosing & Treating | 5 (16.1%) | 26 (83.9%) |
| Health Technologists | 5 (26.3%) | 14 (73.7%) |
| Total (Category) | 125 (45.8%) | 148 (54.2%) |
| Total (Overall) | 477 (52.2%) | 436 (47.7%) |
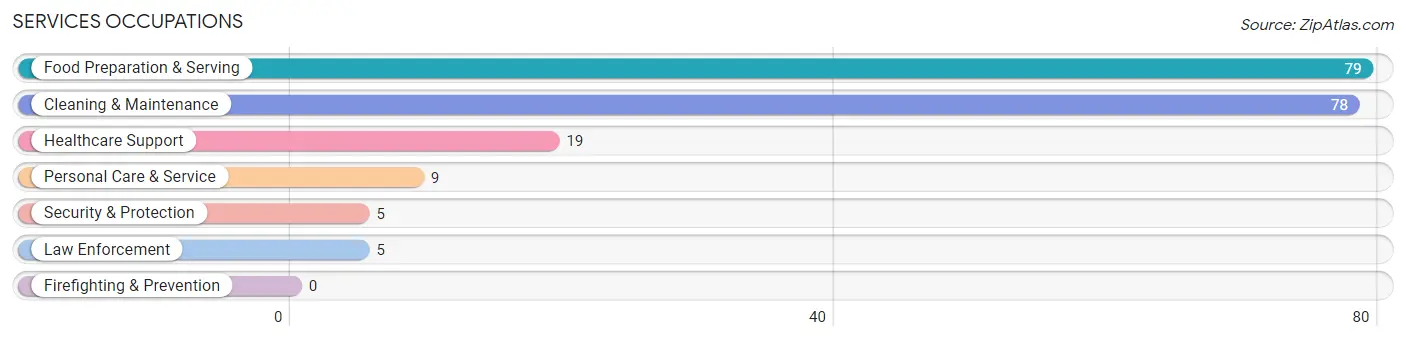
Services Occupations
The most common Services occupations in Galesville are Food Preparation & Serving (79 | 8.6%), Cleaning & Maintenance (78 | 8.5%), Healthcare Support (19 | 2.1%), Personal Care & Service (9 | 1.0%), and Security & Protection (5 | 0.5%).
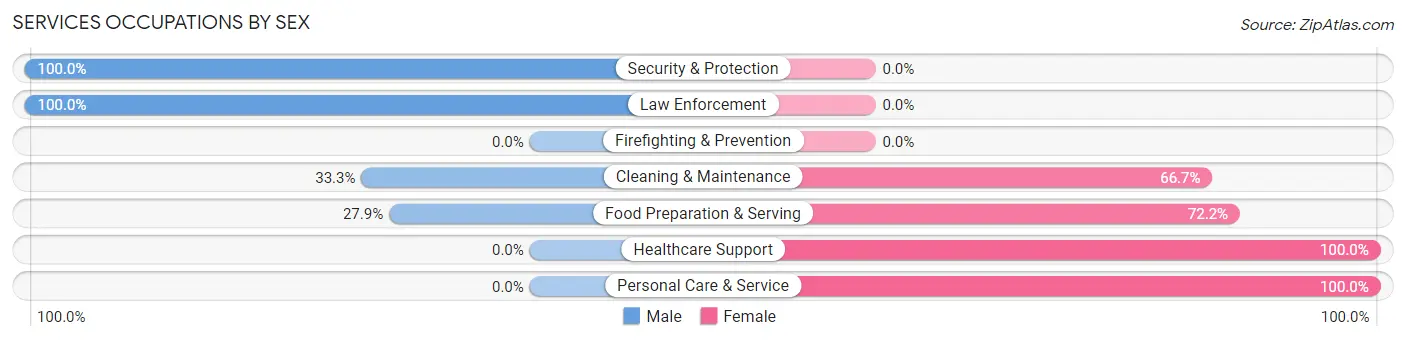
Services Occupations by Sex
Within the Services occupations in Galesville, the most male-oriented occupations are Security & Protection (100.0%), Law Enforcement (100.0%), and Cleaning & Maintenance (33.3%), while the most female-oriented occupations are Healthcare Support (100.0%), Personal Care & Service (100.0%), and Food Preparation & Serving (72.2%).
| Occupation | Male | Female |
| Healthcare Support | 0 (0.0%) | 19 (100.0%) |
| Security & Protection | 5 (100.0%) | 0 (0.0%) |
| Firefighting & Prevention | 0 (0.0%) | 0 (0.0%) |
| Law Enforcement | 5 (100.0%) | 0 (0.0%) |
| Food Preparation & Serving | 22 (27.9%) | 57 (72.2%) |
| Cleaning & Maintenance | 26 (33.3%) | 52 (66.7%) |
| Personal Care & Service | 0 (0.0%) | 9 (100.0%) |
| Total (Category) | 53 (27.9%) | 137 (72.1%) |
| Total (Overall) | 477 (52.2%) | 436 (47.7%) |
Sales and Office Occupations
The most common Sales and Office occupations in Galesville are Office & Administration (114 | 12.5%), and Sales & Related (77 | 8.4%).

Sales and Office Occupations by Sex

| Occupation | Male | Female |
| Sales & Related | 45 (58.4%) | 32 (41.6%) |
| Office & Administration | 21 (18.4%) | 93 (81.6%) |
| Total (Category) | 66 (34.5%) | 125 (65.4%) |
| Total (Overall) | 477 (52.2%) | 436 (47.7%) |
Natural Resources, Construction and Maintenance Occupations
The most common Natural Resources, Construction and Maintenance occupations in Galesville are Construction & Extraction (38 | 4.2%), and Installation, Maintenance & Repair (26 | 2.9%).

Natural Resources, Construction and Maintenance Occupations by Sex

| Occupation | Male | Female |
| Farming, Fishing & Forestry | 0 (0.0%) | 0 (0.0%) |
| Construction & Extraction | 38 (100.0%) | 0 (0.0%) |
| Installation, Maintenance & Repair | 26 (100.0%) | 0 (0.0%) |
| Total (Category) | 64 (100.0%) | 0 (0.0%) |
| Total (Overall) | 477 (52.2%) | 436 (47.7%) |
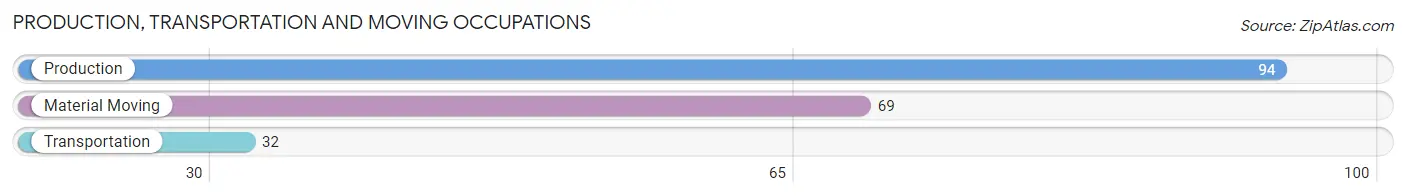
Production, Transportation and Moving Occupations
The most common Production, Transportation and Moving occupations in Galesville are Production (94 | 10.3%), Material Moving (69 | 7.6%), and Transportation (32 | 3.5%).
Production, Transportation and Moving Occupations by Sex
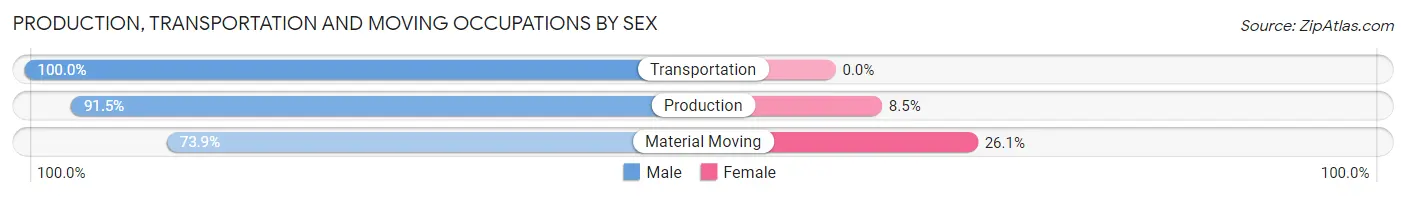
| Occupation | Male | Female |
| Production | 86 (91.5%) | 8 (8.5%) |
| Transportation | 32 (100.0%) | 0 (0.0%) |
| Material Moving | 51 (73.9%) | 18 (26.1%) |
| Total (Category) | 169 (86.7%) | 26 (13.3%) |
| Total (Overall) | 477 (52.2%) | 436 (47.7%) |
Employment Industries by Sex in Galesville
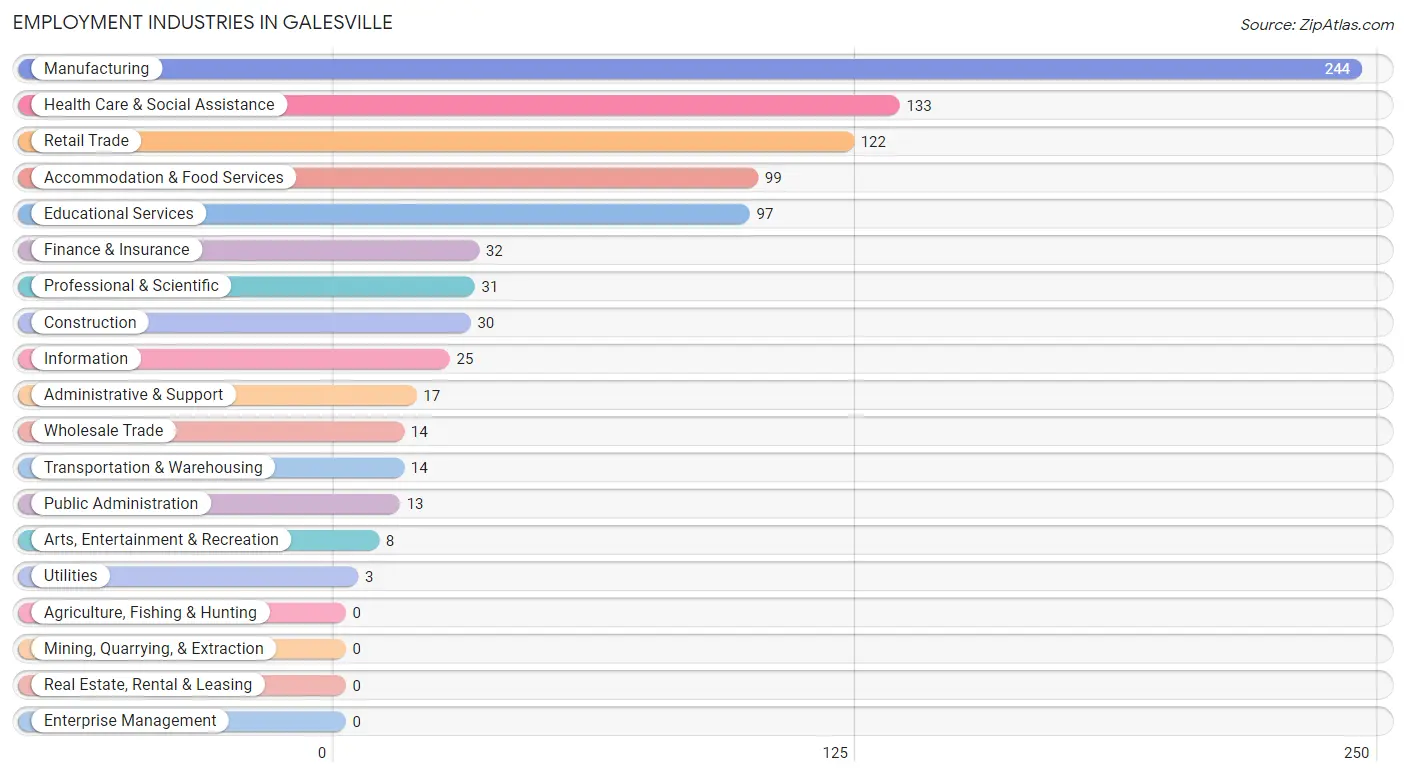
Employment Industries in Galesville
The major employment industries in Galesville include Manufacturing (244 | 26.7%), Health Care & Social Assistance (133 | 14.6%), Retail Trade (122 | 13.4%), Accommodation & Food Services (99 | 10.8%), and Educational Services (97 | 10.6%).
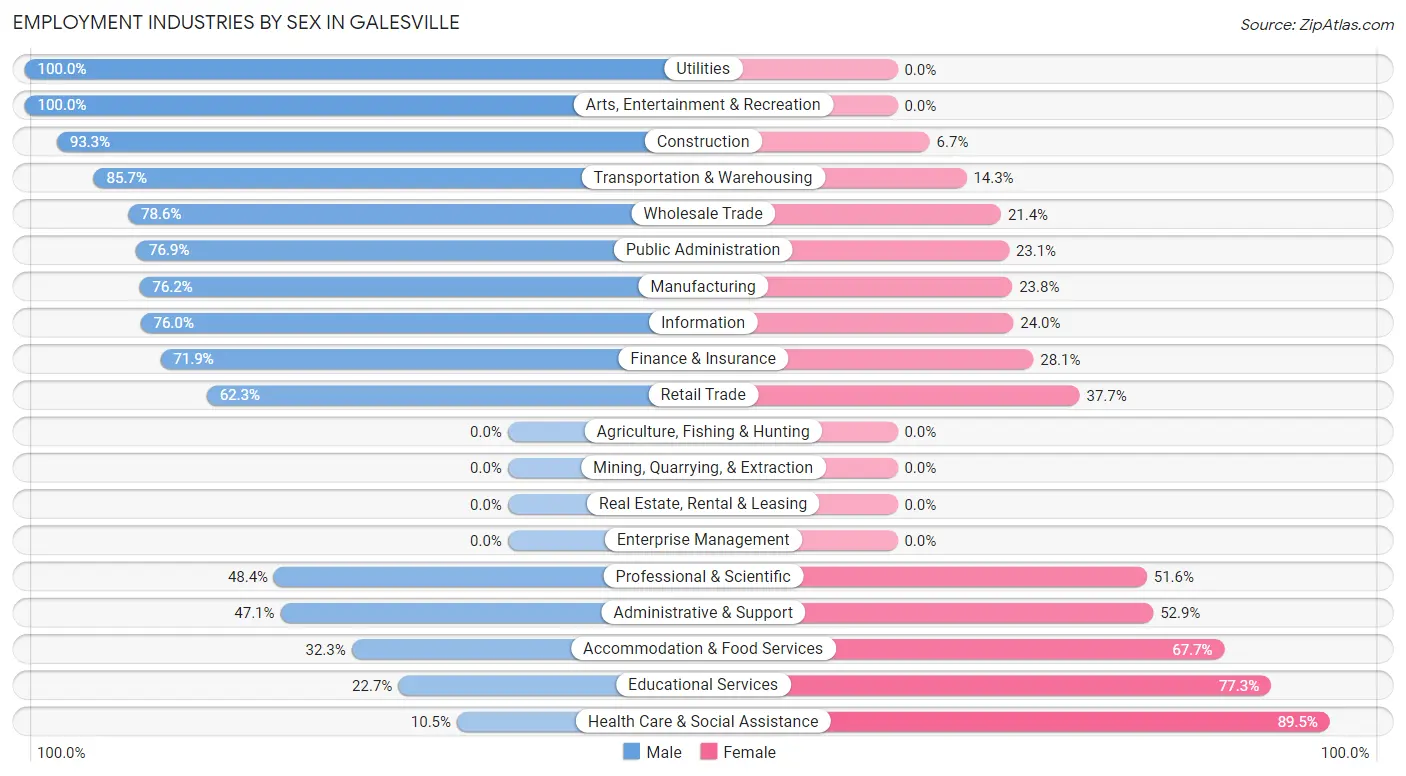
Employment Industries by Sex in Galesville
The Galesville industries that see more men than women are Utilities (100.0%), Arts, Entertainment & Recreation (100.0%), and Construction (93.3%), whereas the industries that tend to have a higher number of women are Health Care & Social Assistance (89.5%), Educational Services (77.3%), and Accommodation & Food Services (67.7%).
| Industry | Male | Female |
| Agriculture, Fishing & Hunting | 0 (0.0%) | 0 (0.0%) |
| Mining, Quarrying, & Extraction | 0 (0.0%) | 0 (0.0%) |
| Construction | 28 (93.3%) | 2 (6.7%) |
| Manufacturing | 186 (76.2%) | 58 (23.8%) |
| Wholesale Trade | 11 (78.6%) | 3 (21.4%) |
| Retail Trade | 76 (62.3%) | 46 (37.7%) |
| Transportation & Warehousing | 12 (85.7%) | 2 (14.3%) |
| Utilities | 3 (100.0%) | 0 (0.0%) |
| Information | 19 (76.0%) | 6 (24.0%) |
| Finance & Insurance | 23 (71.9%) | 9 (28.1%) |
| Real Estate, Rental & Leasing | 0 (0.0%) | 0 (0.0%) |
| Professional & Scientific | 15 (48.4%) | 16 (51.6%) |
| Enterprise Management | 0 (0.0%) | 0 (0.0%) |
| Administrative & Support | 8 (47.1%) | 9 (52.9%) |
| Educational Services | 22 (22.7%) | 75 (77.3%) |
| Health Care & Social Assistance | 14 (10.5%) | 119 (89.5%) |
| Arts, Entertainment & Recreation | 8 (100.0%) | 0 (0.0%) |
| Accommodation & Food Services | 32 (32.3%) | 67 (67.7%) |
| Public Administration | 10 (76.9%) | 3 (23.1%) |
| Total | 477 (52.2%) | 436 (47.7%) |
Education in Galesville
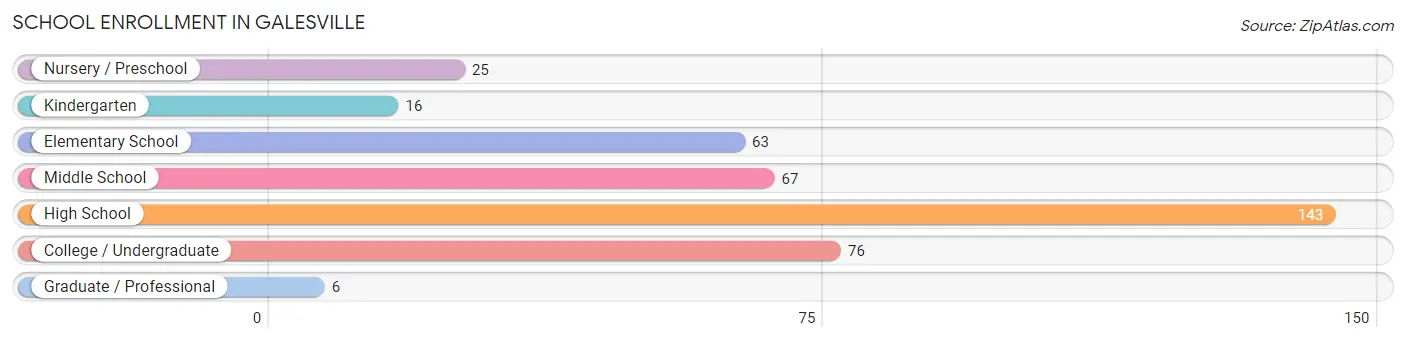
School Enrollment in Galesville
The most common levels of schooling among the 396 students in Galesville are high school (143 | 36.1%), college / undergraduate (76 | 19.2%), and middle school (67 | 16.9%).
| School Level | # Students | % Students |
| Nursery / Preschool | 25 | 6.3% |
| Kindergarten | 16 | 4.0% |
| Elementary School | 63 | 15.9% |
| Middle School | 67 | 16.9% |
| High School | 143 | 36.1% |
| College / Undergraduate | 76 | 19.2% |
| Graduate / Professional | 6 | 1.5% |
| Total | 396 | 100.0% |
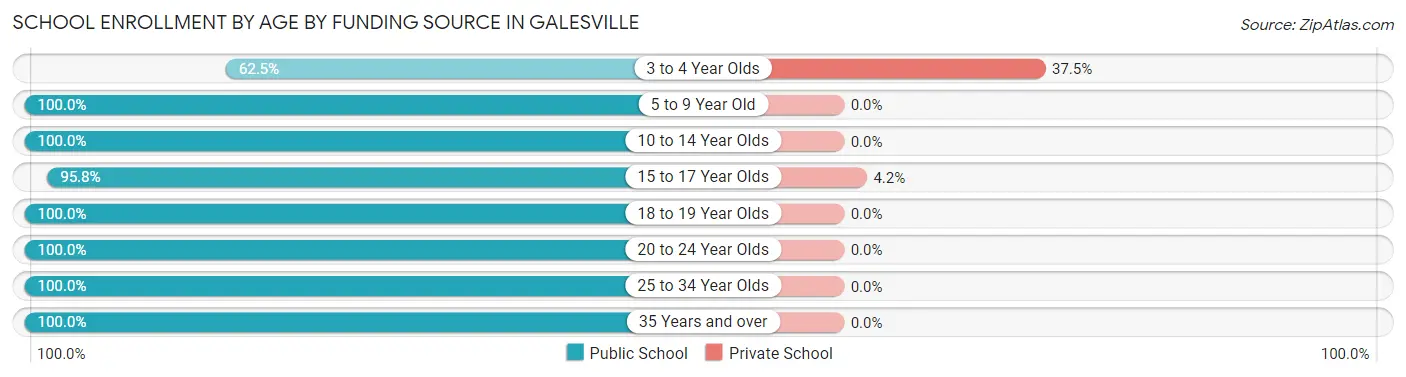
School Enrollment by Age by Funding Source in Galesville
Out of a total of 396 students who are enrolled in schools in Galesville, 8 (2.0%) attend a private institution, while the remaining 388 (98.0%) are enrolled in public schools. The age group of 3 to 4 year olds has the highest likelihood of being enrolled in private schools, with 3 (37.5% in the age bracket) enrolled. Conversely, the age group of 5 to 9 year old has the lowest likelihood of being enrolled in a private school, with 83 (100.0% in the age bracket) attending a public institution.
| Age Bracket | Public School | Private School |
| 3 to 4 Year Olds | 5 (62.5%) | 3 (37.5%) |
| 5 to 9 Year Old | 83 (100.0%) | 0 (0.0%) |
| 10 to 14 Year Olds | 92 (100.0%) | 0 (0.0%) |
| 15 to 17 Year Olds | 113 (95.8%) | 5 (4.2%) |
| 18 to 19 Year Olds | 27 (100.0%) | 0 (0.0%) |
| 20 to 24 Year Olds | 36 (100.0%) | 0 (0.0%) |
| 25 to 34 Year Olds | 27 (100.0%) | 0 (0.0%) |
| 35 Years and over | 5 (100.0%) | 0 (0.0%) |
| Total | 388 (98.0%) | 8 (2.0%) |
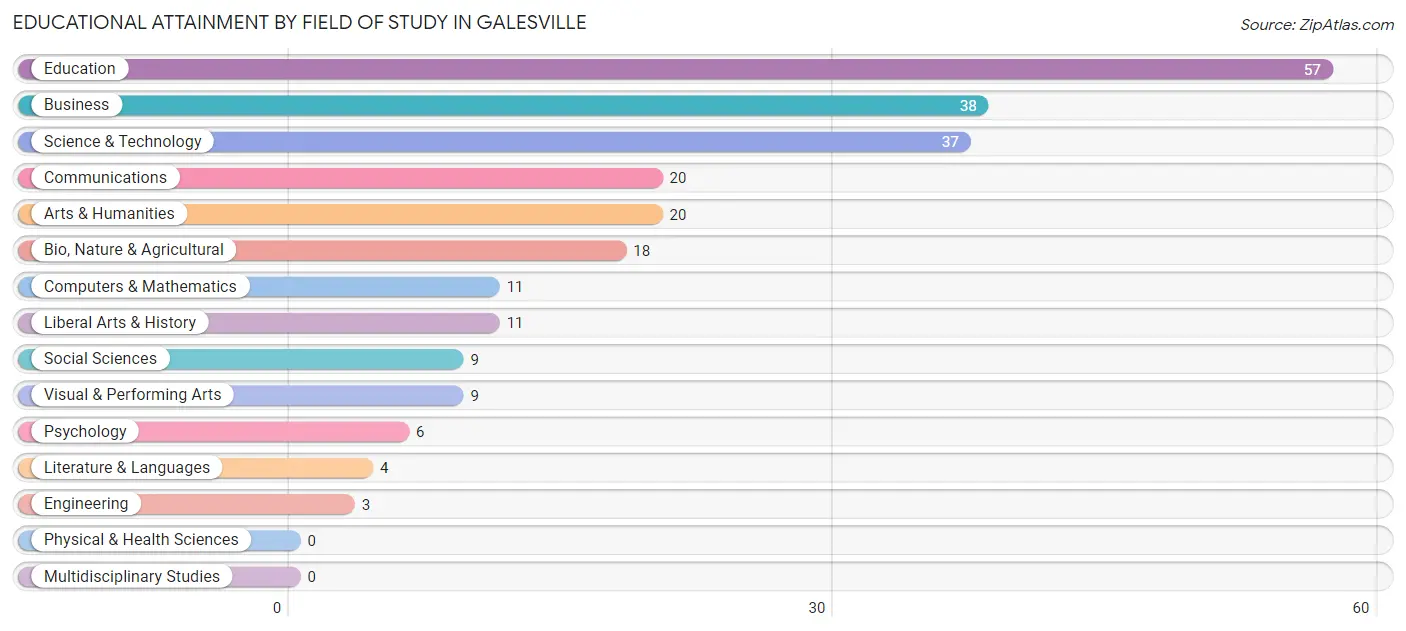
Educational Attainment by Field of Study in Galesville
Education (57 | 23.5%), business (38 | 15.6%), science & technology (37 | 15.2%), communications (20 | 8.2%), and arts & humanities (20 | 8.2%) are the most common fields of study among 243 individuals in Galesville who have obtained a bachelor's degree or higher.
| Field of Study | # Graduates | % Graduates |
| Computers & Mathematics | 11 | 4.5% |
| Bio, Nature & Agricultural | 18 | 7.4% |
| Physical & Health Sciences | 0 | 0.0% |
| Psychology | 6 | 2.5% |
| Social Sciences | 9 | 3.7% |
| Engineering | 3 | 1.2% |
| Multidisciplinary Studies | 0 | 0.0% |
| Science & Technology | 37 | 15.2% |
| Business | 38 | 15.6% |
| Education | 57 | 23.5% |
| Literature & Languages | 4 | 1.7% |
| Liberal Arts & History | 11 | 4.5% |
| Visual & Performing Arts | 9 | 3.7% |
| Communications | 20 | 8.2% |
| Arts & Humanities | 20 | 8.2% |
| Total | 243 | 100.0% |
Transportation & Commute in Galesville
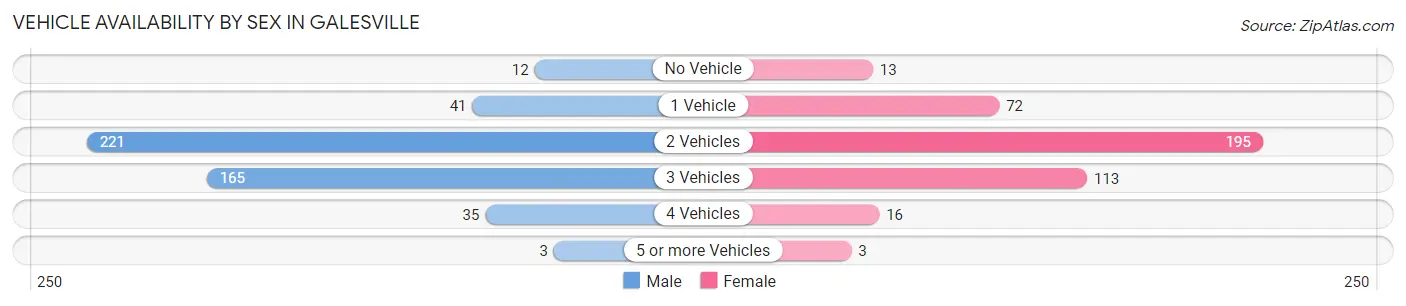
Vehicle Availability by Sex in Galesville
The most prevalent vehicle ownership categories in Galesville are males with 2 vehicles (221, accounting for 46.3%) and females with 2 vehicles (195, making up 53.6%).
| Vehicles Available | Male | Female |
| No Vehicle | 12 (2.5%) | 13 (3.2%) |
| 1 Vehicle | 41 (8.6%) | 72 (17.5%) |
| 2 Vehicles | 221 (46.3%) | 195 (47.3%) |
| 3 Vehicles | 165 (34.6%) | 113 (27.4%) |
| 4 Vehicles | 35 (7.3%) | 16 (3.9%) |
| 5 or more Vehicles | 3 (0.6%) | 3 (0.7%) |
| Total | 477 (100.0%) | 412 (100.0%) |
Commute Time in Galesville
The most frequently occuring commute durations in Galesville are 25 to 29 minutes (161 commuters, 20.3%), 30 to 34 minutes (136 commuters, 17.1%), and 20 to 24 minutes (116 commuters, 14.6%).
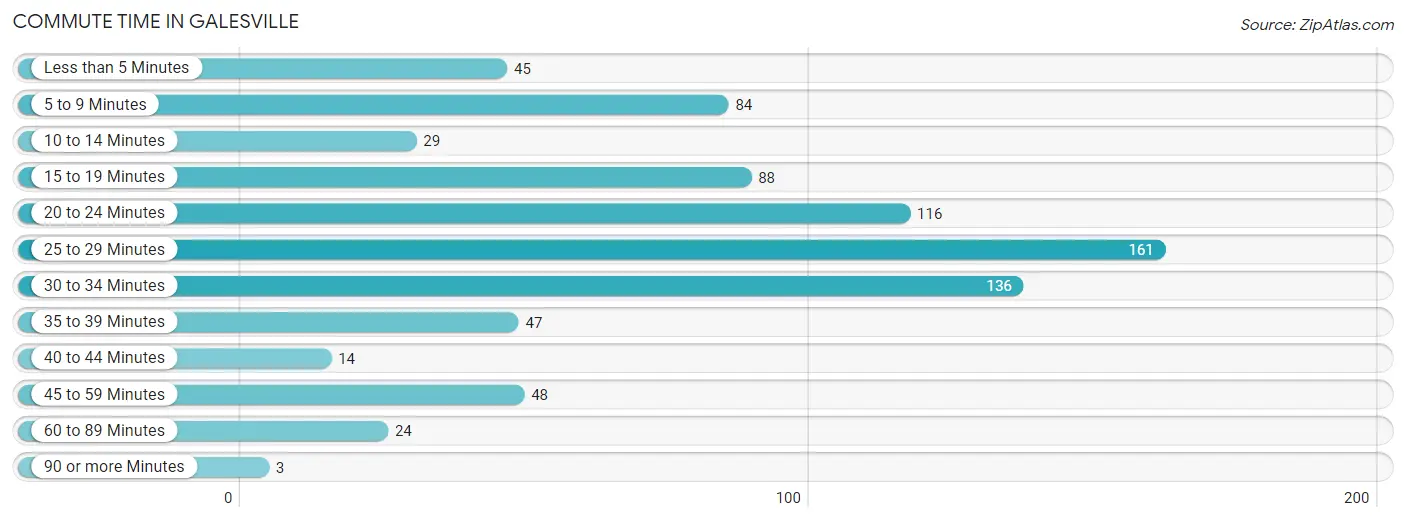
| Commute Time | # Commuters | % Commuters |
| Less than 5 Minutes | 45 | 5.7% |
| 5 to 9 Minutes | 84 | 10.6% |
| 10 to 14 Minutes | 29 | 3.6% |
| 15 to 19 Minutes | 88 | 11.1% |
| 20 to 24 Minutes | 116 | 14.6% |
| 25 to 29 Minutes | 161 | 20.3% |
| 30 to 34 Minutes | 136 | 17.1% |
| 35 to 39 Minutes | 47 | 5.9% |
| 40 to 44 Minutes | 14 | 1.8% |
| 45 to 59 Minutes | 48 | 6.0% |
| 60 to 89 Minutes | 24 | 3.0% |
| 90 or more Minutes | 3 | 0.4% |
Commute Time by Sex in Galesville
The most common commute times in Galesville are 30 to 34 minutes (102 commuters, 23.8%) for males and 25 to 29 minutes (65 commuters, 17.8%) for females.
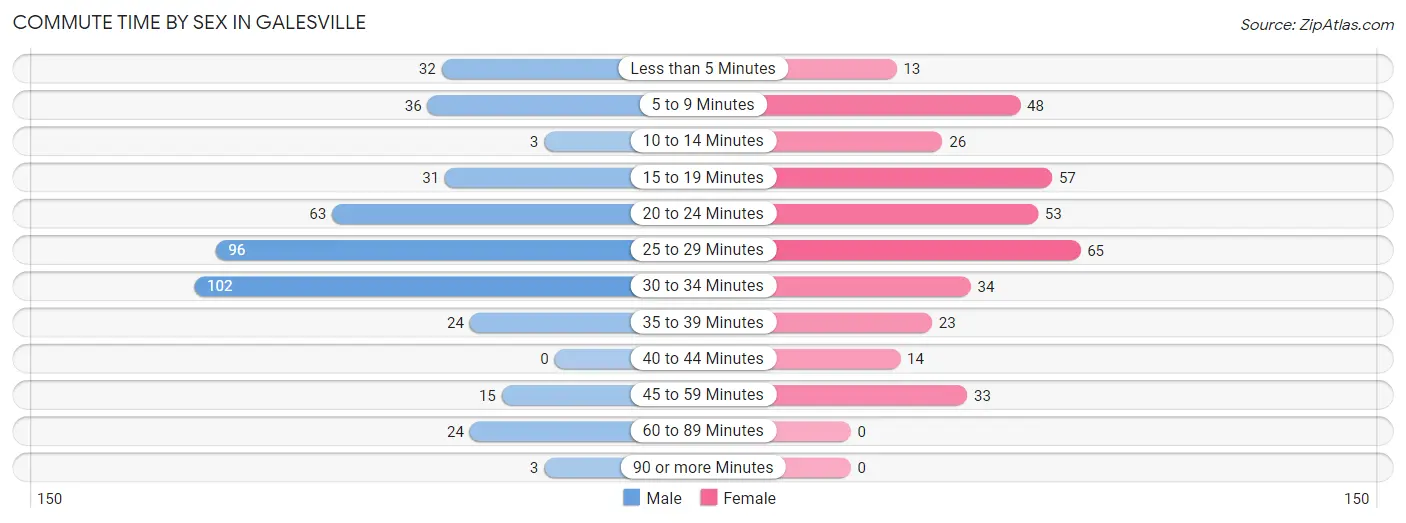
| Commute Time | Male | Female |
| Less than 5 Minutes | 32 (7.5%) | 13 (3.5%) |
| 5 to 9 Minutes | 36 (8.4%) | 48 (13.1%) |
| 10 to 14 Minutes | 3 (0.7%) | 26 (7.1%) |
| 15 to 19 Minutes | 31 (7.2%) | 57 (15.6%) |
| 20 to 24 Minutes | 63 (14.7%) | 53 (14.5%) |
| 25 to 29 Minutes | 96 (22.4%) | 65 (17.8%) |
| 30 to 34 Minutes | 102 (23.8%) | 34 (9.3%) |
| 35 to 39 Minutes | 24 (5.6%) | 23 (6.3%) |
| 40 to 44 Minutes | 0 (0.0%) | 14 (3.8%) |
| 45 to 59 Minutes | 15 (3.5%) | 33 (9.0%) |
| 60 to 89 Minutes | 24 (5.6%) | 0 (0.0%) |
| 90 or more Minutes | 3 (0.7%) | 0 (0.0%) |
Time of Departure to Work by Sex in Galesville
The most frequent times of departure to work in Galesville are 12:00 AM to 4:59 AM (59, 13.8%) for males and 4:00 PM to 11:59 PM (85, 23.2%) for females.
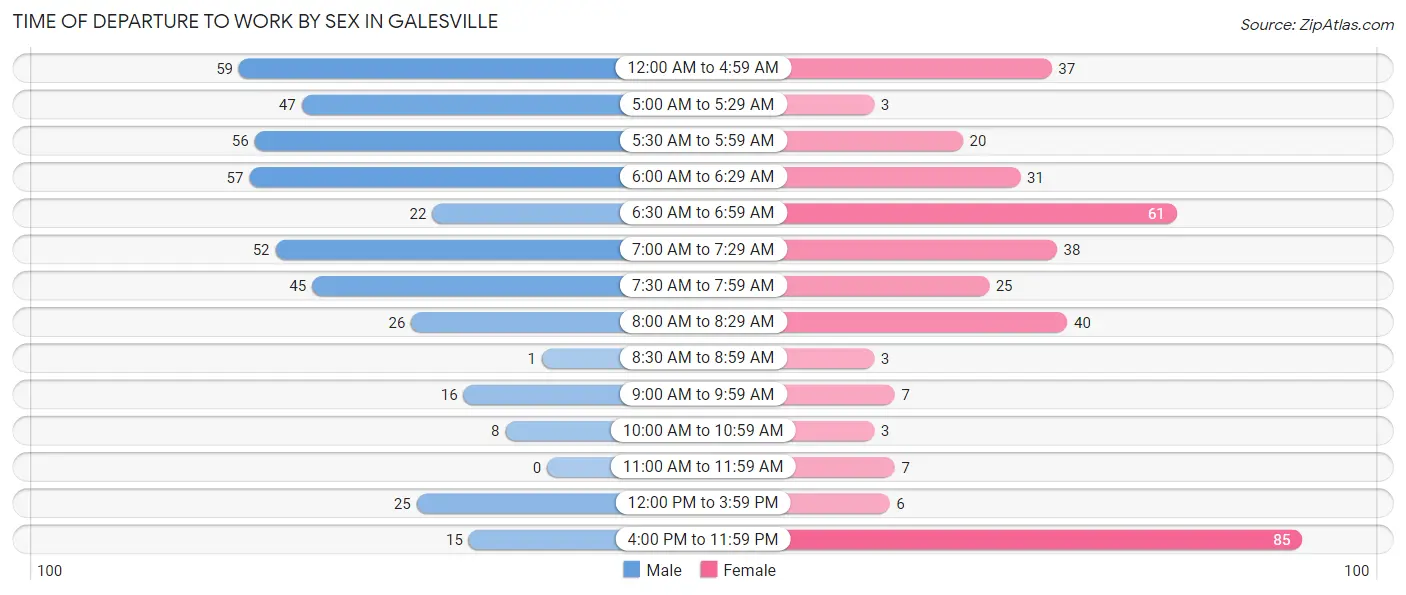
| Time of Departure | Male | Female |
| 12:00 AM to 4:59 AM | 59 (13.8%) | 37 (10.1%) |
| 5:00 AM to 5:29 AM | 47 (11.0%) | 3 (0.8%) |
| 5:30 AM to 5:59 AM | 56 (13.1%) | 20 (5.5%) |
| 6:00 AM to 6:29 AM | 57 (13.3%) | 31 (8.5%) |
| 6:30 AM to 6:59 AM | 22 (5.1%) | 61 (16.7%) |
| 7:00 AM to 7:29 AM | 52 (12.1%) | 38 (10.4%) |
| 7:30 AM to 7:59 AM | 45 (10.5%) | 25 (6.8%) |
| 8:00 AM to 8:29 AM | 26 (6.1%) | 40 (10.9%) |
| 8:30 AM to 8:59 AM | 1 (0.2%) | 3 (0.8%) |
| 9:00 AM to 9:59 AM | 16 (3.7%) | 7 (1.9%) |
| 10:00 AM to 10:59 AM | 8 (1.9%) | 3 (0.8%) |
| 11:00 AM to 11:59 AM | 0 (0.0%) | 7 (1.9%) |
| 12:00 PM to 3:59 PM | 25 (5.8%) | 6 (1.6%) |
| 4:00 PM to 11:59 PM | 15 (3.5%) | 85 (23.2%) |
| Total | 429 (100.0%) | 366 (100.0%) |
Housing Occupancy in Galesville
Occupancy by Ownership in Galesville
Of the total 678 dwellings in Galesville, owner-occupied units account for 387 (57.1%), while renter-occupied units make up 291 (42.9%).
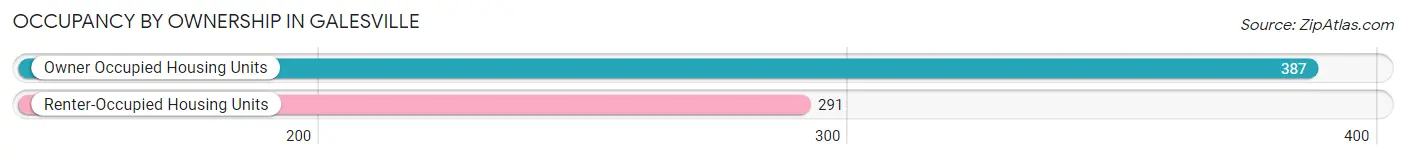
| Occupancy | # Housing Units | % Housing Units |
| Owner Occupied Housing Units | 387 | 57.1% |
| Renter-Occupied Housing Units | 291 | 42.9% |
| Total Occupied Housing Units | 678 | 100.0% |
Occupancy by Household Size in Galesville
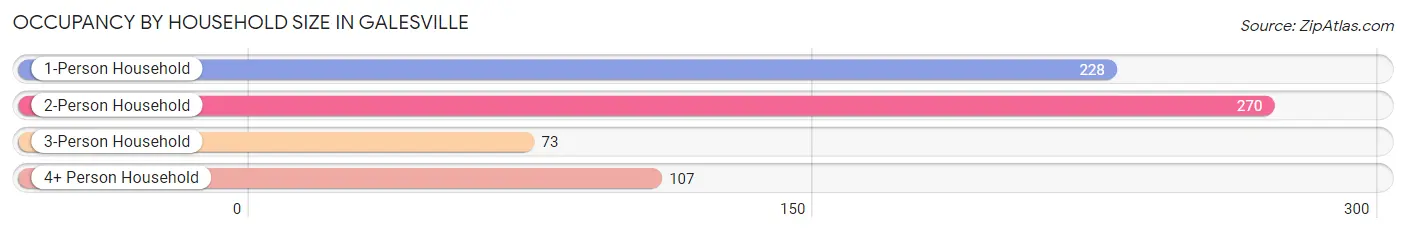
| Household Size | # Housing Units | % Housing Units |
| 1-Person Household | 228 | 33.6% |
| 2-Person Household | 270 | 39.8% |
| 3-Person Household | 73 | 10.8% |
| 4+ Person Household | 107 | 15.8% |
| Total Housing Units | 678 | 100.0% |
Occupancy by Ownership by Household Size in Galesville
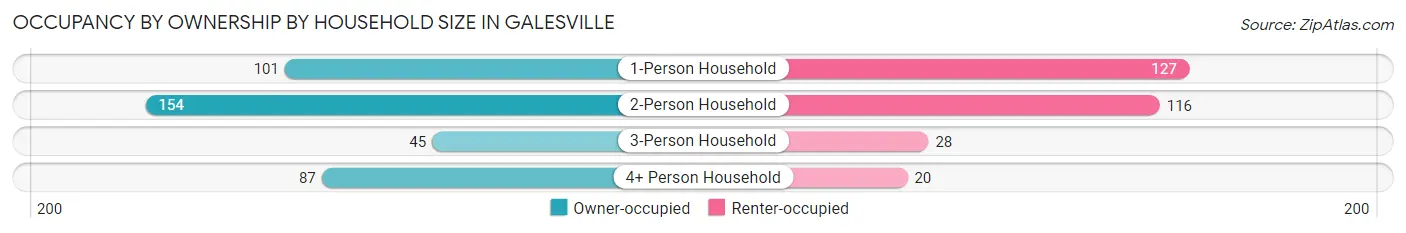
| Household Size | Owner-occupied | Renter-occupied |
| 1-Person Household | 101 (44.3%) | 127 (55.7%) |
| 2-Person Household | 154 (57.0%) | 116 (43.0%) |
| 3-Person Household | 45 (61.6%) | 28 (38.4%) |
| 4+ Person Household | 87 (81.3%) | 20 (18.7%) |
| Total Housing Units | 387 (57.1%) | 291 (42.9%) |
Occupancy by Educational Attainment in Galesville
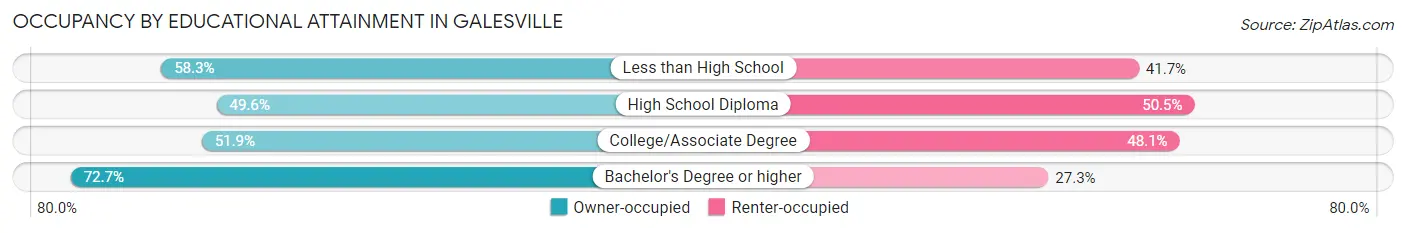
| Household Size | Owner-occupied | Renter-occupied |
| Less than High School | 21 (58.3%) | 15 (41.7%) |
| High School Diploma | 110 (49.5%) | 112 (50.4%) |
| College/Associate Degree | 123 (51.9%) | 114 (48.1%) |
| Bachelor's Degree or higher | 133 (72.7%) | 50 (27.3%) |
Occupancy by Age of Householder in Galesville
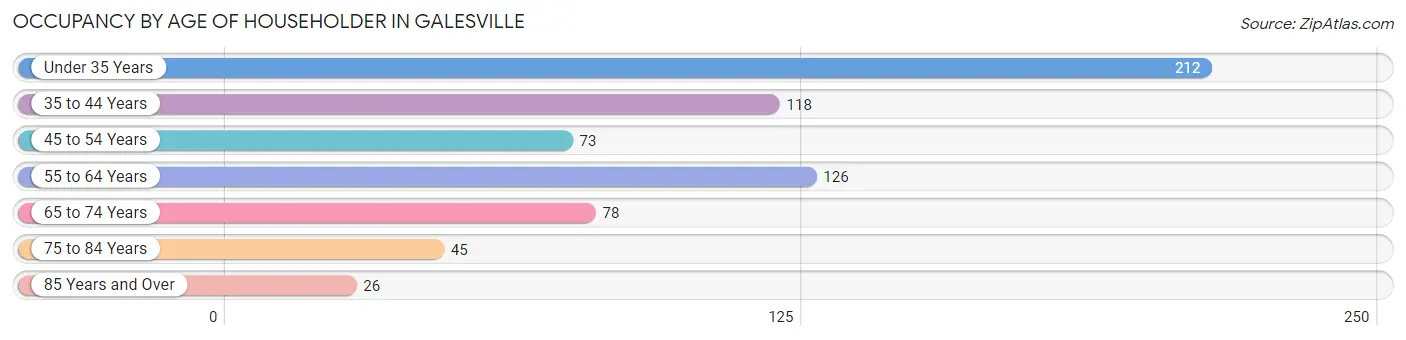
| Age Bracket | # Households | % Households |
| Under 35 Years | 212 | 31.3% |
| 35 to 44 Years | 118 | 17.4% |
| 45 to 54 Years | 73 | 10.8% |
| 55 to 64 Years | 126 | 18.6% |
| 65 to 74 Years | 78 | 11.5% |
| 75 to 84 Years | 45 | 6.6% |
| 85 Years and Over | 26 | 3.8% |
| Total | 678 | 100.0% |
Housing Finances in Galesville
Median Income by Occupancy in Galesville
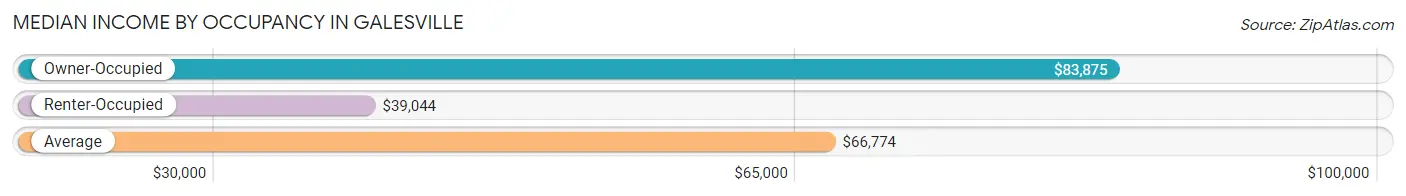
| Occupancy Type | # Households | Median Income |
| Owner-Occupied | 387 (57.1%) | $83,875 |
| Renter-Occupied | 291 (42.9%) | $39,044 |
| Average | 678 (100.0%) | $66,774 |
Occupancy by Householder Income Bracket in Galesville
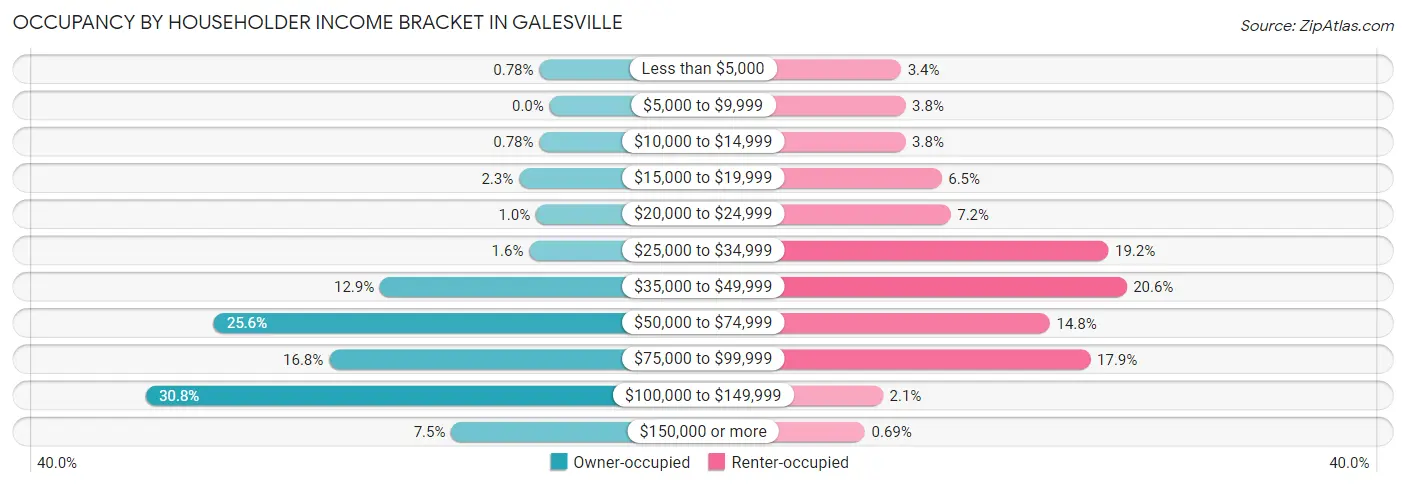
| Income Bracket | Owner-occupied | Renter-occupied |
| Less than $5,000 | 3 (0.8%) | 10 (3.4%) |
| $5,000 to $9,999 | 0 (0.0%) | 11 (3.8%) |
| $10,000 to $14,999 | 3 (0.8%) | 11 (3.8%) |
| $15,000 to $19,999 | 9 (2.3%) | 19 (6.5%) |
| $20,000 to $24,999 | 4 (1.0%) | 21 (7.2%) |
| $25,000 to $34,999 | 6 (1.5%) | 56 (19.2%) |
| $35,000 to $49,999 | 50 (12.9%) | 60 (20.6%) |
| $50,000 to $74,999 | 99 (25.6%) | 43 (14.8%) |
| $75,000 to $99,999 | 65 (16.8%) | 52 (17.9%) |
| $100,000 to $149,999 | 119 (30.7%) | 6 (2.1%) |
| $150,000 or more | 29 (7.5%) | 2 (0.7%) |
| Total | 387 (100.0%) | 291 (100.0%) |
Monthly Housing Cost Tiers in Galesville
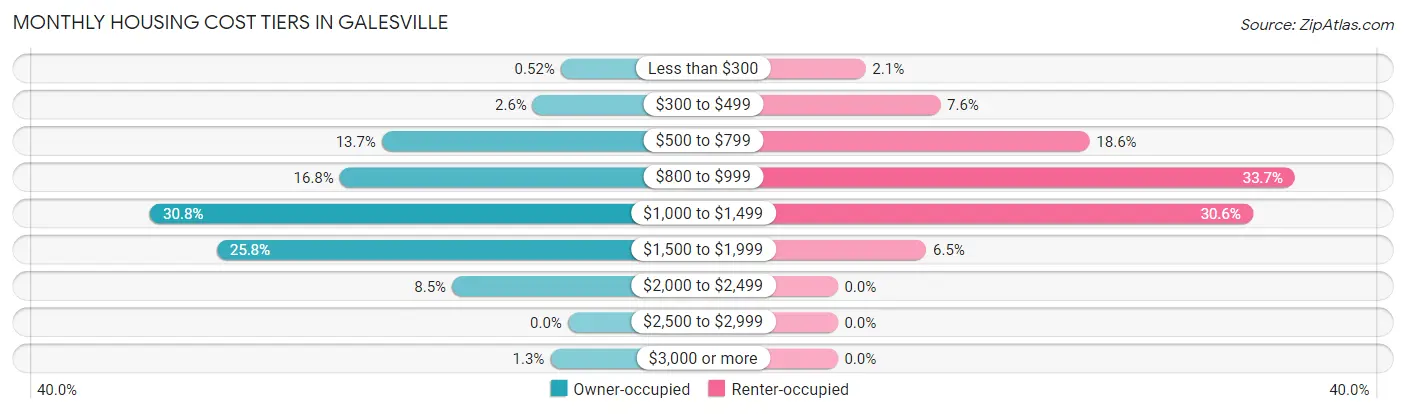
| Monthly Cost | Owner-occupied | Renter-occupied |
| Less than $300 | 2 (0.5%) | 6 (2.1%) |
| $300 to $499 | 10 (2.6%) | 22 (7.6%) |
| $500 to $799 | 53 (13.7%) | 54 (18.6%) |
| $800 to $999 | 65 (16.8%) | 98 (33.7%) |
| $1,000 to $1,499 | 119 (30.7%) | 89 (30.6%) |
| $1,500 to $1,999 | 100 (25.8%) | 19 (6.5%) |
| $2,000 to $2,499 | 33 (8.5%) | 0 (0.0%) |
| $2,500 to $2,999 | 0 (0.0%) | 0 (0.0%) |
| $3,000 or more | 5 (1.3%) | 0 (0.0%) |
| Total | 387 (100.0%) | 291 (100.0%) |
Physical Housing Characteristics in Galesville
Housing Structures in Galesville
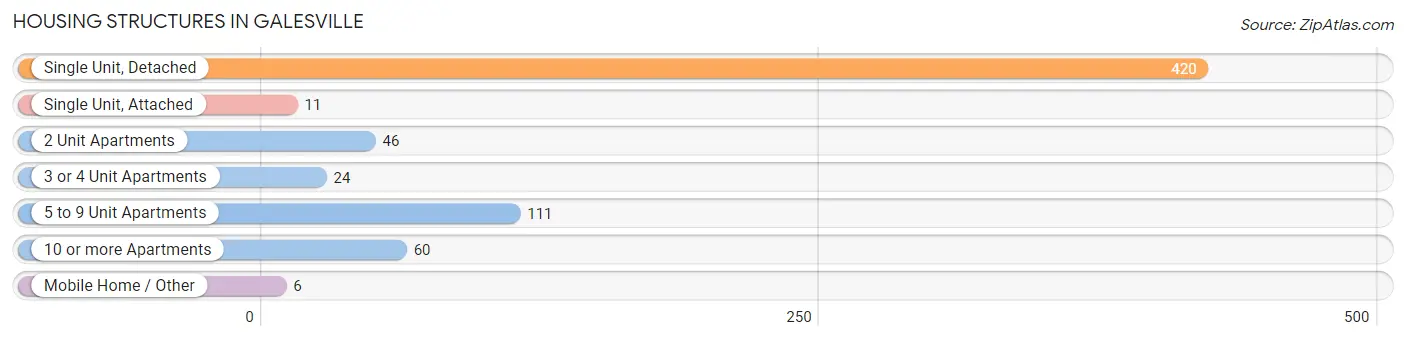
| Structure Type | # Housing Units | % Housing Units |
| Single Unit, Detached | 420 | 62.0% |
| Single Unit, Attached | 11 | 1.6% |
| 2 Unit Apartments | 46 | 6.8% |
| 3 or 4 Unit Apartments | 24 | 3.5% |
| 5 to 9 Unit Apartments | 111 | 16.4% |
| 10 or more Apartments | 60 | 8.8% |
| Mobile Home / Other | 6 | 0.9% |
| Total | 678 | 100.0% |
Housing Structures by Occupancy in Galesville
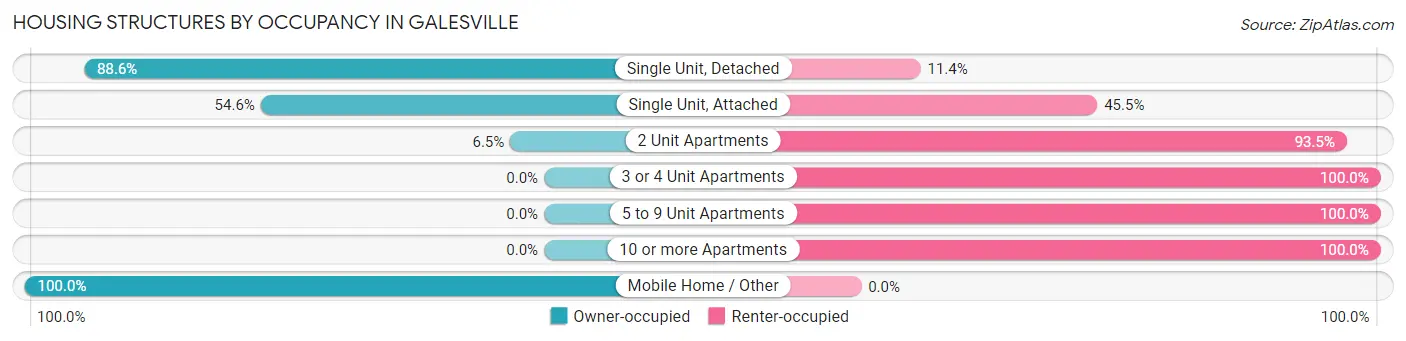
| Structure Type | Owner-occupied | Renter-occupied |
| Single Unit, Detached | 372 (88.6%) | 48 (11.4%) |
| Single Unit, Attached | 6 (54.5%) | 5 (45.5%) |
| 2 Unit Apartments | 3 (6.5%) | 43 (93.5%) |
| 3 or 4 Unit Apartments | 0 (0.0%) | 24 (100.0%) |
| 5 to 9 Unit Apartments | 0 (0.0%) | 111 (100.0%) |
| 10 or more Apartments | 0 (0.0%) | 60 (100.0%) |
| Mobile Home / Other | 6 (100.0%) | 0 (0.0%) |
| Total | 387 (57.1%) | 291 (42.9%) |
Housing Structures by Number of Rooms in Galesville
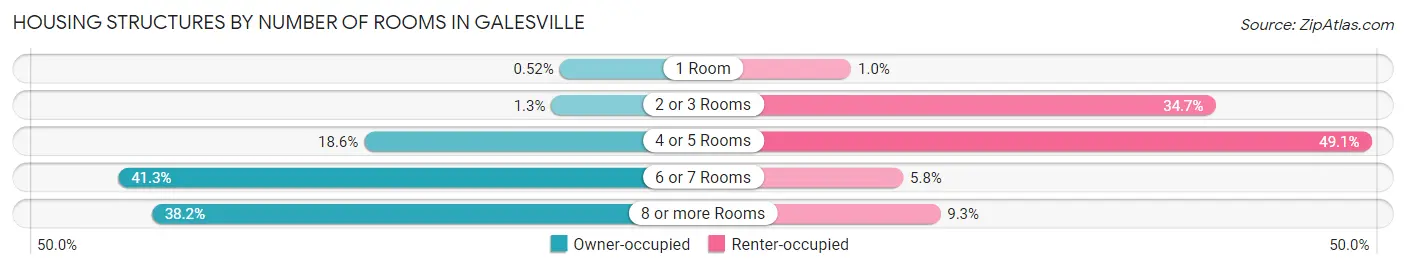
| Number of Rooms | Owner-occupied | Renter-occupied |
| 1 Room | 2 (0.5%) | 3 (1.0%) |
| 2 or 3 Rooms | 5 (1.3%) | 101 (34.7%) |
| 4 or 5 Rooms | 72 (18.6%) | 143 (49.1%) |
| 6 or 7 Rooms | 160 (41.3%) | 17 (5.8%) |
| 8 or more Rooms | 148 (38.2%) | 27 (9.3%) |
| Total | 387 (100.0%) | 291 (100.0%) |
Housing Structure by Heating Type in Galesville
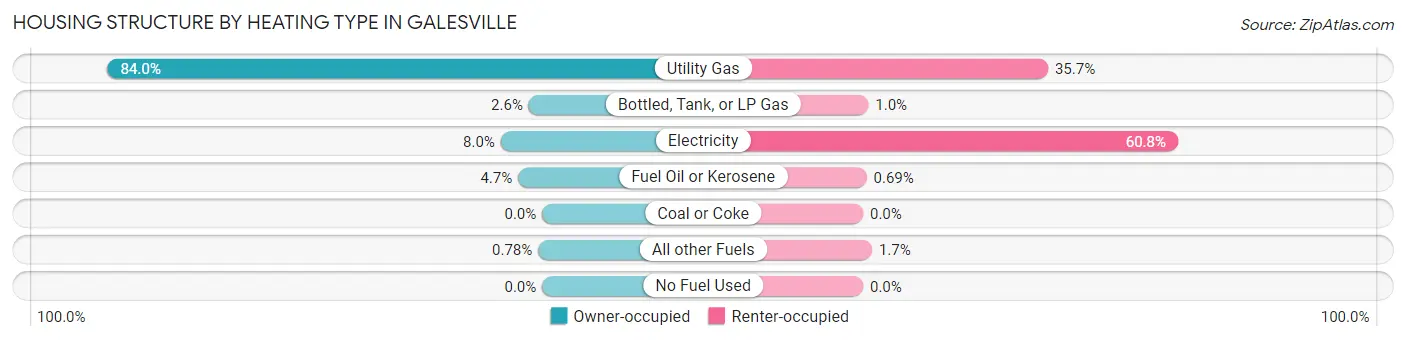
| Heating Type | Owner-occupied | Renter-occupied |
| Utility Gas | 325 (84.0%) | 104 (35.7%) |
| Bottled, Tank, or LP Gas | 10 (2.6%) | 3 (1.0%) |
| Electricity | 31 (8.0%) | 177 (60.8%) |
| Fuel Oil or Kerosene | 18 (4.6%) | 2 (0.7%) |
| Coal or Coke | 0 (0.0%) | 0 (0.0%) |
| All other Fuels | 3 (0.8%) | 5 (1.7%) |
| No Fuel Used | 0 (0.0%) | 0 (0.0%) |
| Total | 387 (100.0%) | 291 (100.0%) |
Household Vehicle Usage in Galesville
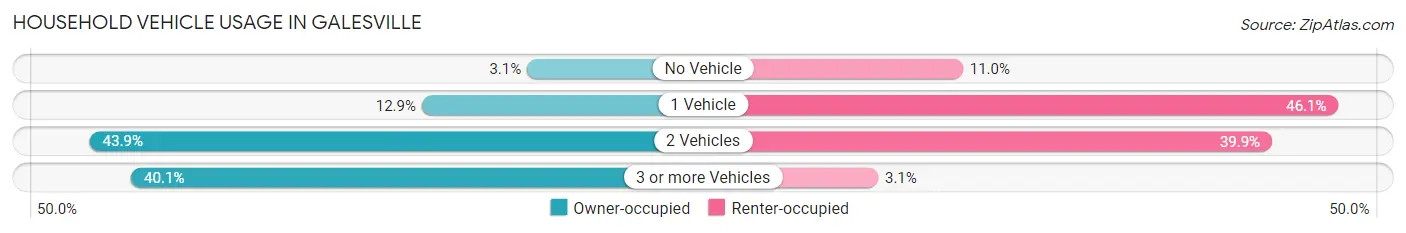
| Vehicles per Household | Owner-occupied | Renter-occupied |
| No Vehicle | 12 (3.1%) | 32 (11.0%) |
| 1 Vehicle | 50 (12.9%) | 134 (46.1%) |
| 2 Vehicles | 170 (43.9%) | 116 (39.9%) |
| 3 or more Vehicles | 155 (40.1%) | 9 (3.1%) |
| Total | 387 (100.0%) | 291 (100.0%) |
Real Estate & Mortgages in Galesville
Real Estate and Mortgage Overview in Galesville
| Characteristic | Without Mortgage | With Mortgage |
| Housing Units | 90 | 297 |
| Median Property Value | $198,400 | $191,400 |
| Median Household Income | $67,344 | $22 |
| Monthly Housing Costs | $700 | $5 |
| Real Estate Taxes | $4,231 | $0 |
Property Value by Mortgage Status in Galesville
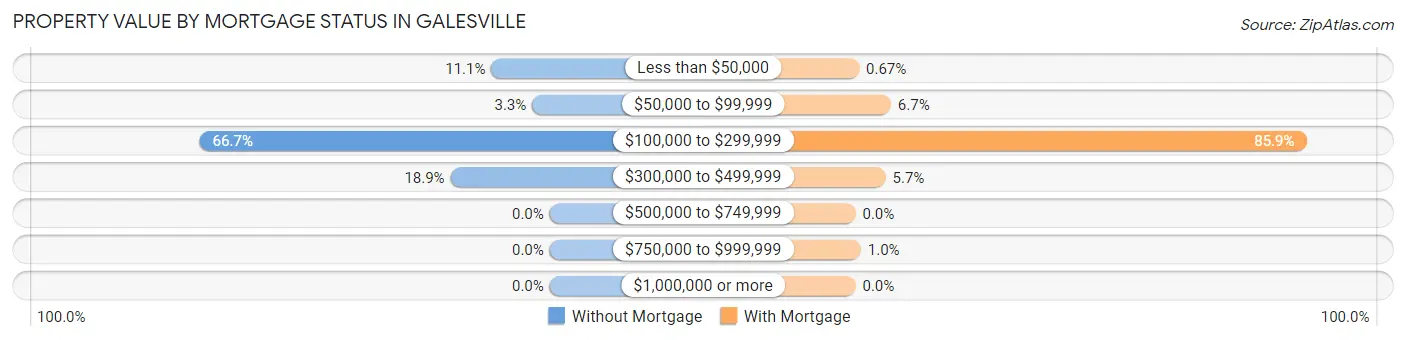
| Property Value | Without Mortgage | With Mortgage |
| Less than $50,000 | 10 (11.1%) | 2 (0.7%) |
| $50,000 to $99,999 | 3 (3.3%) | 20 (6.7%) |
| $100,000 to $299,999 | 60 (66.7%) | 255 (85.9%) |
| $300,000 to $499,999 | 17 (18.9%) | 17 (5.7%) |
| $500,000 to $749,999 | 0 (0.0%) | 0 (0.0%) |
| $750,000 to $999,999 | 0 (0.0%) | 3 (1.0%) |
| $1,000,000 or more | 0 (0.0%) | 0 (0.0%) |
| Total | 90 (100.0%) | 297 (100.0%) |
Household Income by Mortgage Status in Galesville
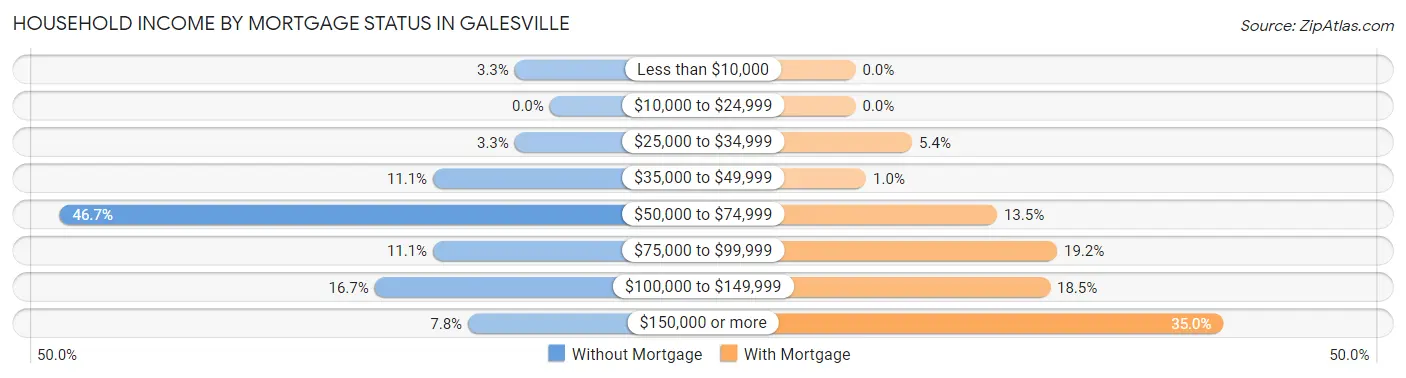
| Household Income | Without Mortgage | With Mortgage |
| Less than $10,000 | 3 (3.3%) | 0 (0.0%) |
| $10,000 to $24,999 | 0 (0.0%) | 0 (0.0%) |
| $25,000 to $34,999 | 3 (3.3%) | 16 (5.4%) |
| $35,000 to $49,999 | 10 (11.1%) | 3 (1.0%) |
| $50,000 to $74,999 | 42 (46.7%) | 40 (13.5%) |
| $75,000 to $99,999 | 10 (11.1%) | 57 (19.2%) |
| $100,000 to $149,999 | 15 (16.7%) | 55 (18.5%) |
| $150,000 or more | 7 (7.8%) | 104 (35.0%) |
| Total | 90 (100.0%) | 297 (100.0%) |
Property Value to Household Income Ratio in Galesville
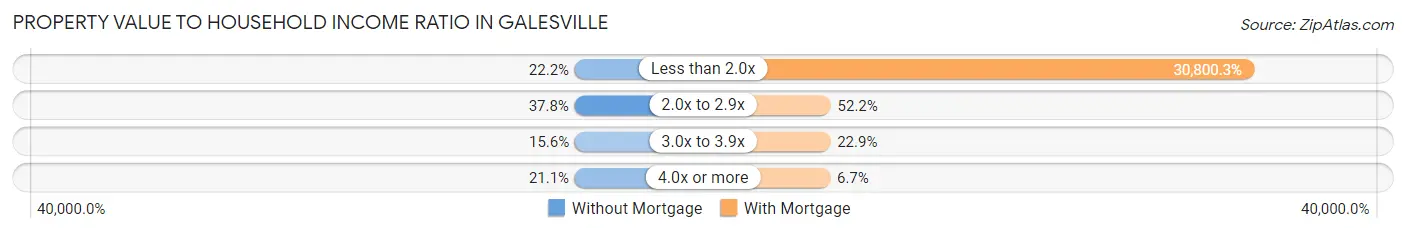
| Value-to-Income Ratio | Without Mortgage | With Mortgage |
| Less than 2.0x | 20 (22.2%) | 91,477 (30,800.3%) |
| 2.0x to 2.9x | 34 (37.8%) | 155 (52.2%) |
| 3.0x to 3.9x | 14 (15.6%) | 68 (22.9%) |
| 4.0x or more | 19 (21.1%) | 20 (6.7%) |
| Total | 90 (100.0%) | 297 (100.0%) |
Real Estate Taxes by Mortgage Status in Galesville

| Property Taxes | Without Mortgage | With Mortgage |
| Less than $800 | 6 (6.7%) | 0 (0.0%) |
| $800 to $1,499 | 0 (0.0%) | 2 (0.7%) |
| $800 to $1,499 | 84 (93.3%) | 17 (5.7%) |
| Total | 90 (100.0%) | 297 (100.0%) |
Health & Disability in Galesville
Health Insurance Coverage by Age in Galesville
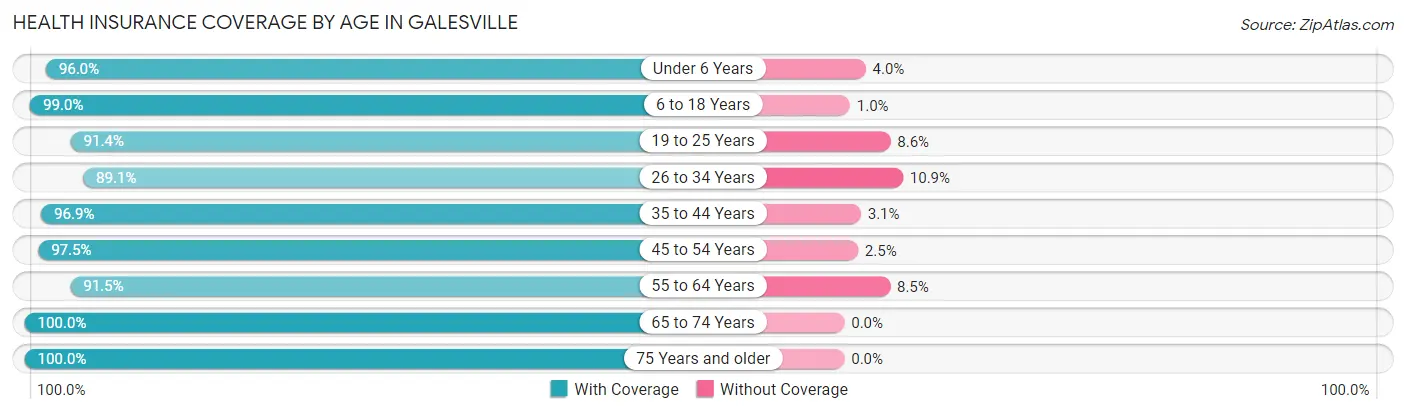
| Age Bracket | With Coverage | Without Coverage |
| Under 6 Years | 121 (96.0%) | 5 (4.0%) |
| 6 to 18 Years | 287 (99.0%) | 3 (1.0%) |
| 19 to 25 Years | 149 (91.4%) | 14 (8.6%) |
| 26 to 34 Years | 204 (89.1%) | 25 (10.9%) |
| 35 to 44 Years | 189 (96.9%) | 6 (3.1%) |
| 45 to 54 Years | 115 (97.5%) | 3 (2.5%) |
| 55 to 64 Years | 193 (91.5%) | 18 (8.5%) |
| 65 to 74 Years | 115 (100.0%) | 0 (0.0%) |
| 75 Years and older | 90 (100.0%) | 0 (0.0%) |
| Total | 1,463 (95.2%) | 74 (4.8%) |
Health Insurance Coverage by Citizenship Status in Galesville

| Citizenship Status | With Coverage | Without Coverage |
| Native Born | 121 (96.0%) | 5 (4.0%) |
| Foreign Born, Citizen | 287 (99.0%) | 3 (1.0%) |
| Foreign Born, not a Citizen | 149 (91.4%) | 14 (8.6%) |
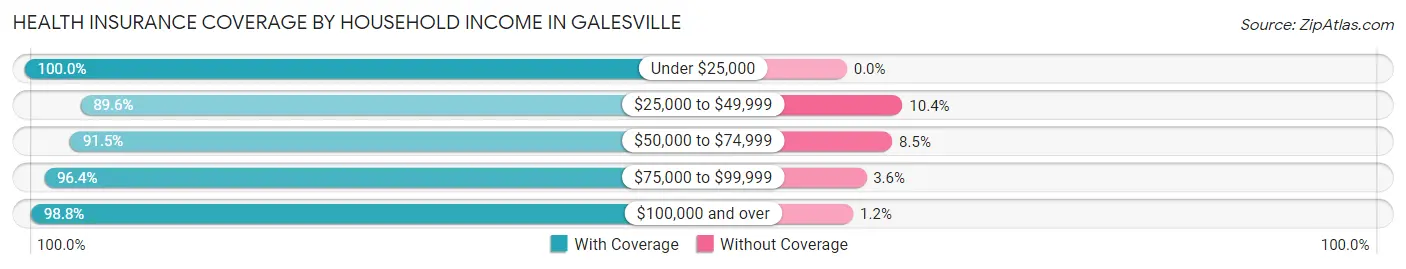
Health Insurance Coverage by Household Income in Galesville
| Household Income | With Coverage | Without Coverage |
| Under $25,000 | 128 (100.0%) | 0 (0.0%) |
| $25,000 to $49,999 | 275 (89.6%) | 32 (10.4%) |
| $50,000 to $74,999 | 269 (91.5%) | 25 (8.5%) |
| $75,000 to $99,999 | 291 (96.4%) | 11 (3.6%) |
| $100,000 and over | 500 (98.8%) | 6 (1.2%) |
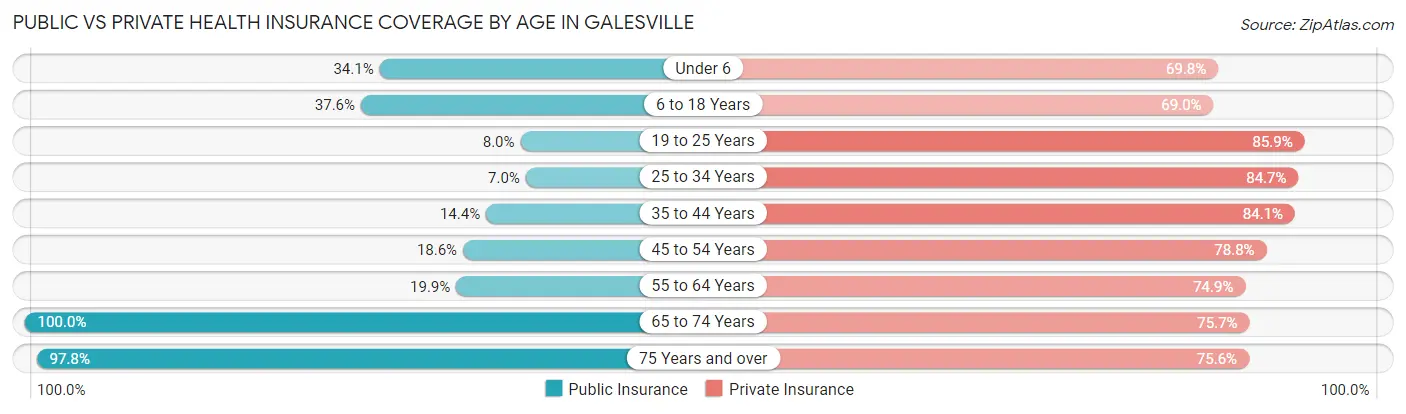
Public vs Private Health Insurance Coverage by Age in Galesville
| Age Bracket | Public Insurance | Private Insurance |
| Under 6 | 43 (34.1%) | 88 (69.8%) |
| 6 to 18 Years | 109 (37.6%) | 200 (69.0%) |
| 19 to 25 Years | 13 (8.0%) | 140 (85.9%) |
| 25 to 34 Years | 16 (7.0%) | 194 (84.7%) |
| 35 to 44 Years | 28 (14.4%) | 164 (84.1%) |
| 45 to 54 Years | 22 (18.6%) | 93 (78.8%) |
| 55 to 64 Years | 42 (19.9%) | 158 (74.9%) |
| 65 to 74 Years | 115 (100.0%) | 87 (75.6%) |
| 75 Years and over | 88 (97.8%) | 68 (75.6%) |
| Total | 476 (31.0%) | 1,192 (77.5%) |
Disability Status by Sex by Age in Galesville
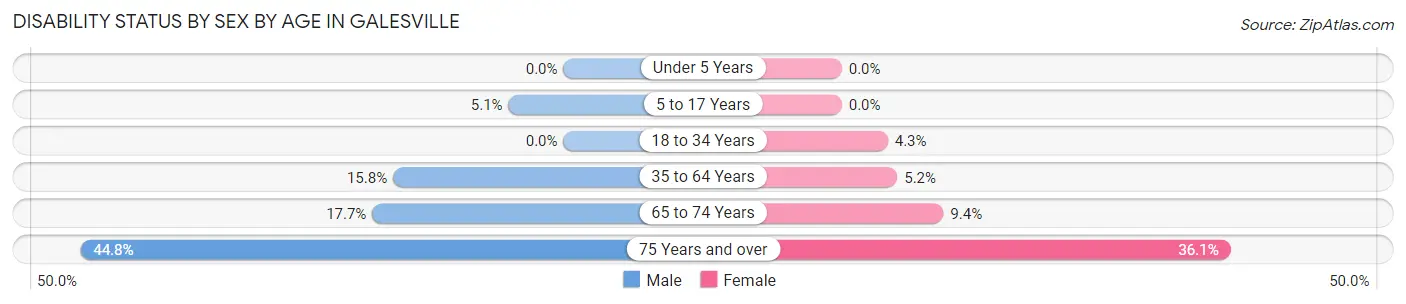
| Age Bracket | Male | Female |
| Under 5 Years | 0 (0.0%) | 0 (0.0%) |
| 5 to 17 Years | 8 (5.1%) | 0 (0.0%) |
| 18 to 34 Years | 0 (0.0%) | 9 (4.3%) |
| 35 to 64 Years | 46 (15.8%) | 12 (5.1%) |
| 65 to 74 Years | 11 (17.7%) | 5 (9.4%) |
| 75 Years and over | 13 (44.8%) | 22 (36.1%) |
Disability Class by Sex by Age in Galesville
Disability Class: Hearing Difficulty
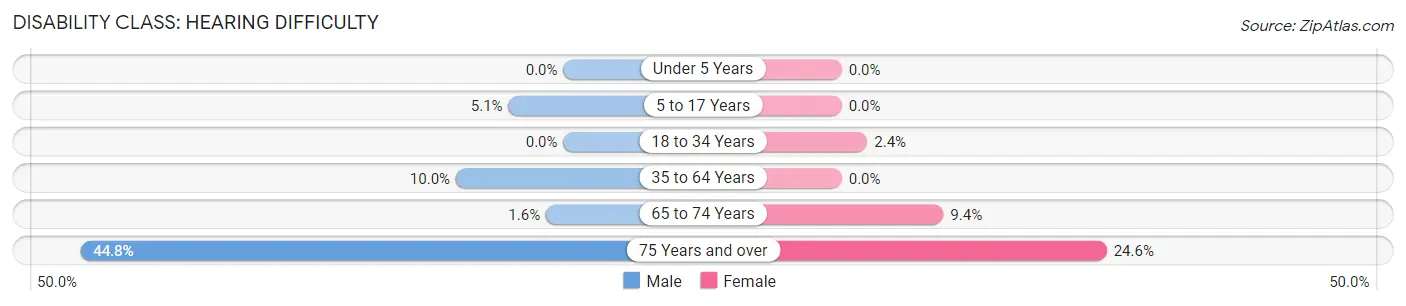
| Age Bracket | Male | Female |
| Under 5 Years | 0 (0.0%) | 0 (0.0%) |
| 5 to 17 Years | 8 (5.1%) | 0 (0.0%) |
| 18 to 34 Years | 0 (0.0%) | 5 (2.4%) |
| 35 to 64 Years | 29 (10.0%) | 0 (0.0%) |
| 65 to 74 Years | 1 (1.6%) | 5 (9.4%) |
| 75 Years and over | 13 (44.8%) | 15 (24.6%) |
Disability Class: Vision Difficulty
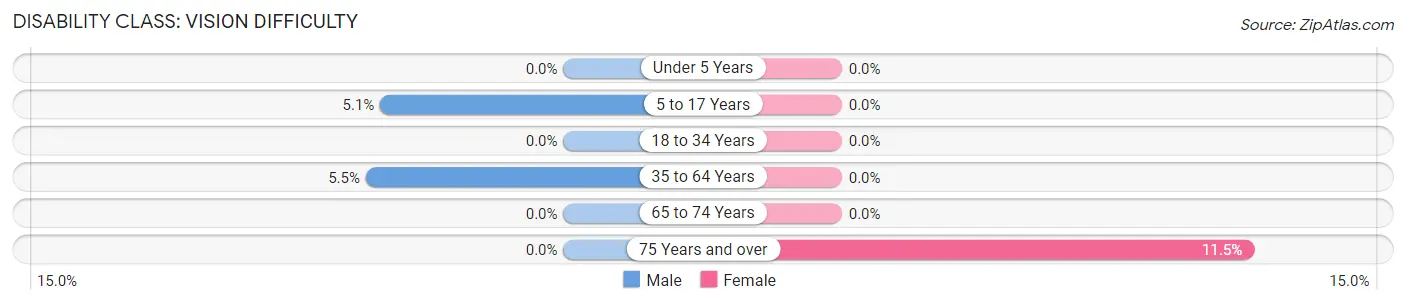
| Age Bracket | Male | Female |
| Under 5 Years | 0 (0.0%) | 0 (0.0%) |
| 5 to 17 Years | 8 (5.1%) | 0 (0.0%) |
| 18 to 34 Years | 0 (0.0%) | 0 (0.0%) |
| 35 to 64 Years | 16 (5.5%) | 0 (0.0%) |
| 65 to 74 Years | 0 (0.0%) | 0 (0.0%) |
| 75 Years and over | 0 (0.0%) | 7 (11.5%) |
Disability Class: Cognitive Difficulty
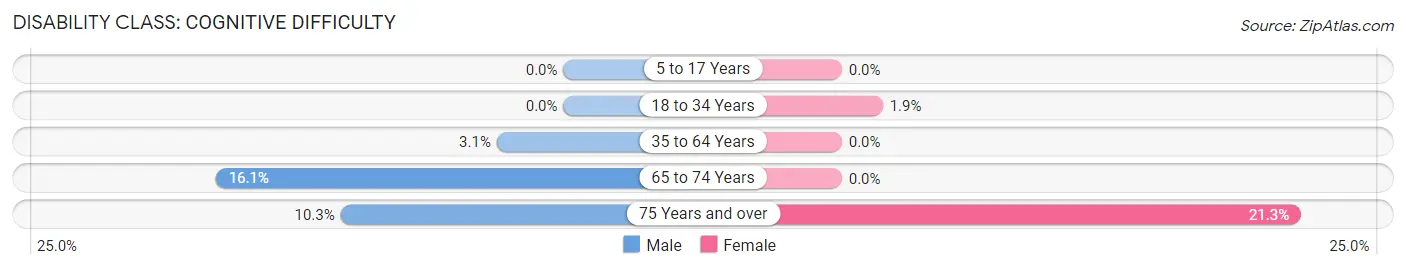
| Age Bracket | Male | Female |
| 5 to 17 Years | 0 (0.0%) | 0 (0.0%) |
| 18 to 34 Years | 0 (0.0%) | 4 (1.9%) |
| 35 to 64 Years | 9 (3.1%) | 0 (0.0%) |
| 65 to 74 Years | 10 (16.1%) | 0 (0.0%) |
| 75 Years and over | 3 (10.3%) | 13 (21.3%) |
Disability Class: Ambulatory Difficulty
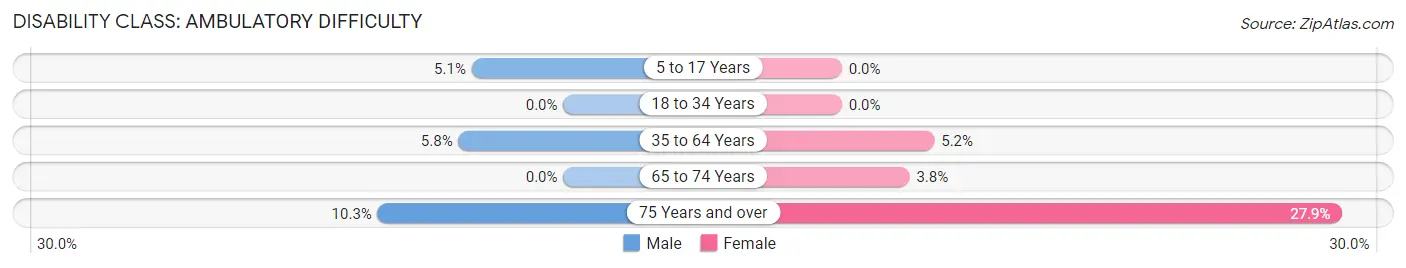
| Age Bracket | Male | Female |
| 5 to 17 Years | 8 (5.1%) | 0 (0.0%) |
| 18 to 34 Years | 0 (0.0%) | 0 (0.0%) |
| 35 to 64 Years | 17 (5.8%) | 12 (5.1%) |
| 65 to 74 Years | 0 (0.0%) | 2 (3.8%) |
| 75 Years and over | 3 (10.3%) | 17 (27.9%) |
Disability Class: Self-Care Difficulty

| Age Bracket | Male | Female |
| 5 to 17 Years | 0 (0.0%) | 0 (0.0%) |
| 18 to 34 Years | 0 (0.0%) | 4 (1.9%) |
| 35 to 64 Years | 3 (1.0%) | 6 (2.6%) |
| 65 to 74 Years | 0 (0.0%) | 0 (0.0%) |
| 75 Years and over | 3 (10.3%) | 3 (4.9%) |
Technology Access in Galesville
Computing Device Access in Galesville
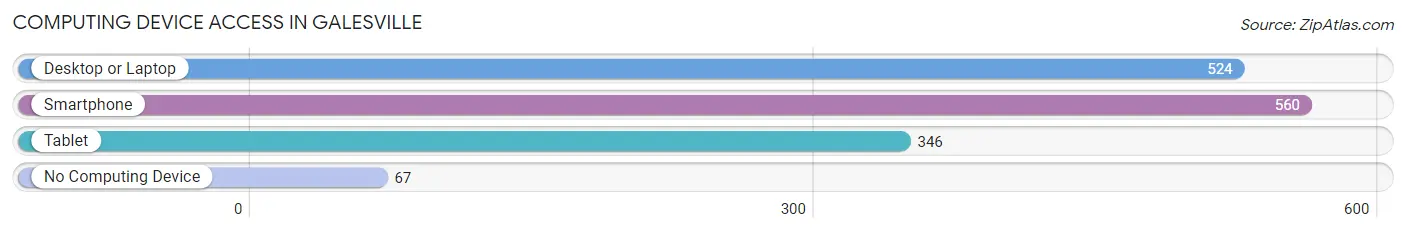
| Device Type | # Households | % Households |
| Desktop or Laptop | 524 | 77.3% |
| Smartphone | 560 | 82.6% |
| Tablet | 346 | 51.0% |
| No Computing Device | 67 | 9.9% |
| Total | 678 | 100.0% |
Internet Access in Galesville
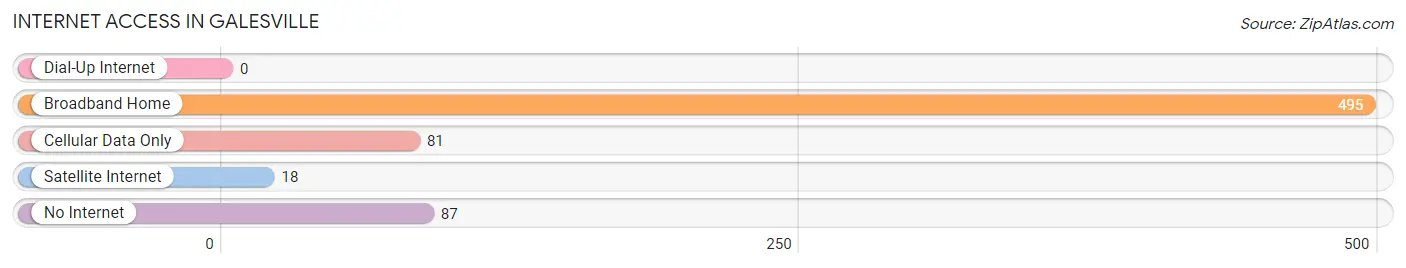
| Internet Type | # Households | % Households |
| Dial-Up Internet | 0 | 0.0% |
| Broadband Home | 495 | 73.0% |
| Cellular Data Only | 81 | 11.9% |
| Satellite Internet | 18 | 2.6% |
| No Internet | 87 | 12.8% |
| Total | 678 | 100.0% |
Galesville Summary
Galesville, Wisconsin is a small village located in Trempealeau County, Wisconsin. It is situated on the banks of the Mississippi River, just south of La Crosse. The village has a population of 1,092 people, according to the 2010 census.
History
Galesville was founded in 1854 by William Gales, a former Wisconsin state senator. Gales had purchased the land from the US government and named the village after himself. The village was incorporated in 1858 and was the first village in Trempealeau County.
Galesville was a thriving river port in the late 19th century. It was a major stop for steamboats traveling up and down the Mississippi River. The village was also home to a number of businesses, including a sawmill, a grist mill, a flour mill, a brickyard, and a brewery.
Geography
Galesville is located in the western part of Trempealeau County, Wisconsin. It is situated on the banks of the Mississippi River, just south of La Crosse. The village is surrounded by rolling hills and is located in the Driftless Area, a region of Wisconsin that was not affected by the last glacial period.
The village has a total area of 1.2 square miles, all of which is land. The village is located at an elevation of 690 feet above sea level.
Economy
Galesville’s economy is largely based on agriculture and tourism. The village is home to a number of small businesses, including a grocery store, a hardware store, a restaurant, and a gas station.
The village is also home to a number of tourist attractions, including the Galesville Dam, the Galesville Museum, and the Galesville Opera House. The village also hosts a number of annual events, including the Galesville Summer Festival and the Galesville Fall Festival.
Demographics
According to the 2010 census, Galesville has a population of 1,092 people. The village has a median household income of $41,250 and a median family income of $50,000. The village has a poverty rate of 11.3%, which is slightly higher than the national average.
The village is predominantly white, with 94.3% of the population identifying as such. The village also has a small Hispanic population, with 4.2% of the population identifying as Hispanic or Latino.
Conclusion
Galesville, Wisconsin is a small village located in Trempealeau County, Wisconsin. It is situated on the banks of the Mississippi River, just south of La Crosse. The village has a population of 1,092 people, according to the 2010 census. Galesville’s economy is largely based on agriculture and tourism. The village is predominantly white, with 94.3% of the population identifying as such. The village also has a small Hispanic population, with 4.2% of the population identifying as Hispanic or Latino. Galesville is a thriving river port and is home to a number of tourist attractions, including the Galesville Dam, the Galesville Museum, and the Galesville Opera House.
Common Questions
What is Per Capita Income in Galesville?
Per Capita income in Galesville is $32,288.
What is the Median Family Income in Galesville?
Median Family Income in Galesville is $87,500.
What is the Median Household income in Galesville?
Median Household Income in Galesville is $66,774.
What is Income or Wage Gap in Galesville?
Income or Wage Gap in Galesville is 46.1%.
Women in Galesville earn 53.9 cents for every dollar earned by a man.
What is Inequality or Gini Index in Galesville?
Inequality or Gini Index in Galesville is 0.36.
What is the Total Population of Galesville?
Total Population of Galesville is 1,582.
What is the Total Male Population of Galesville?
Total Male Population of Galesville is 817.
What is the Total Female Population of Galesville?
Total Female Population of Galesville is 765.
What is the Ratio of Males per 100 Females in Galesville?
There are 106.80 Males per 100 Females in Galesville.
What is the Ratio of Females per 100 Males in Galesville?
There are 93.64 Females per 100 Males in Galesville.
What is the Median Population Age in Galesville?
Median Population Age in Galesville is 33.9 Years.
What is the Average Family Size in Galesville
Average Family Size in Galesville is 3.0 People.
What is the Average Household Size in Galesville
Average Household Size in Galesville is 2.3 People.
How Large is the Labor Force in Galesville?
There are 916 People in the Labor Forcein in Galesville.
What is the Percentage of People in the Labor Force in Galesville?
72.5% of People are in the Labor Force in Galesville.
What is the Unemployment Rate in Galesville?
Unemployment Rate in Galesville is 0.3%.