Eagle, WI Map & Demographics
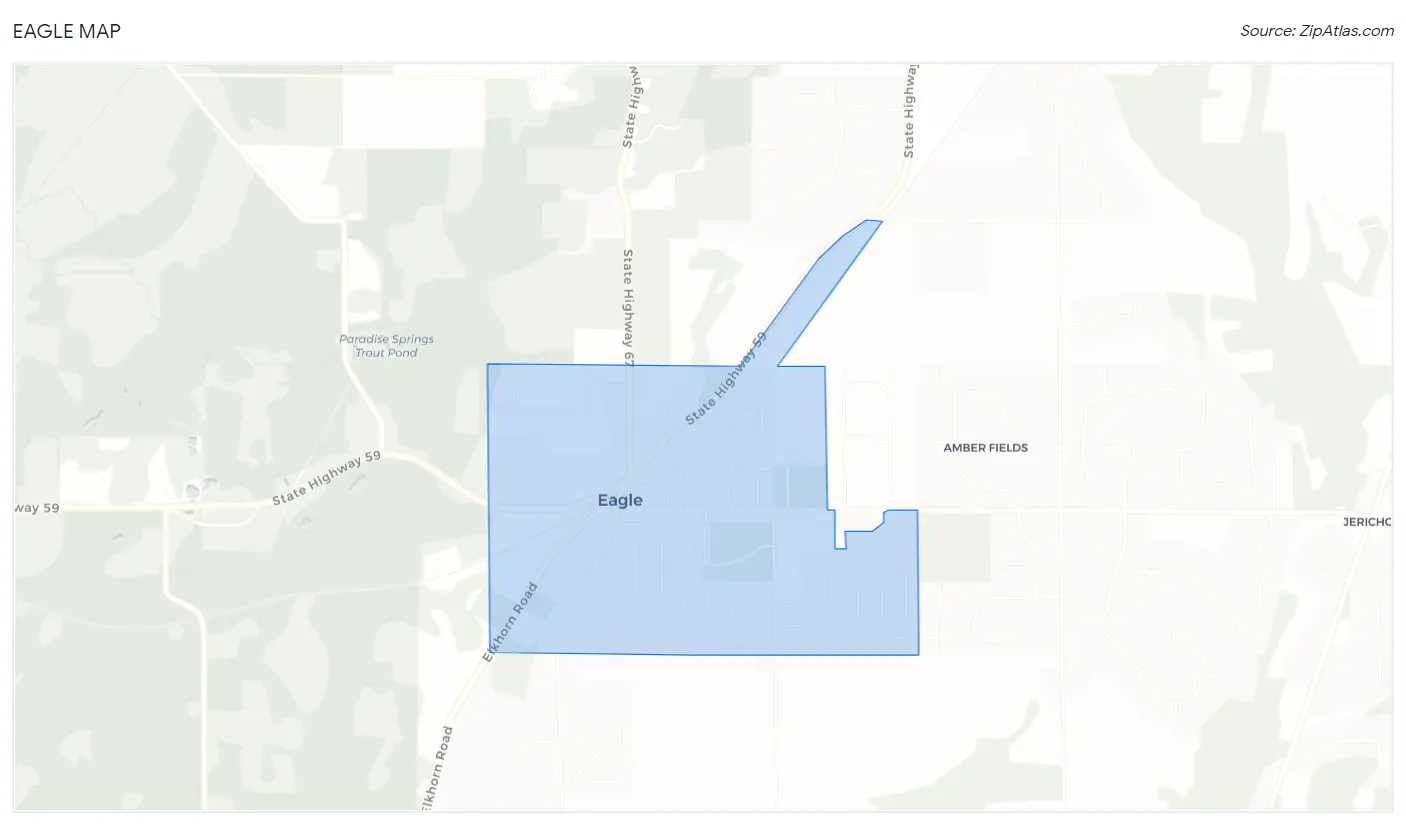
Eagle Map
Eagle Overview
$42,808
PER CAPITA INCOME
$118,897
AVG FAMILY INCOME
$110,500
AVG HOUSEHOLD INCOME
39.5%
WAGE / INCOME GAP [ % ]
60.5¢/ $1
WAGE / INCOME GAP [ $ ]
0.30
INEQUALITY / GINI INDEX
2,050
TOTAL POPULATION
1,061
MALE POPULATION
989
FEMALE POPULATION
107.28
MALES / 100 FEMALES
93.21
FEMALES / 100 MALES
41.4
MEDIAN AGE
2.8
AVG FAMILY SIZE
2.6
AVG HOUSEHOLD SIZE
1,248
LABOR FORCE [ PEOPLE ]
74.0%
PERCENT IN LABOR FORCE
1.8%
UNEMPLOYMENT RATE
Eagle Zip Codes
Eagle Area Codes
Income in Eagle
Income Overview in Eagle
Per Capita Income in Eagle is $42,808, while median incomes of families and households are $118,897 and $110,500 respectively.
| Characteristic | Number | Measure |
| Per Capita Income | 2,050 | $42,808 |
| Median Family Income | 611 | $118,897 |
| Mean Family Income | 611 | $114,985 |
| Median Household Income | 788 | $110,500 |
| Mean Household Income | 788 | $110,508 |
| Income Deficit | 611 | $0 |
| Wage / Income Gap (%) | 2,050 | 39.54% |
| Wage / Income Gap ($) | 2,050 | 60.46¢ per $1 |
| Gini / Inequality Index | 2,050 | 0.30 |
Earnings by Sex in Eagle
Average Earnings in Eagle are $51,865, $70,298 for men and $42,500 for women, a difference of 39.5%.
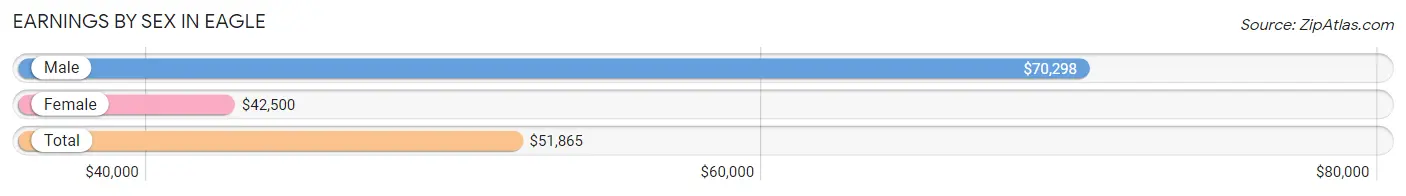
| Sex | Number | Average Earnings |
| Male | 679 (51.9%) | $70,298 |
| Female | 630 (48.1%) | $42,500 |
| Total | 1,309 (100.0%) | $51,865 |
Earnings by Sex by Income Bracket in Eagle
The most common earnings brackets in Eagle are $75,000 to $99,999 for men (187 | 27.5%) and $40,000 to $44,999 for women (83 | 13.2%).
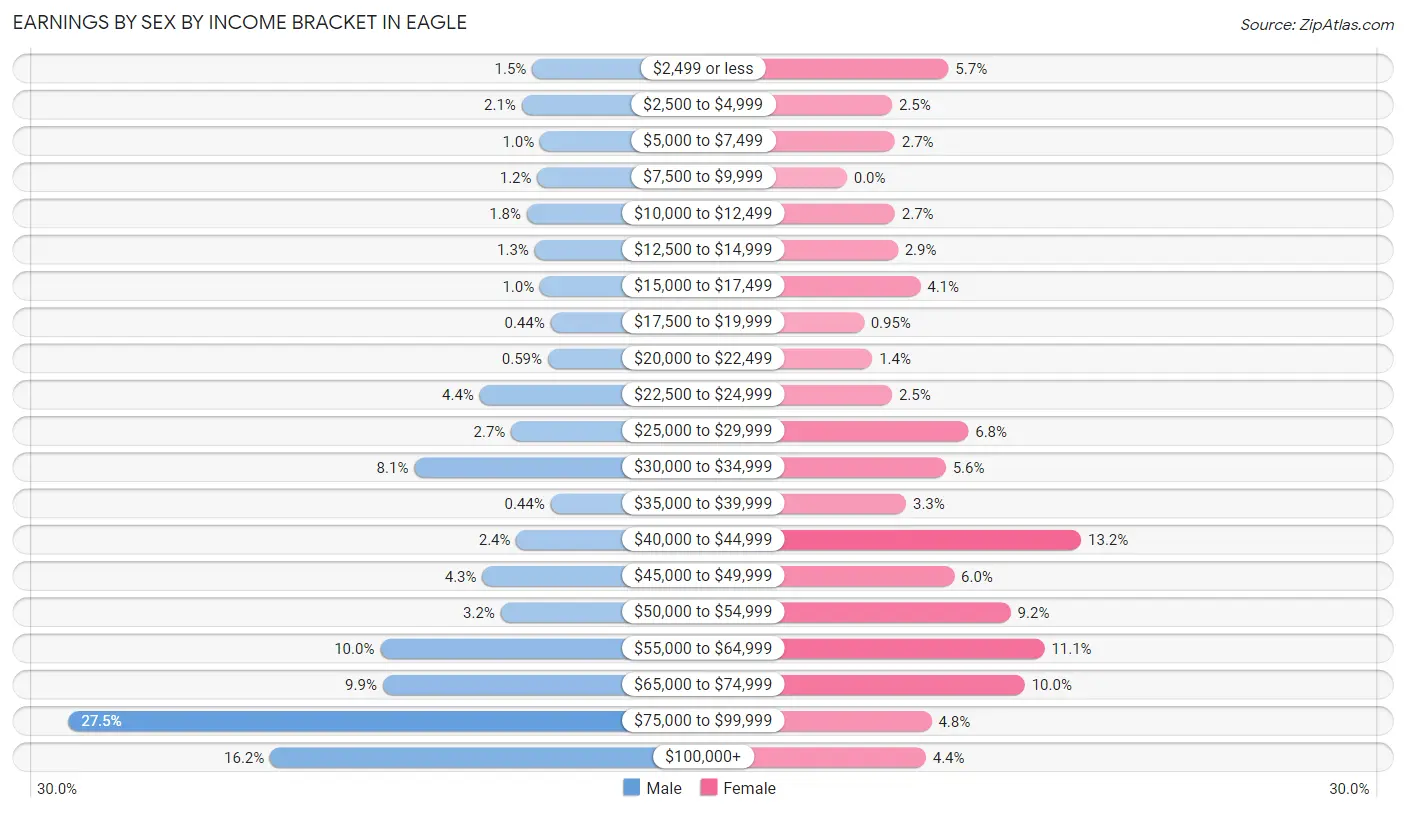
| Income | Male | Female |
| $2,499 or less | 10 (1.5%) | 36 (5.7%) |
| $2,500 to $4,999 | 14 (2.1%) | 16 (2.5%) |
| $5,000 to $7,499 | 7 (1.0%) | 17 (2.7%) |
| $7,500 to $9,999 | 8 (1.2%) | 0 (0.0%) |
| $10,000 to $12,499 | 12 (1.8%) | 17 (2.7%) |
| $12,500 to $14,999 | 9 (1.3%) | 18 (2.9%) |
| $15,000 to $17,499 | 7 (1.0%) | 26 (4.1%) |
| $17,500 to $19,999 | 3 (0.4%) | 6 (0.9%) |
| $20,000 to $22,499 | 4 (0.6%) | 9 (1.4%) |
| $22,500 to $24,999 | 30 (4.4%) | 16 (2.5%) |
| $25,000 to $29,999 | 18 (2.6%) | 43 (6.8%) |
| $30,000 to $34,999 | 55 (8.1%) | 35 (5.6%) |
| $35,000 to $39,999 | 3 (0.4%) | 21 (3.3%) |
| $40,000 to $44,999 | 16 (2.4%) | 83 (13.2%) |
| $45,000 to $49,999 | 29 (4.3%) | 38 (6.0%) |
| $50,000 to $54,999 | 22 (3.2%) | 58 (9.2%) |
| $55,000 to $64,999 | 68 (10.0%) | 70 (11.1%) |
| $65,000 to $74,999 | 67 (9.9%) | 63 (10.0%) |
| $75,000 to $99,999 | 187 (27.5%) | 30 (4.8%) |
| $100,000+ | 110 (16.2%) | 28 (4.4%) |
| Total | 679 (100.0%) | 630 (100.0%) |
Earnings by Sex by Educational Attainment in Eagle
Average earnings in Eagle are $75,417 for men and $46,131 for women, a difference of 38.8%. Men with an educational attainment of graduate degree enjoy the highest average annual earnings of $99,167, while those with college or associate's degree education earn the least with $71,250. Women with an educational attainment of bachelor's degree earn the most with the average annual earnings of $51,326, while those with less than high school education have the smallest earnings of $34,318.
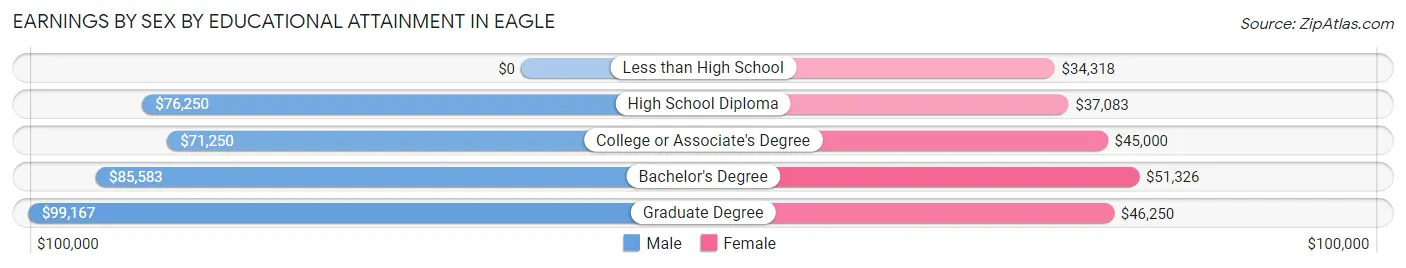
| Educational Attainment | Male Income | Female Income |
| Less than High School | - | - |
| High School Diploma | $76,250 | $37,083 |
| College or Associate's Degree | $71,250 | $45,000 |
| Bachelor's Degree | $85,583 | $51,326 |
| Graduate Degree | $99,167 | $46,250 |
| Total | $75,417 | $46,131 |
Family Income in Eagle
Family Income Brackets in Eagle
According to the Eagle family income data, there are 238 families falling into the $100,000 to $149,999 income range, which is the most common income bracket and makes up 39.0% of all families. Conversely, the $10,000 to $14,999 income bracket is the least frequent group with only 3 families (0.5%) belonging to this category.
| Income Bracket | # Families | % Families |
| Less than $10,000 | 8 | 1.3% |
| $10,000 to $14,999 | 3 | 0.5% |
| $15,000 to $24,999 | 6 | 1.0% |
| $25,000 to $34,999 | 10 | 1.6% |
| $35,000 to $49,999 | 60 | 9.8% |
| $50,000 to $74,999 | 80 | 13.1% |
| $75,000 to $99,999 | 84 | 13.7% |
| $100,000 to $149,999 | 238 | 39.0% |
| $150,000 to $199,999 | 80 | 13.1% |
| $200,000+ | 42 | 6.9% |
Family Income by Famaliy Size in Eagle
5-person families (14 | 2.3%) account for the highest median family income in Eagle with $156,250 per family, while 3-person families (184 | 30.1%) have the highest median income of $49,202 per family member.
| Income Bracket | # Families | Median Income |
| 2-Person Families | 285 (46.6%) | $78,958 |
| 3-Person Families | 184 (30.1%) | $147,607 |
| 4-Person Families | 107 (17.5%) | $126,094 |
| 5-Person Families | 14 (2.3%) | $156,250 |
| 6-Person Families | 6 (1.0%) | $0 |
| 7+ Person Families | 15 (2.5%) | $0 |
| Total | 611 (100.0%) | $118,897 |
Family Income by Number of Earners in Eagle
The median family income in Eagle is $118,897, with families comprising 3+ earners (141) having the highest median family income of $148,839, while families with no earners (89) have the lowest median family income of $37,212, accounting for 23.1% and 14.6% of families, respectively.
| Number of Earners | # Families | Median Income |
| No Earners | 89 (14.6%) | $37,212 |
| 1 Earner | 115 (18.8%) | $68,542 |
| 2 Earners | 266 (43.5%) | $125,000 |
| 3+ Earners | 141 (23.1%) | $148,839 |
| Total | 611 (100.0%) | $118,897 |
Household Income in Eagle
Household Income Brackets in Eagle
With 302 households falling in the category, the $100,000 to $149,999 income range is the most frequent in Eagle, accounting for 38.3% of all households. In contrast, only 6 households (0.8%) fall into the less than $10,000 income bracket, making it the least populous group.
| Income Bracket | # Households | % Households |
| Less than $10,000 | 6 | 0.8% |
| $10,000 to $14,999 | 9 | 1.1% |
| $15,000 to $24,999 | 24 | 3.0% |
| $25,000 to $34,999 | 27 | 3.4% |
| $35,000 to $49,999 | 72 | 9.1% |
| $50,000 to $74,999 | 115 | 14.6% |
| $75,000 to $99,999 | 94 | 11.9% |
| $100,000 to $149,999 | 302 | 38.3% |
| $150,000 to $199,999 | 88 | 11.2% |
| $200,000+ | 51 | 6.5% |
Household Income by Householder Age in Eagle
The median household income in Eagle is $110,500, with the highest median household income of $120,278 found in the 25 to 44 years age bracket for the primary householder. A total of 214 households (27.2%) fall into this category. Meanwhile, the 15 to 24 years age bracket for the primary householder has the lowest median household income of $0, with 31 households (3.9%) in this group.
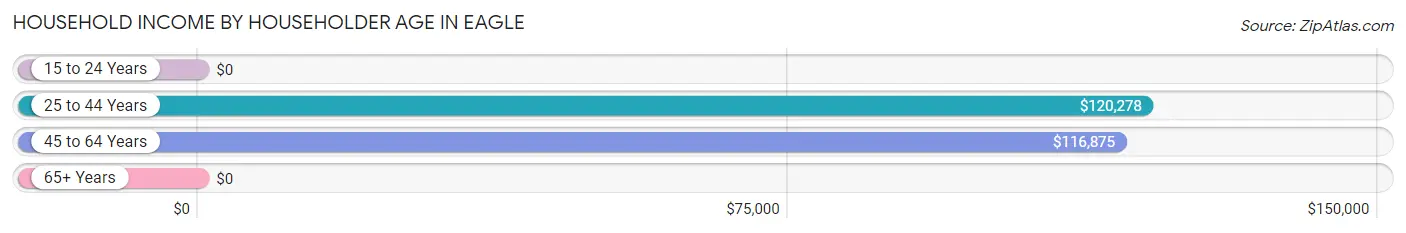
| Income Bracket | # Households | Median Income |
| 15 to 24 Years | 31 (3.9%) | $0 |
| 25 to 44 Years | 214 (27.2%) | $120,278 |
| 45 to 64 Years | 316 (40.1%) | $116,875 |
| 65+ Years | 227 (28.8%) | $0 |
| Total | 788 (100.0%) | $110,500 |
Poverty in Eagle
Income Below Poverty by Sex and Age in Eagle
With 3.6% poverty level for males and 4.9% for females among the residents of Eagle, 15 year old males and 6 to 11 year old females are the most vulnerable to poverty, with 4 males (25.0%) and 10 females (17.0%) in their respective age groups living below the poverty level.
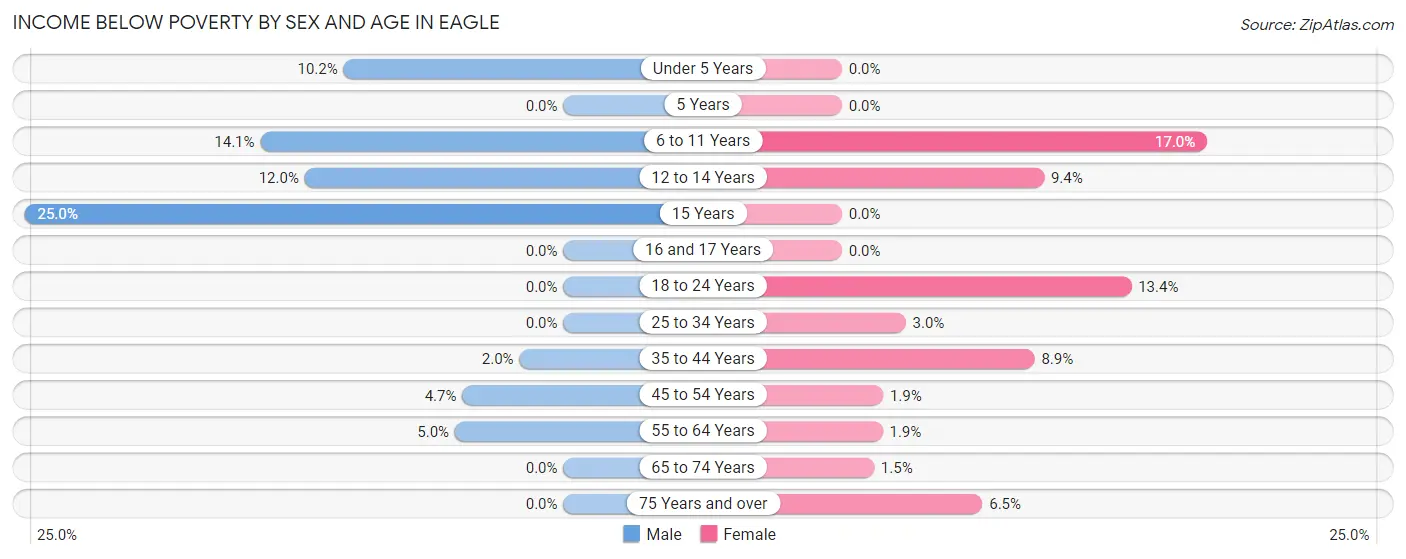
| Age Bracket | Male | Female |
| Under 5 Years | 5 (10.2%) | 0 (0.0%) |
| 5 Years | 0 (0.0%) | 0 (0.0%) |
| 6 to 11 Years | 9 (14.1%) | 10 (17.0%) |
| 12 to 14 Years | 3 (12.0%) | 3 (9.4%) |
| 15 Years | 4 (25.0%) | 0 (0.0%) |
| 16 and 17 Years | 0 (0.0%) | 0 (0.0%) |
| 18 to 24 Years | 0 (0.0%) | 9 (13.4%) |
| 25 to 34 Years | 0 (0.0%) | 5 (3.0%) |
| 35 to 44 Years | 3 (2.0%) | 11 (8.9%) |
| 45 to 54 Years | 6 (4.7%) | 3 (1.9%) |
| 55 to 64 Years | 8 (5.0%) | 3 (1.9%) |
| 65 to 74 Years | 0 (0.0%) | 1 (1.5%) |
| 75 Years and over | 0 (0.0%) | 3 (6.5%) |
| Total | 38 (3.6%) | 48 (4.9%) |
Income Above Poverty by Sex and Age in Eagle
According to the poverty statistics in Eagle, males aged 5 years and females aged under 5 years are the age groups that are most secure financially, with 100.0% of males and 100.0% of females in these age groups living above the poverty line.
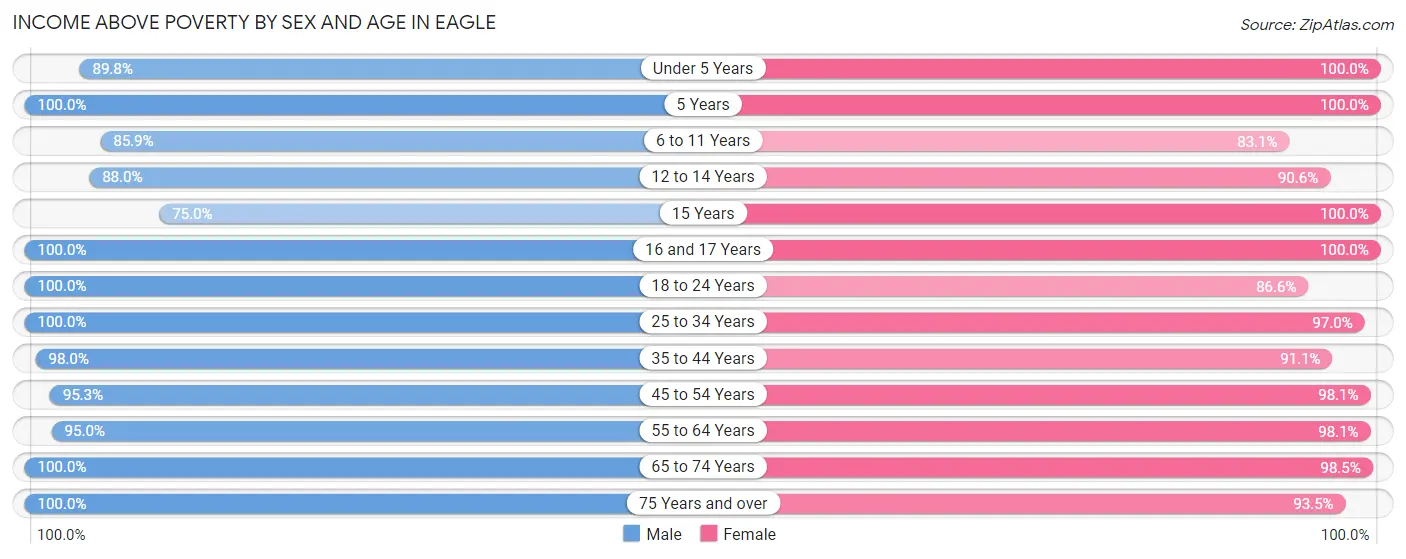
| Age Bracket | Male | Female |
| Under 5 Years | 44 (89.8%) | 63 (100.0%) |
| 5 Years | 29 (100.0%) | 9 (100.0%) |
| 6 to 11 Years | 55 (85.9%) | 49 (83.1%) |
| 12 to 14 Years | 22 (88.0%) | 29 (90.6%) |
| 15 Years | 12 (75.0%) | 16 (100.0%) |
| 16 and 17 Years | 19 (100.0%) | 20 (100.0%) |
| 18 to 24 Years | 118 (100.0%) | 58 (86.6%) |
| 25 to 34 Years | 102 (100.0%) | 164 (97.0%) |
| 35 to 44 Years | 144 (98.0%) | 112 (91.1%) |
| 45 to 54 Years | 122 (95.3%) | 154 (98.1%) |
| 55 to 64 Years | 151 (95.0%) | 156 (98.1%) |
| 65 to 74 Years | 172 (100.0%) | 66 (98.5%) |
| 75 Years and over | 33 (100.0%) | 43 (93.5%) |
| Total | 1,023 (96.4%) | 939 (95.1%) |
Income Below Poverty Among Married-Couple Families in Eagle
The poverty statistics for married-couple families in Eagle show that 2.2% or 12 of the total 553 families live below the poverty line. Families with 3 or 4 children have the highest poverty rate of 15.0%, comprising of 3 families. On the other hand, families with no children have the lowest poverty rate of 0.8%, which includes 3 families.
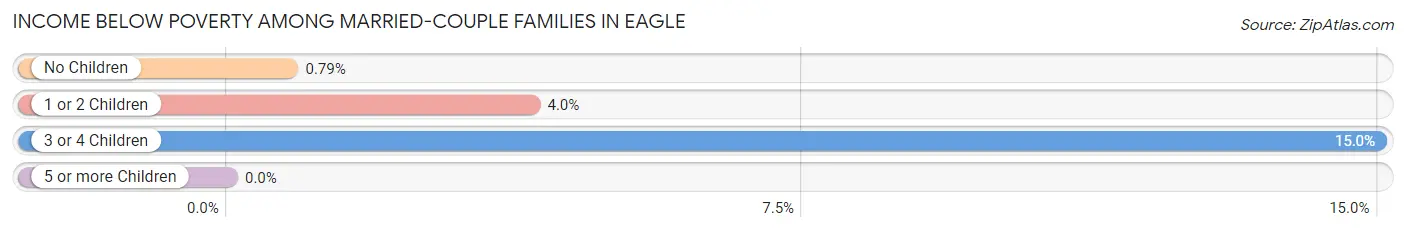
| Children | Above Poverty | Below Poverty |
| No Children | 378 (99.2%) | 3 (0.8%) |
| 1 or 2 Children | 146 (96.1%) | 6 (4.0%) |
| 3 or 4 Children | 17 (85.0%) | 3 (15.0%) |
| 5 or more Children | 0 (0.0%) | 0 (0.0%) |
| Total | 541 (97.8%) | 12 (2.2%) |
Income Below Poverty Among Single-Parent Households in Eagle
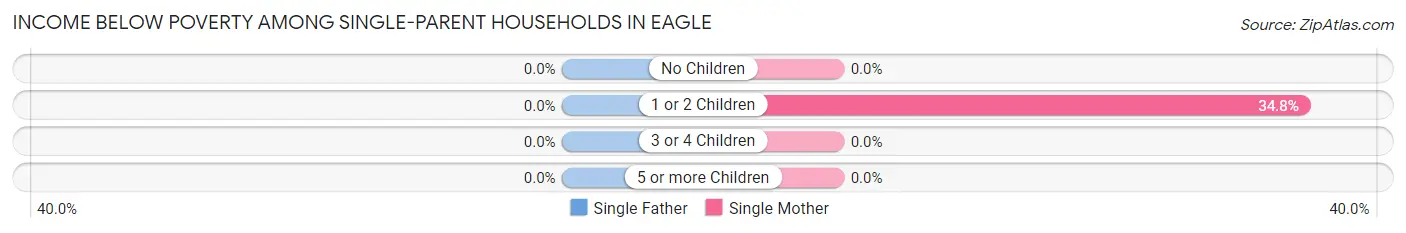
| Children | Single Father | Single Mother |
| No Children | 0 (0.0%) | 0 (0.0%) |
| 1 or 2 Children | 0 (0.0%) | 8 (34.8%) |
| 3 or 4 Children | 0 (0.0%) | 0 (0.0%) |
| 5 or more Children | 0 (0.0%) | 0 (0.0%) |
| Total | 0 (0.0%) | 8 (18.2%) |
Income Below Poverty Among Married-Couple vs Single-Parent Households in Eagle
The poverty data for Eagle shows that 12 of the married-couple family households (2.2%) and 8 of the single-parent households (13.8%) are living below the poverty level. Within the married-couple family households, those with 3 or 4 children have the highest poverty rate, with 3 households (15.0%) falling below the poverty line. Among the single-parent households, those with 1 or 2 children have the highest poverty rate, with 8 household (23.5%) living below poverty.
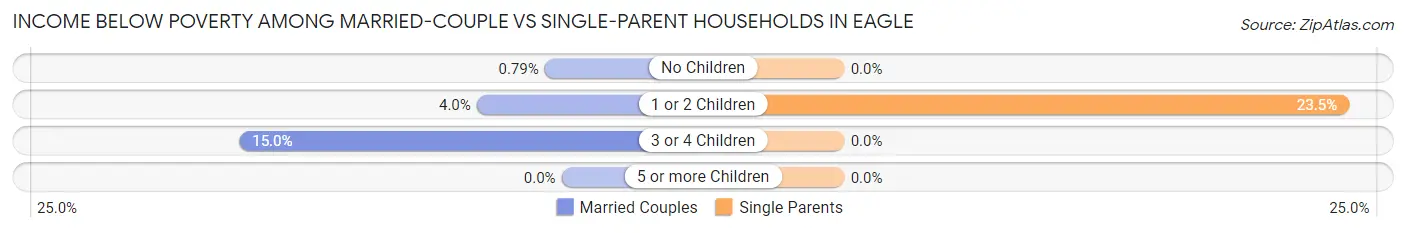
| Children | Married-Couple Families | Single-Parent Households |
| No Children | 3 (0.8%) | 0 (0.0%) |
| 1 or 2 Children | 6 (4.0%) | 8 (23.5%) |
| 3 or 4 Children | 3 (15.0%) | 0 (0.0%) |
| 5 or more Children | 0 (0.0%) | 0 (0.0%) |
| Total | 12 (2.2%) | 8 (13.8%) |
Race in Eagle
The most populous races in Eagle are White / Caucasian (1,901 | 92.7%), Hispanic or Latino (120 | 5.9%), and Two or more Races (77 | 3.8%).
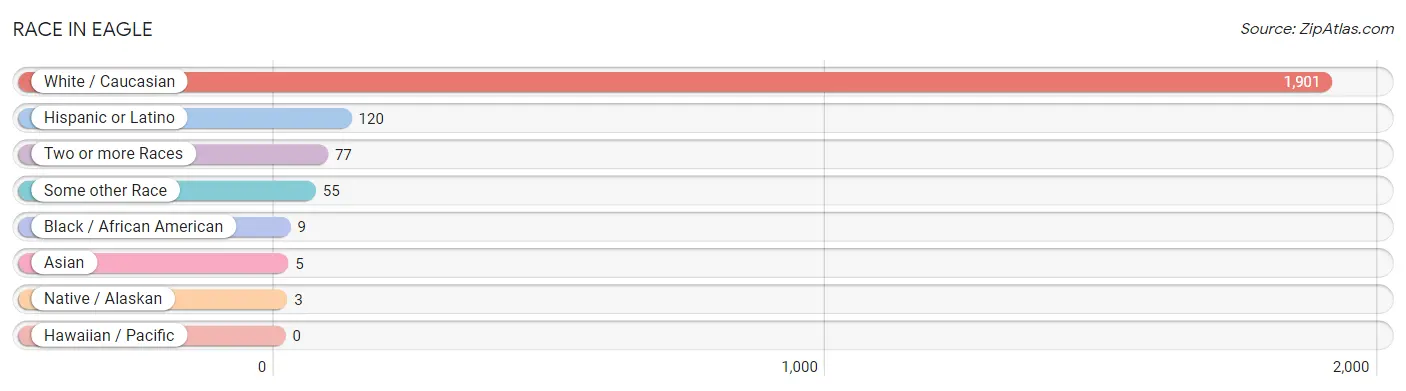
| Race | # Population | % Population |
| Asian | 5 | 0.2% |
| Black / African American | 9 | 0.4% |
| Hawaiian / Pacific | 0 | 0.0% |
| Hispanic or Latino | 120 | 5.9% |
| Native / Alaskan | 3 | 0.2% |
| White / Caucasian | 1,901 | 92.7% |
| Two or more Races | 77 | 3.8% |
| Some other Race | 55 | 2.7% |
| Total | 2,050 | 100.0% |
Ancestry in Eagle
The most populous ancestries reported in Eagle are German (853 | 41.6%), Polish (293 | 14.3%), Irish (233 | 11.4%), English (156 | 7.6%), and Norwegian (119 | 5.8%), together accounting for 80.7% of all Eagle residents.
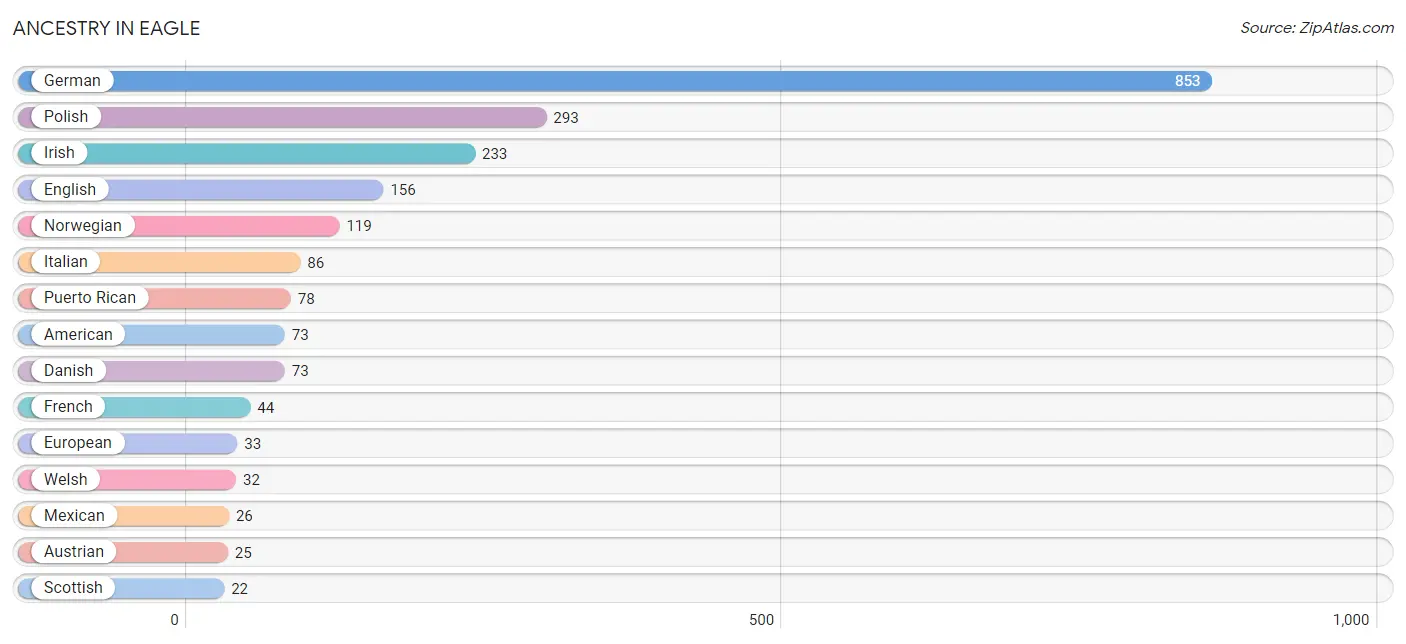
| Ancestry | # Population | % Population |
| African | 7 | 0.3% |
| American | 73 | 3.6% |
| Arab | 17 | 0.8% |
| Austrian | 25 | 1.2% |
| British | 6 | 0.3% |
| Burmese | 5 | 0.2% |
| Central American | 16 | 0.8% |
| Croatian | 17 | 0.8% |
| Czech | 8 | 0.4% |
| Danish | 73 | 3.6% |
| Dutch | 13 | 0.6% |
| English | 156 | 7.6% |
| European | 33 | 1.6% |
| Finnish | 15 | 0.7% |
| French | 44 | 2.1% |
| French Canadian | 5 | 0.2% |
| German | 853 | 41.6% |
| Greek | 5 | 0.2% |
| Guatemalan | 5 | 0.2% |
| Honduran | 11 | 0.5% |
| Hungarian | 3 | 0.2% |
| Irish | 233 | 11.4% |
| Italian | 86 | 4.2% |
| Mexican | 26 | 1.3% |
| Mexican American Indian | 3 | 0.2% |
| Northern European | 19 | 0.9% |
| Norwegian | 119 | 5.8% |
| Polish | 293 | 14.3% |
| Puerto Rican | 78 | 3.8% |
| Russian | 11 | 0.5% |
| Scandinavian | 6 | 0.3% |
| Scottish | 22 | 1.1% |
| Serbian | 9 | 0.4% |
| Slovene | 5 | 0.2% |
| Subsaharan African | 7 | 0.3% |
| Swedish | 17 | 0.8% |
| Swiss | 10 | 0.5% |
| Welsh | 32 | 1.6% |
| Yugoslavian | 9 | 0.4% | View All 39 Rows |
Immigrants in Eagle
The most numerous immigrant groups reported in Eagle came from Asia (11 | 0.5%), Canada (9 | 0.4%), Central America (8 | 0.4%), Latin America (8 | 0.4%), and Europe (6 | 0.3%), together accounting for 2.1% of all Eagle residents.
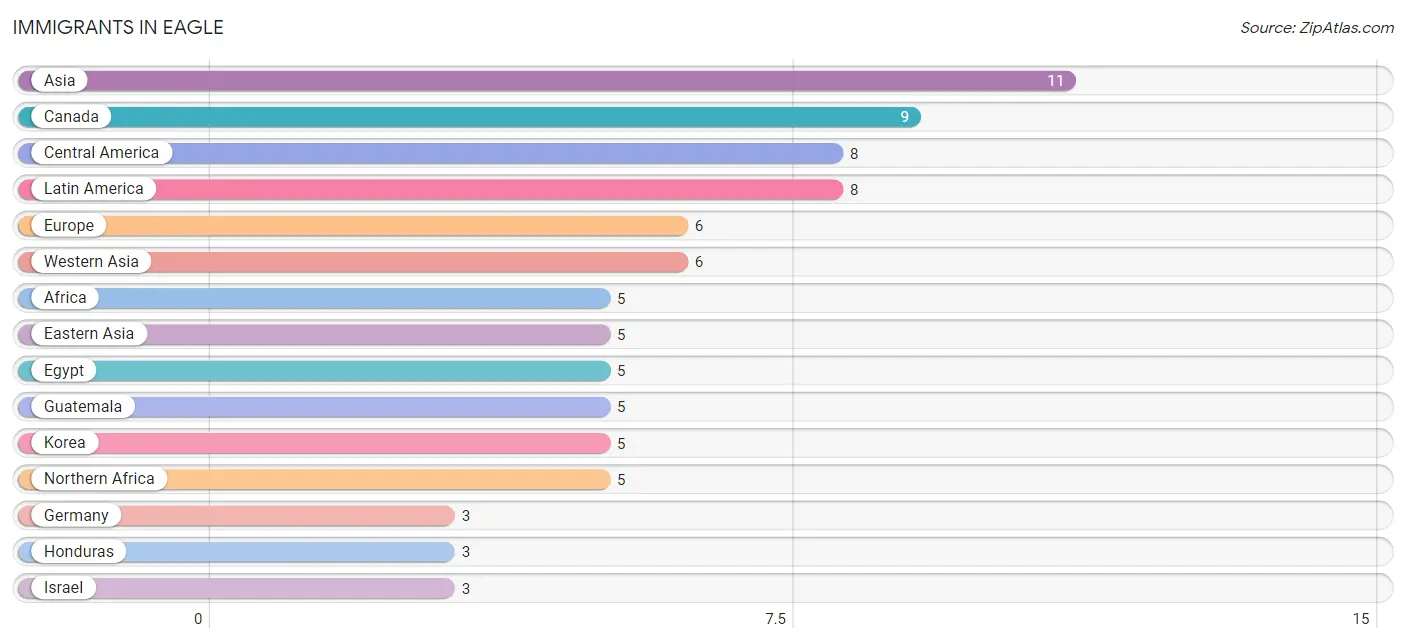
| Immigration Origin | # Population | % Population |
| Africa | 5 | 0.2% |
| Asia | 11 | 0.5% |
| Canada | 9 | 0.4% |
| Central America | 8 | 0.4% |
| Eastern Asia | 5 | 0.2% |
| Egypt | 5 | 0.2% |
| Europe | 6 | 0.3% |
| Germany | 3 | 0.2% |
| Guatemala | 5 | 0.2% |
| Honduras | 3 | 0.2% |
| Israel | 3 | 0.2% |
| Italy | 3 | 0.2% |
| Korea | 5 | 0.2% |
| Kuwait | 3 | 0.2% |
| Latin America | 8 | 0.4% |
| Northern Africa | 5 | 0.2% |
| Southern Europe | 3 | 0.2% |
| Western Asia | 6 | 0.3% |
| Western Europe | 3 | 0.2% | View All 19 Rows |
Sex and Age in Eagle
Sex and Age in Eagle
The most populous age groups in Eagle are 65 to 69 Years (149 | 14.0%) for men and 40 to 44 Years (97 | 9.8%) for women.
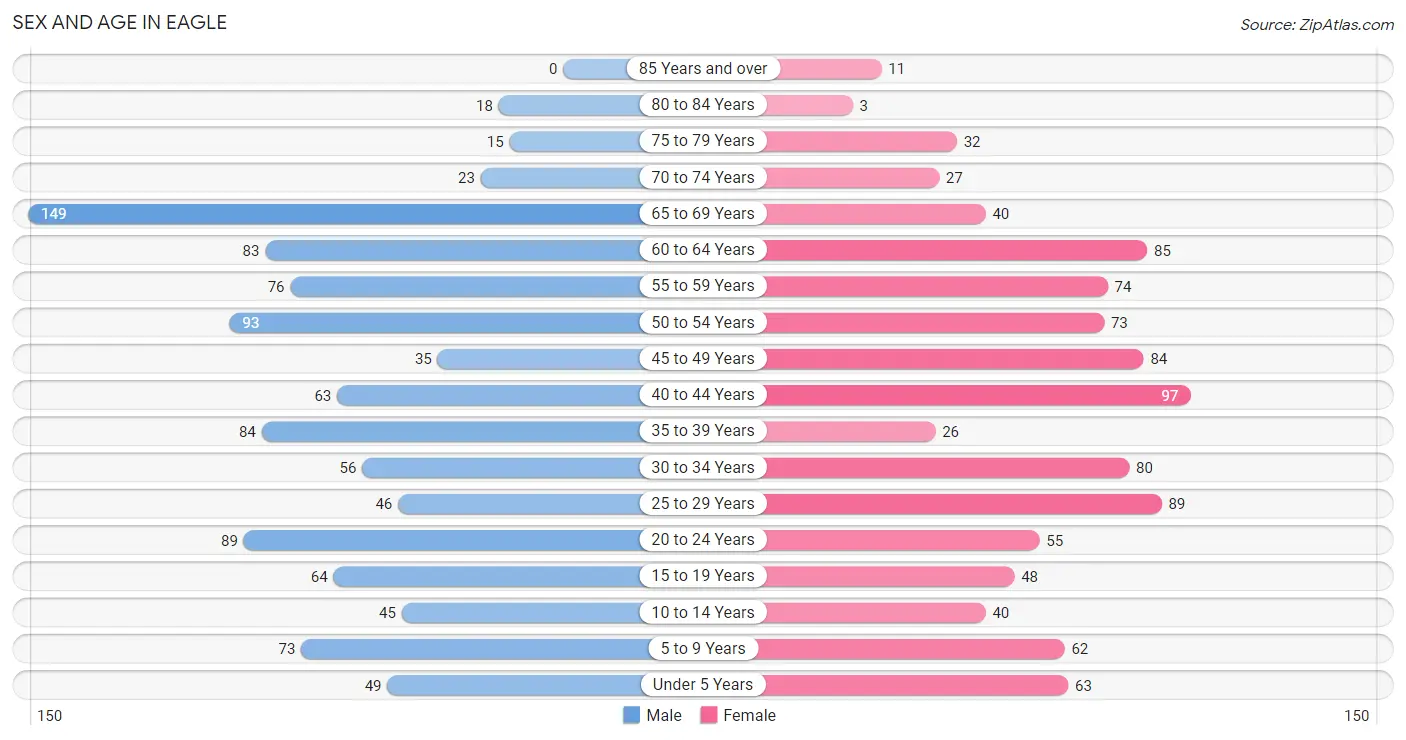
| Age Bracket | Male | Female |
| Under 5 Years | 49 (4.6%) | 63 (6.4%) |
| 5 to 9 Years | 73 (6.9%) | 62 (6.3%) |
| 10 to 14 Years | 45 (4.2%) | 40 (4.0%) |
| 15 to 19 Years | 64 (6.0%) | 48 (4.9%) |
| 20 to 24 Years | 89 (8.4%) | 55 (5.6%) |
| 25 to 29 Years | 46 (4.3%) | 89 (9.0%) |
| 30 to 34 Years | 56 (5.3%) | 80 (8.1%) |
| 35 to 39 Years | 84 (7.9%) | 26 (2.6%) |
| 40 to 44 Years | 63 (5.9%) | 97 (9.8%) |
| 45 to 49 Years | 35 (3.3%) | 84 (8.5%) |
| 50 to 54 Years | 93 (8.8%) | 73 (7.4%) |
| 55 to 59 Years | 76 (7.2%) | 74 (7.5%) |
| 60 to 64 Years | 83 (7.8%) | 85 (8.6%) |
| 65 to 69 Years | 149 (14.0%) | 40 (4.0%) |
| 70 to 74 Years | 23 (2.2%) | 27 (2.7%) |
| 75 to 79 Years | 15 (1.4%) | 32 (3.2%) |
| 80 to 84 Years | 18 (1.7%) | 3 (0.3%) |
| 85 Years and over | 0 (0.0%) | 11 (1.1%) |
| Total | 1,061 (100.0%) | 989 (100.0%) |
Families and Households in Eagle
Median Family Size in Eagle
The median family size in Eagle is 2.84 persons per family, with single male/father families (14 | 2.3%) accounting for the largest median family size of 5.71 persons per family. On the other hand, single female/mother families (44 | 7.2%) represent the smallest median family size with 2.59 persons per family.
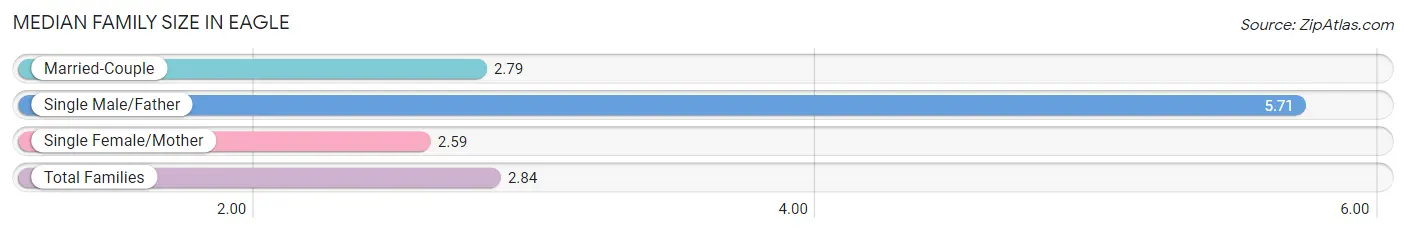
| Family Type | # Families | Family Size |
| Married-Couple | 553 (90.5%) | 2.79 |
| Single Male/Father | 14 (2.3%) | 5.71 |
| Single Female/Mother | 44 (7.2%) | 2.59 |
| Total Families | 611 (100.0%) | 2.84 |
Median Household Size in Eagle
The median household size in Eagle is 2.60 persons per household, with single male/father households (14 | 1.8%) accounting for the largest median household size of 8.57 persons per household. non-family households (177 | 22.5%) represent the smallest median household size with 1.45 persons per household.
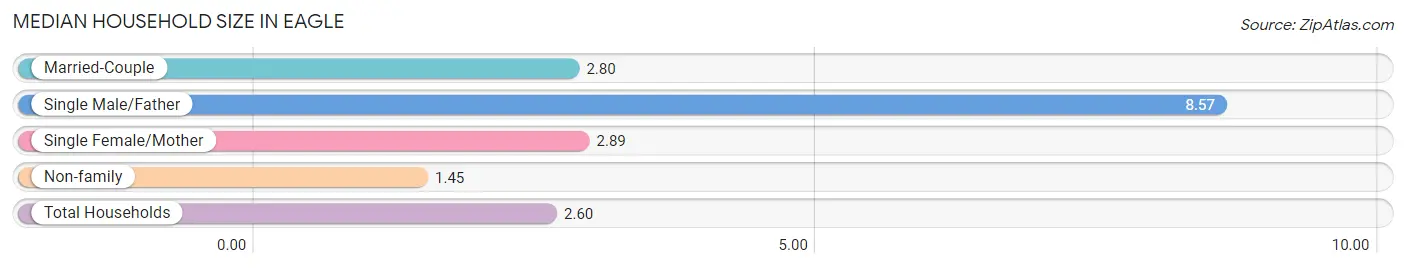
| Household Type | # Households | Household Size |
| Married-Couple | 553 (70.2%) | 2.80 |
| Single Male/Father | 14 (1.8%) | 8.57 |
| Single Female/Mother | 44 (5.6%) | 2.89 |
| Non-family | 177 (22.5%) | 1.45 |
| Total Households | 788 (100.0%) | 2.60 |
Household Size by Marriage Status in Eagle
Out of a total of 788 households in Eagle, 611 (77.5%) are family households, while 177 (22.5%) are nonfamily households. The most numerous type of family households are 2-person households, comprising 270, and the most common type of nonfamily households are 1-person households, comprising 100.
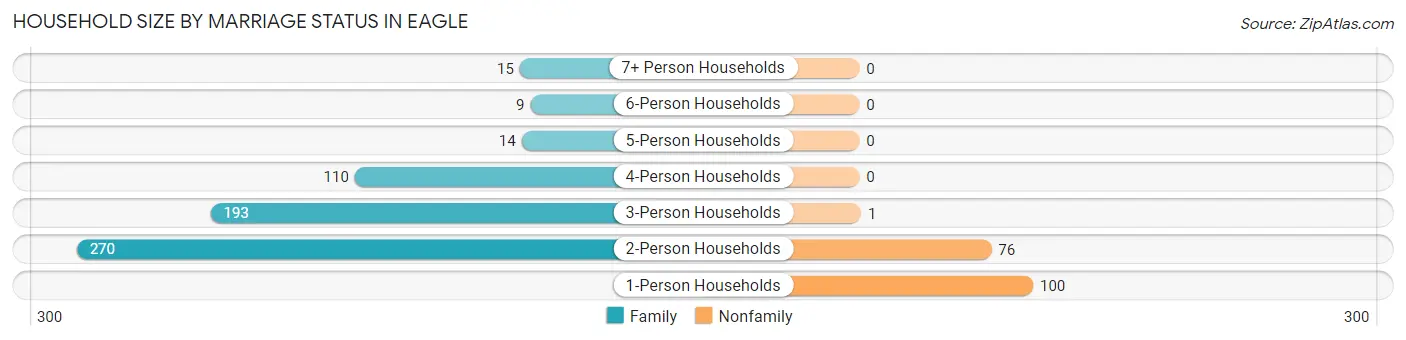
| Household Size | Family Households | Nonfamily Households |
| 1-Person Households | - | 100 (12.7%) |
| 2-Person Households | 270 (34.3%) | 76 (9.6%) |
| 3-Person Households | 193 (24.5%) | 1 (0.1%) |
| 4-Person Households | 110 (14.0%) | 0 (0.0%) |
| 5-Person Households | 14 (1.8%) | 0 (0.0%) |
| 6-Person Households | 9 (1.1%) | 0 (0.0%) |
| 7+ Person Households | 15 (1.9%) | 0 (0.0%) |
| Total | 611 (77.5%) | 177 (22.5%) |
Female Fertility in Eagle
Fertility by Age in Eagle
Average fertility rate in Eagle is 39.0 births per 1,000 women. Women in the age bracket of 20 to 34 years have the highest fertility rate with 85.0 births per 1,000 women. Women in the age bracket of 20 to 34 years acount for 100.0% of all women with births.
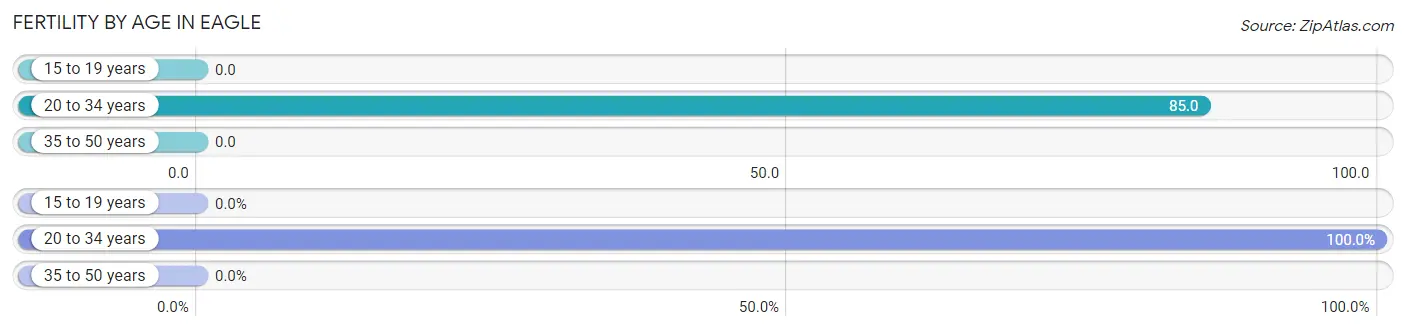
| Age Bracket | Women with Births | Births / 1,000 Women |
| 15 to 19 years | 0 (0.0%) | 0.0 |
| 20 to 34 years | 19 (100.0%) | 85.0 |
| 35 to 50 years | 0 (0.0%) | 0.0 |
| Total | 19 (100.0%) | 39.0 |
Fertility by Age by Marriage Status in Eagle
73.7% of women with births (19) in Eagle are married. The highest percentage of unmarried women with births falls into 20 to 34 years age bracket with 26.3% of them unmarried at the time of birth, while the lowest percentage of unmarried women with births belong to 20 to 34 years age bracket with 26.3% of them unmarried.
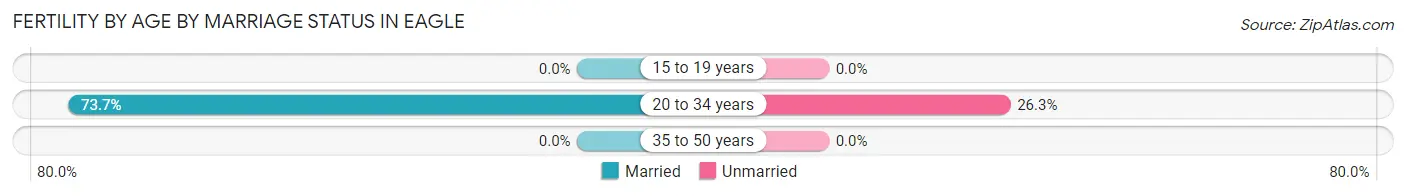
| Age Bracket | Married | Unmarried |
| 15 to 19 years | 0 (0.0%) | 0 (0.0%) |
| 20 to 34 years | 14 (73.7%) | 5 (26.3%) |
| 35 to 50 years | 0 (0.0%) | 0 (0.0%) |
| Total | 14 (73.7%) | 5 (26.3%) |
Fertility by Education in Eagle
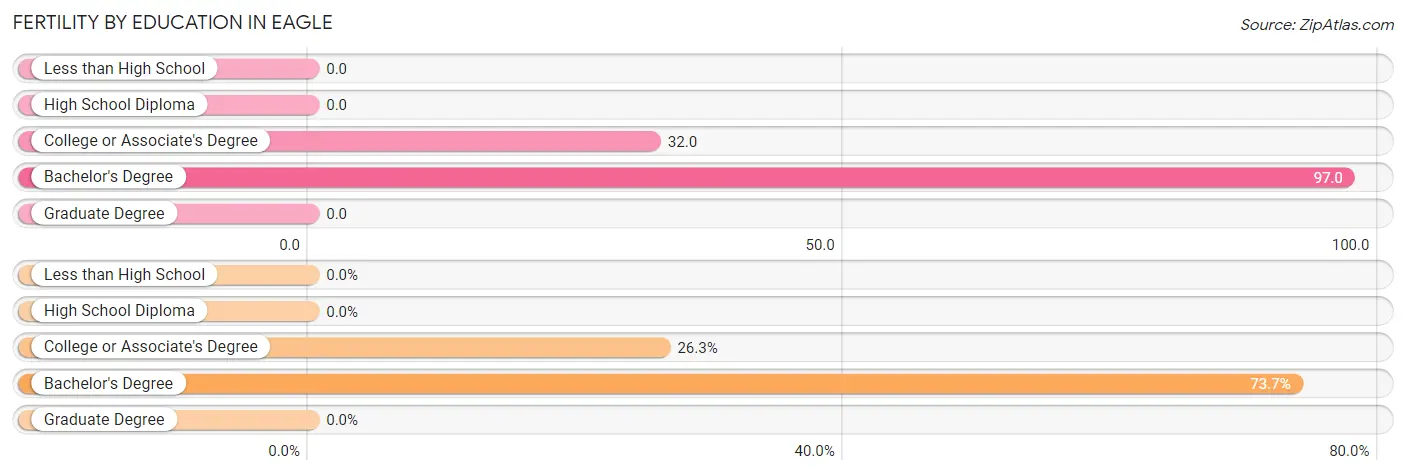
| Educational Attainment | Women with Births | Births / 1,000 Women |
| Less than High School | 0 (0.0%) | 0.0 |
| High School Diploma | 0 (0.0%) | 0.0 |
| College or Associate's Degree | 5 (26.3%) | 32.0 |
| Bachelor's Degree | 14 (73.7%) | 97.0 |
| Graduate Degree | 0 (0.0%) | 0.0 |
| Total | 19 (100.0%) | 39.0 |
Fertility by Education by Marriage Status in Eagle
26.3% of women with births in Eagle are unmarried. Women with the educational attainment of bachelor's degree are most likely to be married with 100.0% of them married at childbirth, while women with the educational attainment of college or associate's degree are least likely to be married with 100.0% of them unmarried at childbirth.
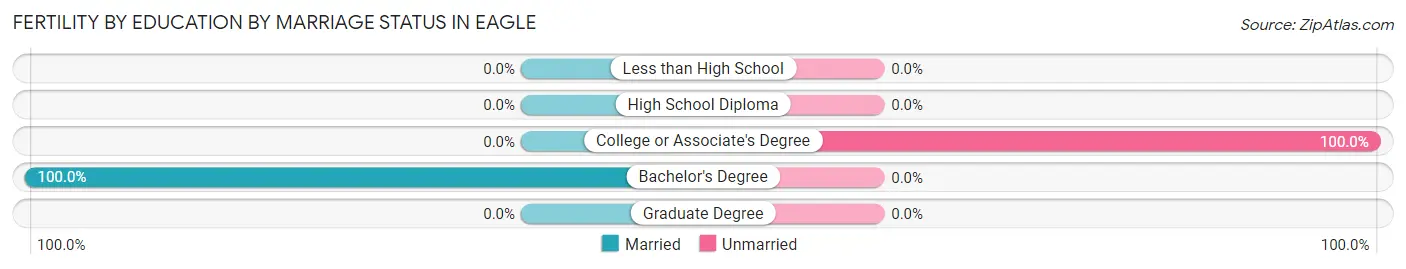
| Educational Attainment | Married | Unmarried |
| Less than High School | 0 (0.0%) | 0 (0.0%) |
| High School Diploma | 0 (0.0%) | 0 (0.0%) |
| College or Associate's Degree | 0 (0.0%) | 5 (100.0%) |
| Bachelor's Degree | 14 (100.0%) | 0 (0.0%) |
| Graduate Degree | 0 (0.0%) | 0 (0.0%) |
| Total | 14 (73.7%) | 5 (26.3%) |
Employment Characteristics in Eagle
Employment by Class of Employer in Eagle
Among the 1,210 employed individuals in Eagle, private company employees (765 | 63.2%), not-for-profit organizations (193 | 16.0%), and local government employees (82 | 6.8%) make up the most common classes of employment.
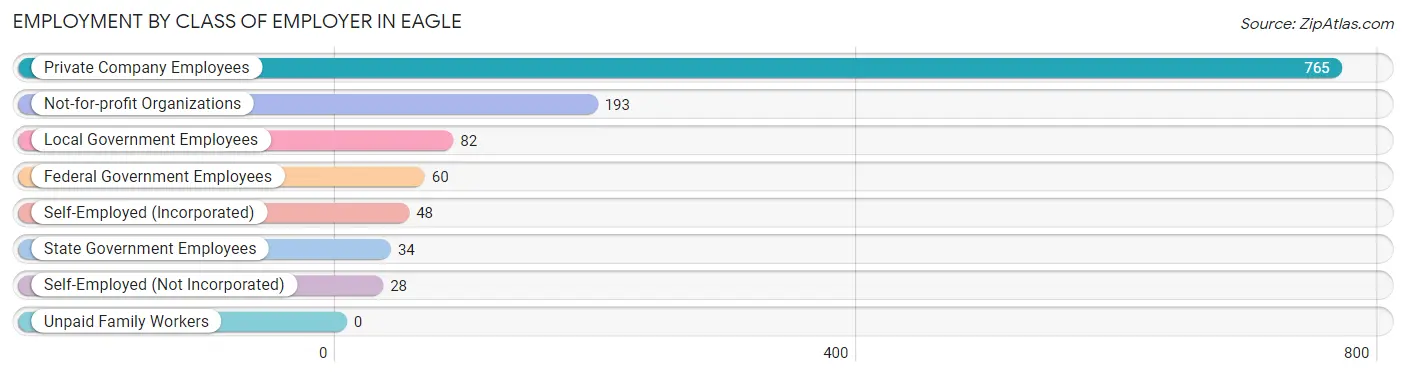
| Employer Class | # Employees | % Employees |
| Private Company Employees | 765 | 63.2% |
| Self-Employed (Incorporated) | 48 | 4.0% |
| Self-Employed (Not Incorporated) | 28 | 2.3% |
| Not-for-profit Organizations | 193 | 16.0% |
| Local Government Employees | 82 | 6.8% |
| State Government Employees | 34 | 2.8% |
| Federal Government Employees | 60 | 5.0% |
| Unpaid Family Workers | 0 | 0.0% |
| Total | 1,210 | 100.0% |
Employment Status by Age in Eagle
According to the labor force statistics for Eagle, out of the total population over 16 years of age (1,686), 74.0% or 1,248 individuals are in the labor force, with 1.8% or 22 of them unemployed. The age group with the highest labor force participation rate is 25 to 29 years, with 100.0% or 135 individuals in the labor force. Within the labor force, the 20 to 24 years age range has the highest percentage of unemployed individuals, with 10.5% or 13 of them being unemployed.
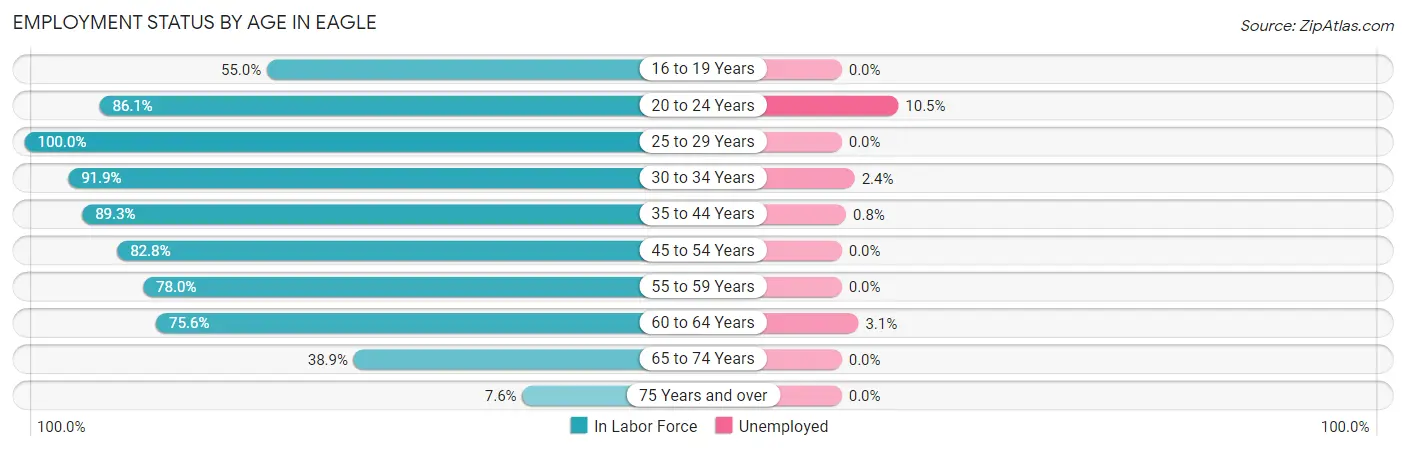
| Age Bracket | In Labor Force | Unemployed |
| 16 to 19 Years | 44 (55.0%) | 0 (0.0%) |
| 20 to 24 Years | 124 (86.1%) | 13 (10.5%) |
| 25 to 29 Years | 135 (100.0%) | 0 (0.0%) |
| 30 to 34 Years | 125 (91.9%) | 3 (2.4%) |
| 35 to 44 Years | 241 (89.3%) | 2 (0.8%) |
| 45 to 54 Years | 236 (82.8%) | 0 (0.0%) |
| 55 to 59 Years | 117 (78.0%) | 0 (0.0%) |
| 60 to 64 Years | 127 (75.6%) | 4 (3.1%) |
| 65 to 74 Years | 93 (38.9%) | 0 (0.0%) |
| 75 Years and over | 6 (7.6%) | 0 (0.0%) |
| Total | 1,248 (74.0%) | 22 (1.8%) |
Employment Status by Educational Attainment in Eagle
According to labor force statistics for Eagle, 85.8% of individuals (982) out of the total population between 25 and 64 years of age (1,144) are in the labor force, with 0.9% or 9 of them being unemployed. The group with the highest labor force participation rate are those with the educational attainment of bachelor's degree or higher, with 96.4% or 353 individuals in the labor force. Within the labor force, individuals with high school diploma education have the highest percentage of unemployment, with 2.7% or 7 of them being unemployed.
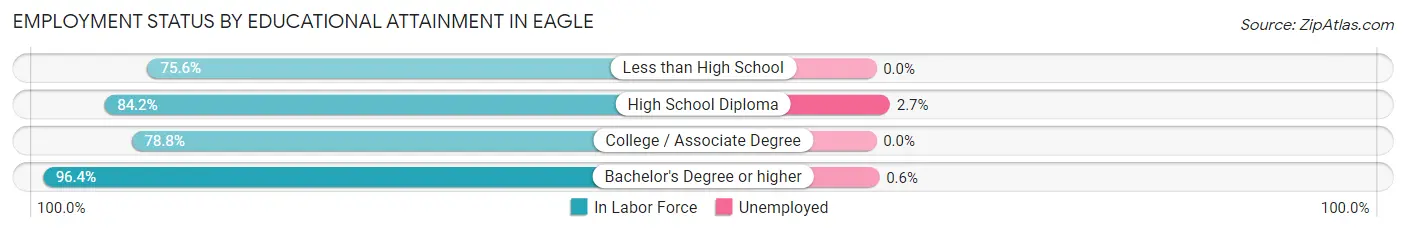
| Educational Attainment | In Labor Force | Unemployed |
| Less than High School | 34 (75.6%) | 0 (0.0%) |
| High School Diploma | 256 (84.2%) | 8 (2.7%) |
| College / Associate Degree | 338 (78.8%) | 0 (0.0%) |
| Bachelor's Degree or higher | 353 (96.4%) | 2 (0.6%) |
| Total | 982 (85.8%) | 10 (0.9%) |
Employment Occupations by Sex in Eagle
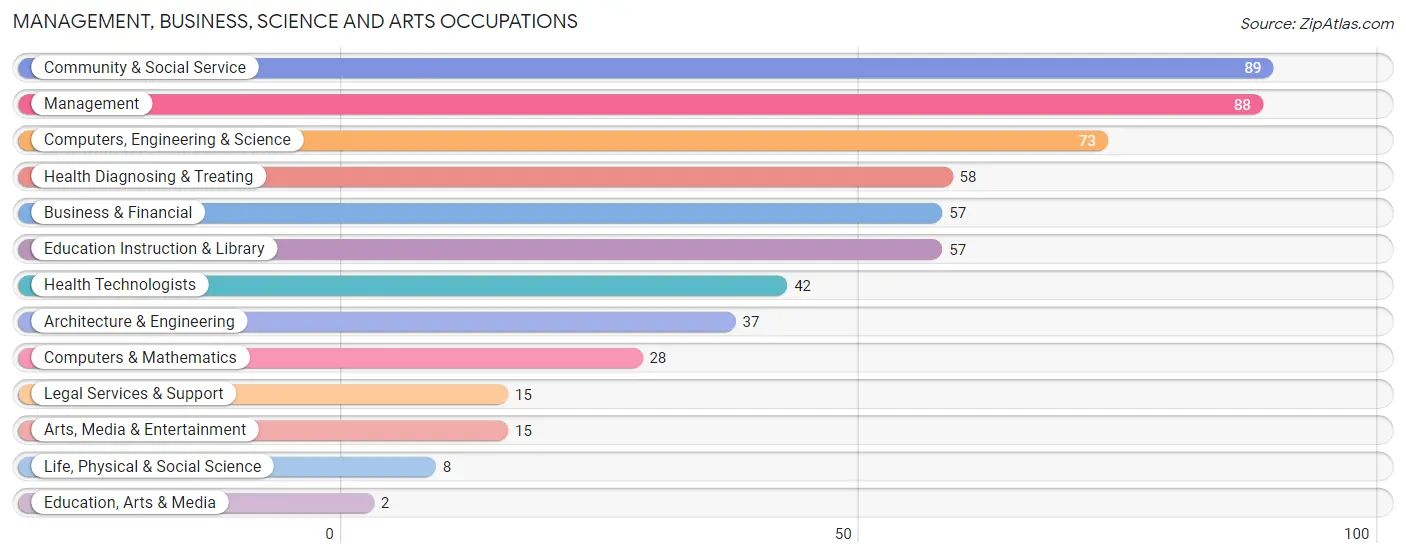
Management, Business, Science and Arts Occupations
The most common Management, Business, Science and Arts occupations in Eagle are Community & Social Service (89 | 7.3%), Management (88 | 7.2%), Computers, Engineering & Science (73 | 5.9%), Health Diagnosing & Treating (58 | 4.7%), and Business & Financial (57 | 4.6%).
Management, Business, Science and Arts Occupations by Sex
Within the Management, Business, Science and Arts occupations in Eagle, the most male-oriented occupations are Computers & Mathematics (100.0%), Life, Physical & Social Science (100.0%), and Computers, Engineering & Science (89.0%), while the most female-oriented occupations are Education, Arts & Media (100.0%), Education Instruction & Library (82.5%), and Business & Financial (80.7%).
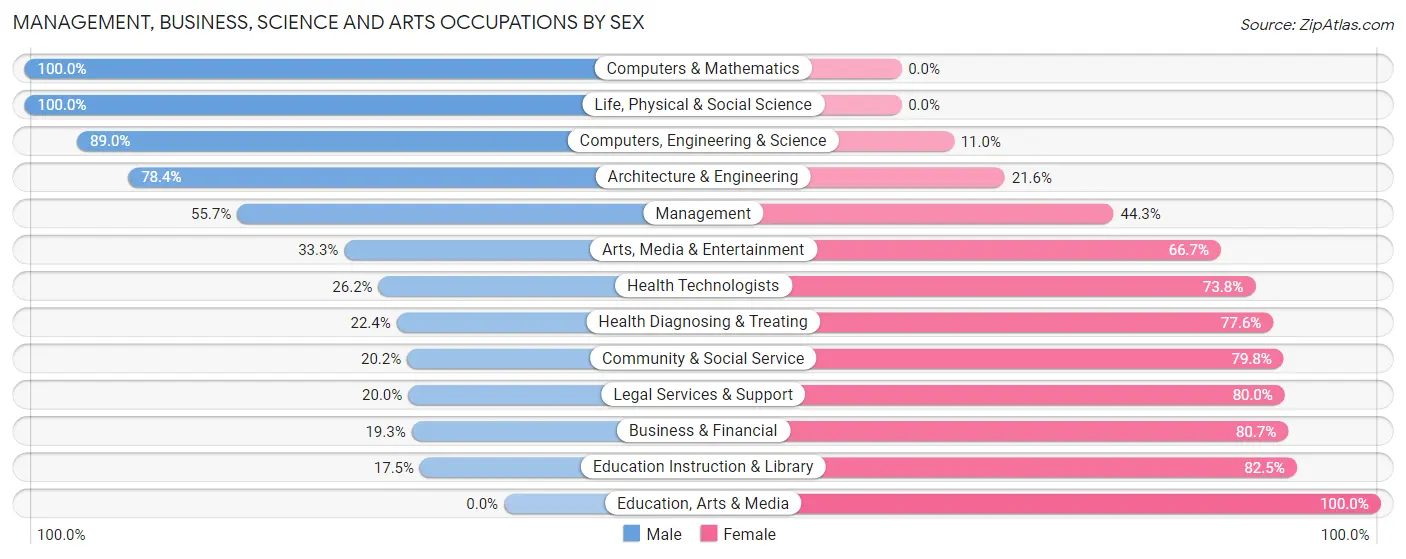
| Occupation | Male | Female |
| Management | 49 (55.7%) | 39 (44.3%) |
| Business & Financial | 11 (19.3%) | 46 (80.7%) |
| Computers, Engineering & Science | 65 (89.0%) | 8 (11.0%) |
| Computers & Mathematics | 28 (100.0%) | 0 (0.0%) |
| Architecture & Engineering | 29 (78.4%) | 8 (21.6%) |
| Life, Physical & Social Science | 8 (100.0%) | 0 (0.0%) |
| Community & Social Service | 18 (20.2%) | 71 (79.8%) |
| Education, Arts & Media | 0 (0.0%) | 2 (100.0%) |
| Legal Services & Support | 3 (20.0%) | 12 (80.0%) |
| Education Instruction & Library | 10 (17.5%) | 47 (82.5%) |
| Arts, Media & Entertainment | 5 (33.3%) | 10 (66.7%) |
| Health Diagnosing & Treating | 13 (22.4%) | 45 (77.6%) |
| Health Technologists | 11 (26.2%) | 31 (73.8%) |
| Total (Category) | 156 (42.7%) | 209 (57.3%) |
| Total (Overall) | 623 (50.8%) | 603 (49.2%) |
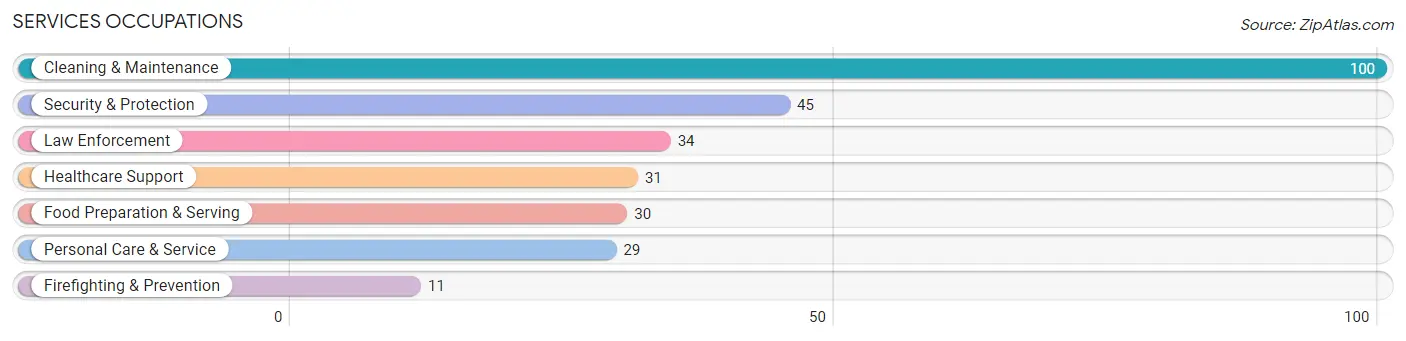
Services Occupations
The most common Services occupations in Eagle are Cleaning & Maintenance (100 | 8.2%), Security & Protection (45 | 3.7%), Law Enforcement (34 | 2.8%), Healthcare Support (31 | 2.5%), and Food Preparation & Serving (30 | 2.5%).
Services Occupations by Sex
Within the Services occupations in Eagle, the most male-oriented occupations are Cleaning & Maintenance (87.0%), Firefighting & Prevention (63.6%), and Food Preparation & Serving (46.7%), while the most female-oriented occupations are Healthcare Support (100.0%), Personal Care & Service (100.0%), and Law Enforcement (73.5%).
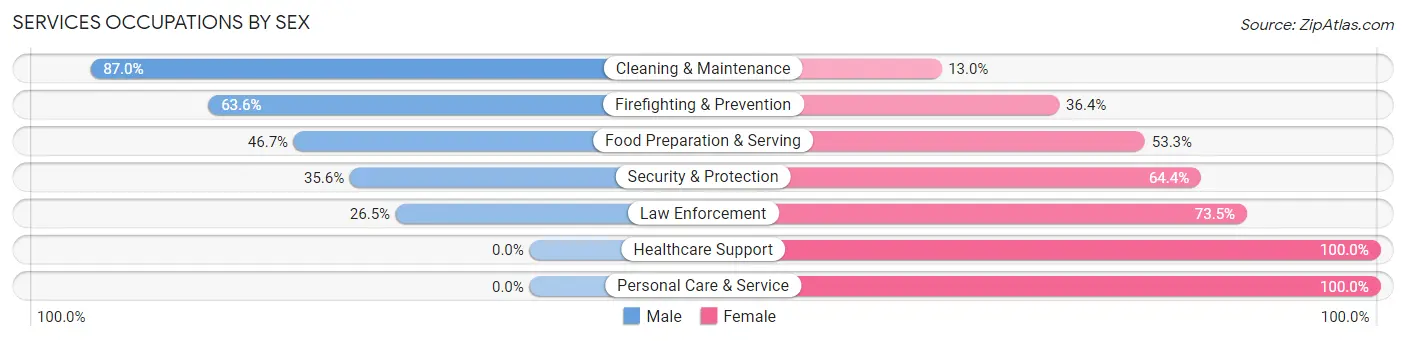
| Occupation | Male | Female |
| Healthcare Support | 0 (0.0%) | 31 (100.0%) |
| Security & Protection | 16 (35.6%) | 29 (64.4%) |
| Firefighting & Prevention | 7 (63.6%) | 4 (36.4%) |
| Law Enforcement | 9 (26.5%) | 25 (73.5%) |
| Food Preparation & Serving | 14 (46.7%) | 16 (53.3%) |
| Cleaning & Maintenance | 87 (87.0%) | 13 (13.0%) |
| Personal Care & Service | 0 (0.0%) | 29 (100.0%) |
| Total (Category) | 117 (49.8%) | 118 (50.2%) |
| Total (Overall) | 623 (50.8%) | 603 (49.2%) |
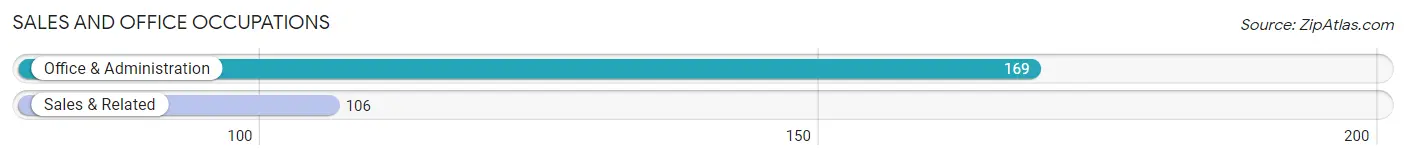
Sales and Office Occupations
The most common Sales and Office occupations in Eagle are Office & Administration (169 | 13.8%), and Sales & Related (106 | 8.6%).
Sales and Office Occupations by Sex
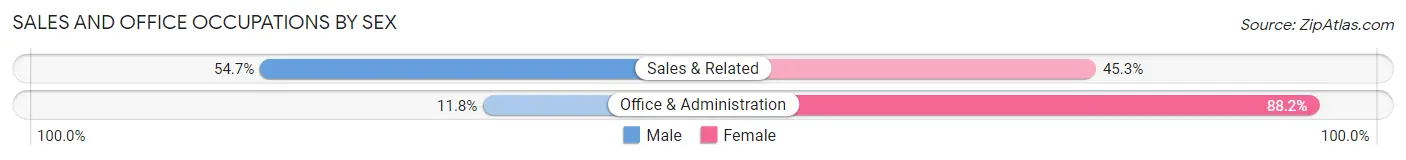
| Occupation | Male | Female |
| Sales & Related | 58 (54.7%) | 48 (45.3%) |
| Office & Administration | 20 (11.8%) | 149 (88.2%) |
| Total (Category) | 78 (28.4%) | 197 (71.6%) |
| Total (Overall) | 623 (50.8%) | 603 (49.2%) |
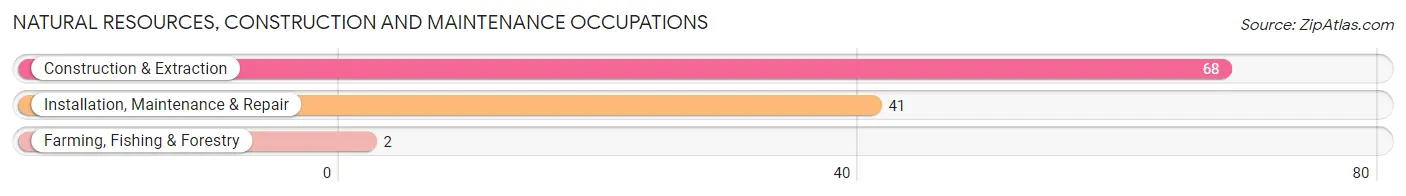
Natural Resources, Construction and Maintenance Occupations
The most common Natural Resources, Construction and Maintenance occupations in Eagle are Construction & Extraction (68 | 5.6%), Installation, Maintenance & Repair (41 | 3.3%), and Farming, Fishing & Forestry (2 | 0.2%).
Natural Resources, Construction and Maintenance Occupations by Sex
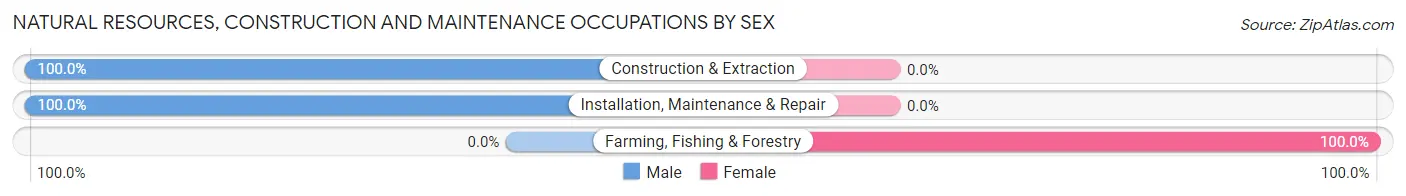
| Occupation | Male | Female |
| Farming, Fishing & Forestry | 0 (0.0%) | 2 (100.0%) |
| Construction & Extraction | 68 (100.0%) | 0 (0.0%) |
| Installation, Maintenance & Repair | 41 (100.0%) | 0 (0.0%) |
| Total (Category) | 109 (98.2%) | 2 (1.8%) |
| Total (Overall) | 623 (50.8%) | 603 (49.2%) |
Production, Transportation and Moving Occupations
The most common Production, Transportation and Moving occupations in Eagle are Production (117 | 9.5%), Transportation (68 | 5.6%), and Material Moving (55 | 4.5%).
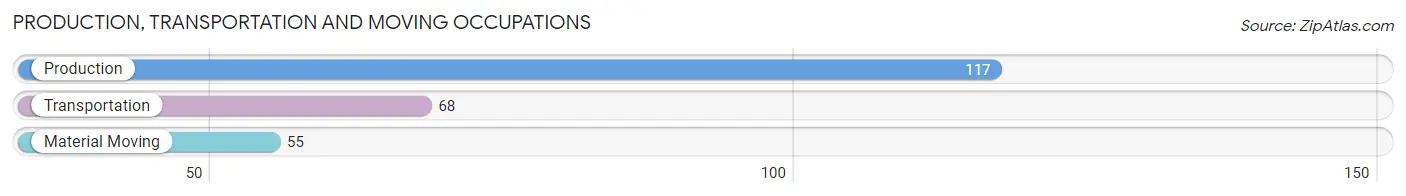
Production, Transportation and Moving Occupations by Sex
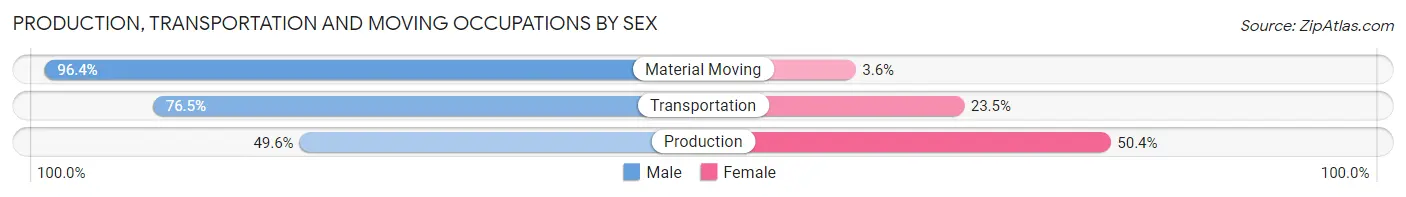
| Occupation | Male | Female |
| Production | 58 (49.6%) | 59 (50.4%) |
| Transportation | 52 (76.5%) | 16 (23.5%) |
| Material Moving | 53 (96.4%) | 2 (3.6%) |
| Total (Category) | 163 (67.9%) | 77 (32.1%) |
| Total (Overall) | 623 (50.8%) | 603 (49.2%) |
Employment Industries by Sex in Eagle
Employment Industries in Eagle
The major employment industries in Eagle include Manufacturing (257 | 21.0%), Educational Services (173 | 14.1%), Retail Trade (133 | 10.8%), Health Care & Social Assistance (120 | 9.8%), and Construction (91 | 7.4%).
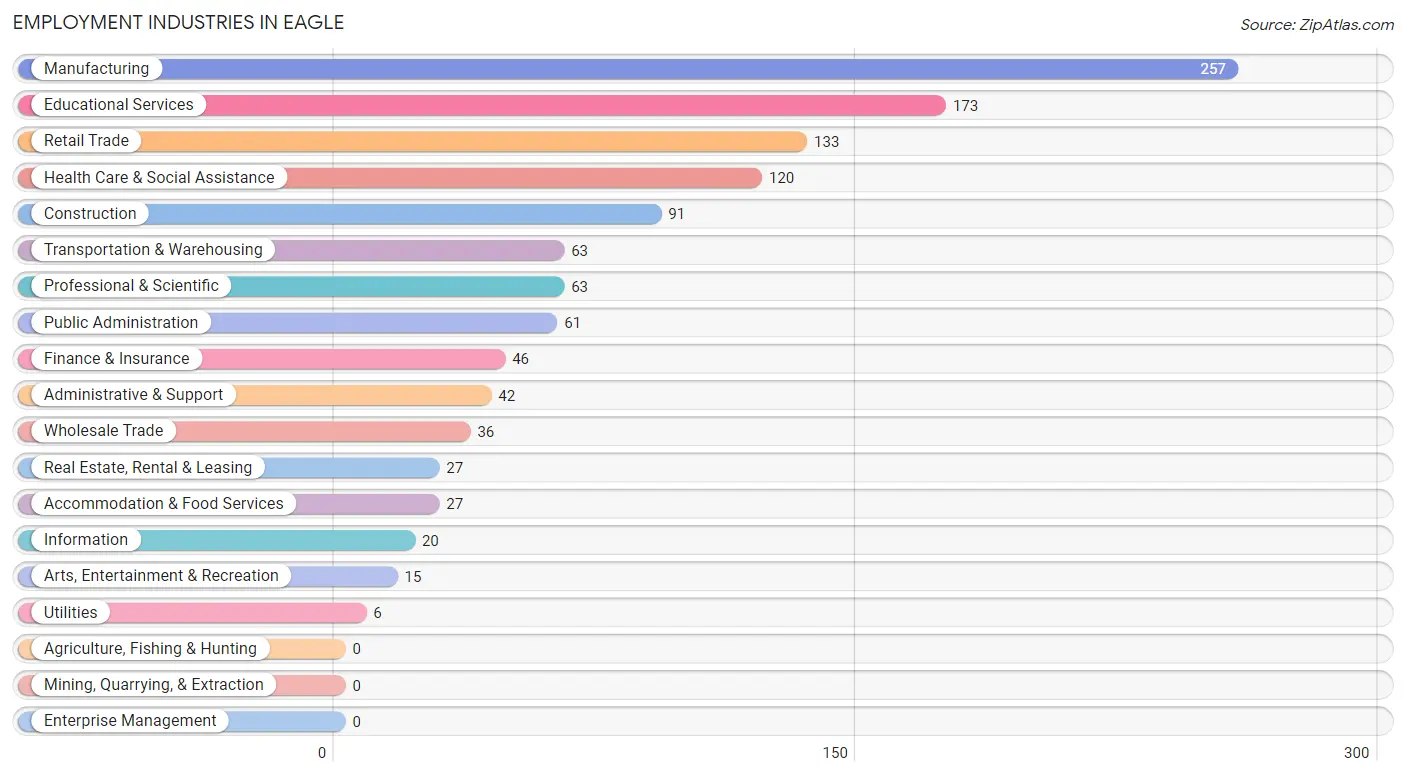
Employment Industries by Sex in Eagle
The Eagle industries that see more men than women are Construction (94.5%), Transportation & Warehousing (77.8%), and Manufacturing (61.9%), whereas the industries that tend to have a higher number of women are Utilities (100.0%), Administrative & Support (92.9%), and Health Care & Social Assistance (90.0%).
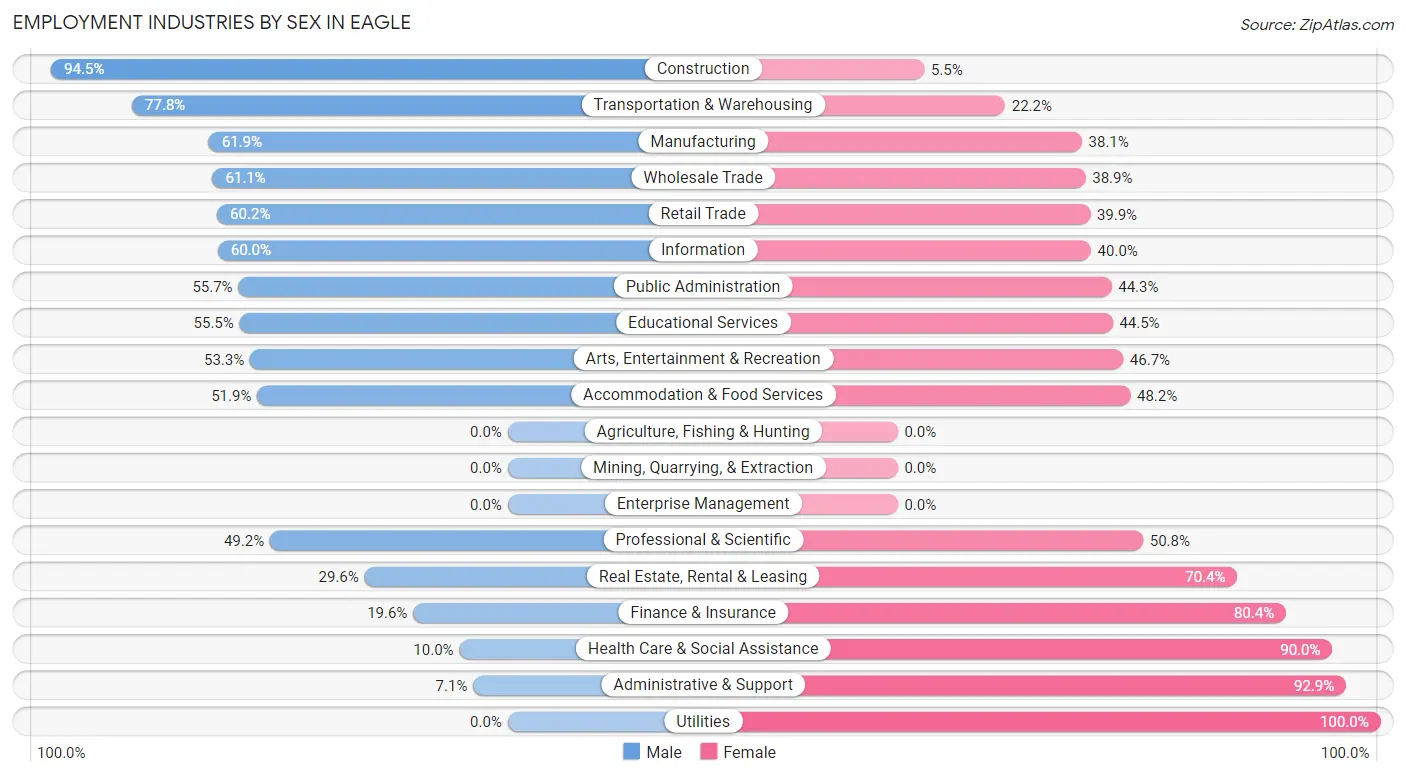
| Industry | Male | Female |
| Agriculture, Fishing & Hunting | 0 (0.0%) | 0 (0.0%) |
| Mining, Quarrying, & Extraction | 0 (0.0%) | 0 (0.0%) |
| Construction | 86 (94.5%) | 5 (5.5%) |
| Manufacturing | 159 (61.9%) | 98 (38.1%) |
| Wholesale Trade | 22 (61.1%) | 14 (38.9%) |
| Retail Trade | 80 (60.2%) | 53 (39.9%) |
| Transportation & Warehousing | 49 (77.8%) | 14 (22.2%) |
| Utilities | 0 (0.0%) | 6 (100.0%) |
| Information | 12 (60.0%) | 8 (40.0%) |
| Finance & Insurance | 9 (19.6%) | 37 (80.4%) |
| Real Estate, Rental & Leasing | 8 (29.6%) | 19 (70.4%) |
| Professional & Scientific | 31 (49.2%) | 32 (50.8%) |
| Enterprise Management | 0 (0.0%) | 0 (0.0%) |
| Administrative & Support | 3 (7.1%) | 39 (92.9%) |
| Educational Services | 96 (55.5%) | 77 (44.5%) |
| Health Care & Social Assistance | 12 (10.0%) | 108 (90.0%) |
| Arts, Entertainment & Recreation | 8 (53.3%) | 7 (46.7%) |
| Accommodation & Food Services | 14 (51.8%) | 13 (48.1%) |
| Public Administration | 34 (55.7%) | 27 (44.3%) |
| Total | 623 (50.8%) | 603 (49.2%) |
Education in Eagle
School Enrollment in Eagle
The most common levels of schooling among the 396 students in Eagle are college / undergraduate (113 | 28.5%), high school (86 | 21.7%), and middle school (77 | 19.4%).
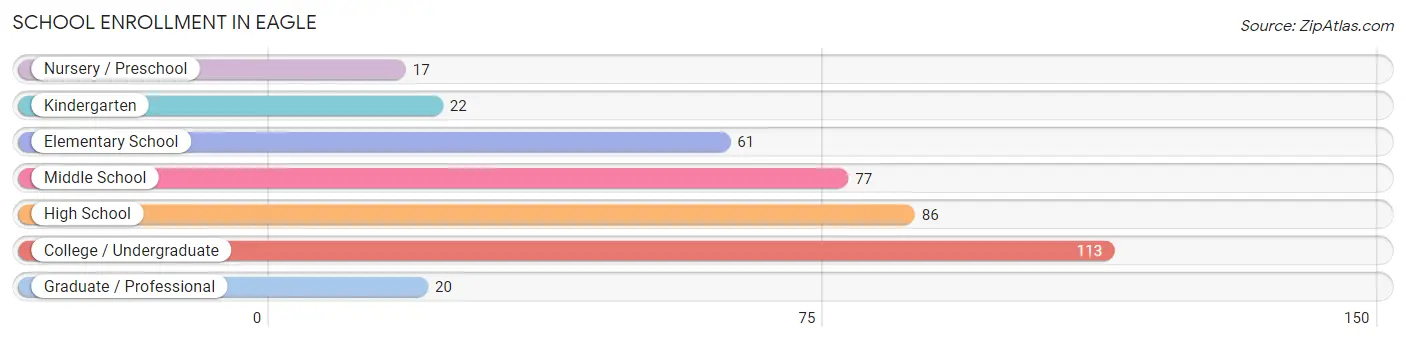
| School Level | # Students | % Students |
| Nursery / Preschool | 17 | 4.3% |
| Kindergarten | 22 | 5.6% |
| Elementary School | 61 | 15.4% |
| Middle School | 77 | 19.4% |
| High School | 86 | 21.7% |
| College / Undergraduate | 113 | 28.5% |
| Graduate / Professional | 20 | 5.1% |
| Total | 396 | 100.0% |
School Enrollment by Age by Funding Source in Eagle
Out of a total of 396 students who are enrolled in schools in Eagle, 42 (10.6%) attend a private institution, while the remaining 354 (89.4%) are enrolled in public schools. The age group of 35 years and over has the highest likelihood of being enrolled in private schools, with 9 (32.1% in the age bracket) enrolled. Conversely, the age group of 3 to 4 year olds has the lowest likelihood of being enrolled in a private school, with 11 (100.0% in the age bracket) attending a public institution.
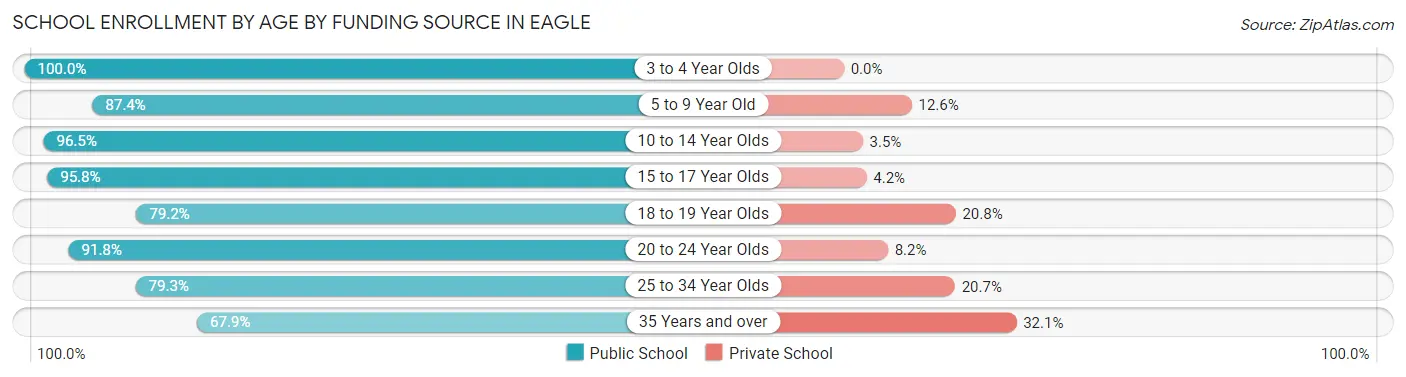
| Age Bracket | Public School | Private School |
| 3 to 4 Year Olds | 11 (100.0%) | 0 (0.0%) |
| 5 to 9 Year Old | 76 (87.4%) | 11 (12.6%) |
| 10 to 14 Year Olds | 82 (96.5%) | 3 (3.5%) |
| 15 to 17 Year Olds | 68 (95.8%) | 3 (4.2%) |
| 18 to 19 Year Olds | 19 (79.2%) | 5 (20.8%) |
| 20 to 24 Year Olds | 56 (91.8%) | 5 (8.2%) |
| 25 to 34 Year Olds | 23 (79.3%) | 6 (20.7%) |
| 35 Years and over | 19 (67.9%) | 9 (32.1%) |
| Total | 354 (89.4%) | 42 (10.6%) |
Educational Attainment by Field of Study in Eagle
Arts & humanities (92 | 20.3%), business (87 | 19.2%), education (75 | 16.5%), science & technology (59 | 13.0%), and social sciences (26 | 5.7%) are the most common fields of study among 454 individuals in Eagle who have obtained a bachelor's degree or higher.
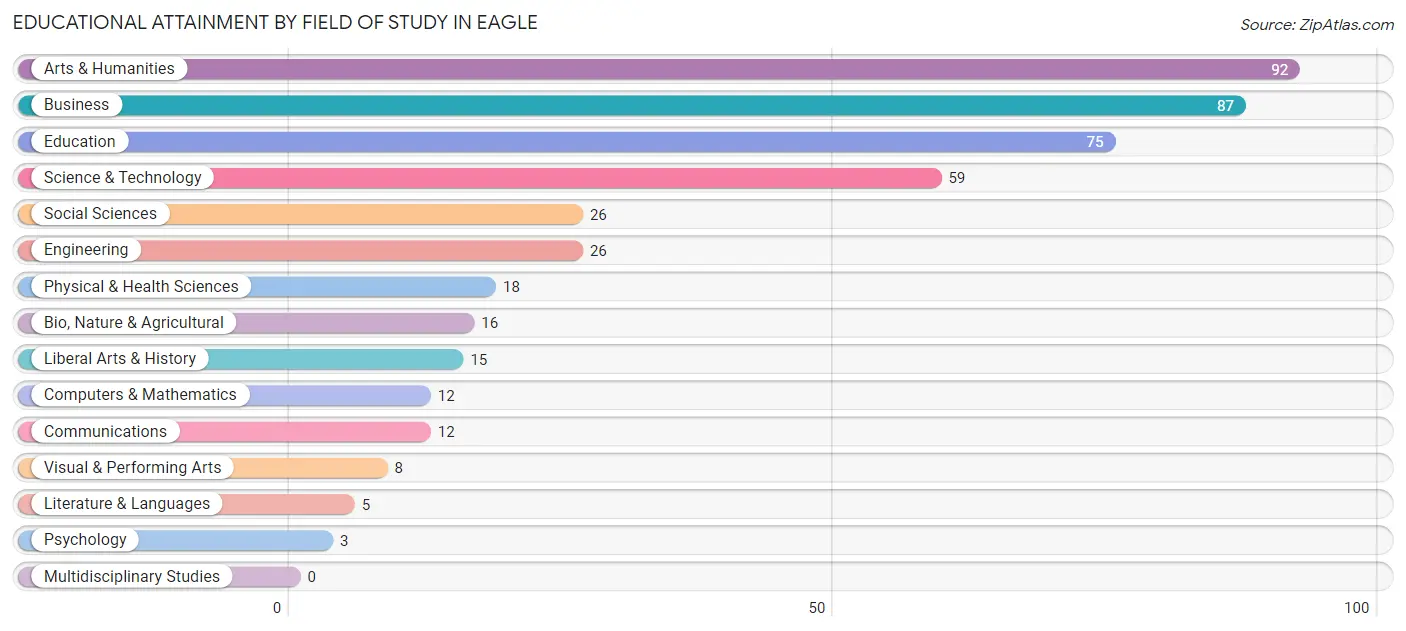
| Field of Study | # Graduates | % Graduates |
| Computers & Mathematics | 12 | 2.6% |
| Bio, Nature & Agricultural | 16 | 3.5% |
| Physical & Health Sciences | 18 | 4.0% |
| Psychology | 3 | 0.7% |
| Social Sciences | 26 | 5.7% |
| Engineering | 26 | 5.7% |
| Multidisciplinary Studies | 0 | 0.0% |
| Science & Technology | 59 | 13.0% |
| Business | 87 | 19.2% |
| Education | 75 | 16.5% |
| Literature & Languages | 5 | 1.1% |
| Liberal Arts & History | 15 | 3.3% |
| Visual & Performing Arts | 8 | 1.8% |
| Communications | 12 | 2.6% |
| Arts & Humanities | 92 | 20.3% |
| Total | 454 | 100.0% |
Transportation & Commute in Eagle
Vehicle Availability by Sex in Eagle
The most prevalent vehicle ownership categories in Eagle are males with 3 vehicles (245, accounting for 39.5%) and females with 3 vehicles (213, making up 41.5%).
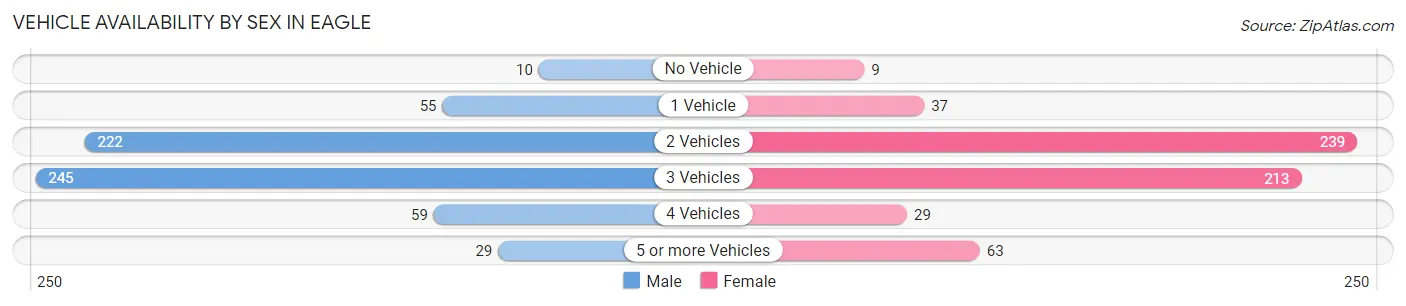
| Vehicles Available | Male | Female |
| No Vehicle | 10 (1.6%) | 9 (1.5%) |
| 1 Vehicle | 55 (8.9%) | 37 (6.3%) |
| 2 Vehicles | 222 (35.8%) | 239 (40.5%) |
| 3 Vehicles | 245 (39.5%) | 213 (36.1%) |
| 4 Vehicles | 59 (9.5%) | 29 (4.9%) |
| 5 or more Vehicles | 29 (4.7%) | 63 (10.7%) |
| Total | 620 (100.0%) | 590 (100.0%) |
Commute Time in Eagle
The most frequently occuring commute durations in Eagle are 45 to 59 minutes (243 commuters, 21.4%), 30 to 34 minutes (150 commuters, 13.2%), and 20 to 24 minutes (144 commuters, 12.7%).
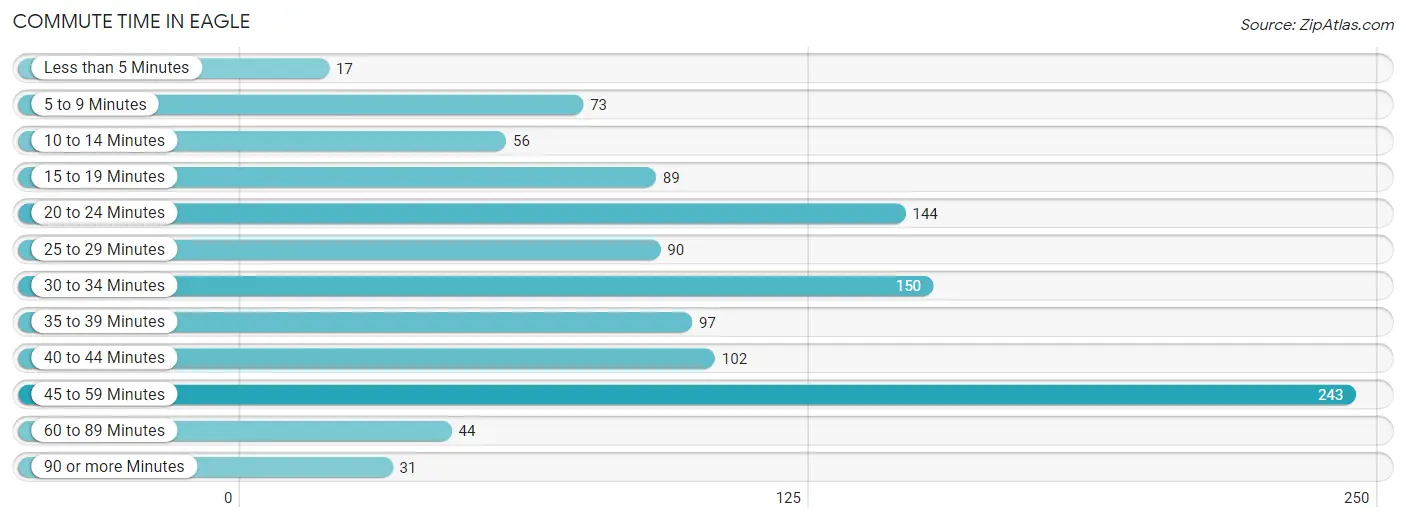
| Commute Time | # Commuters | % Commuters |
| Less than 5 Minutes | 17 | 1.5% |
| 5 to 9 Minutes | 73 | 6.4% |
| 10 to 14 Minutes | 56 | 4.9% |
| 15 to 19 Minutes | 89 | 7.8% |
| 20 to 24 Minutes | 144 | 12.7% |
| 25 to 29 Minutes | 90 | 7.9% |
| 30 to 34 Minutes | 150 | 13.2% |
| 35 to 39 Minutes | 97 | 8.5% |
| 40 to 44 Minutes | 102 | 9.0% |
| 45 to 59 Minutes | 243 | 21.4% |
| 60 to 89 Minutes | 44 | 3.9% |
| 90 or more Minutes | 31 | 2.7% |
Commute Time by Sex in Eagle
The most common commute times in Eagle are 45 to 59 minutes (139 commuters, 23.9%) for males and 45 to 59 minutes (104 commuters, 18.8%) for females.
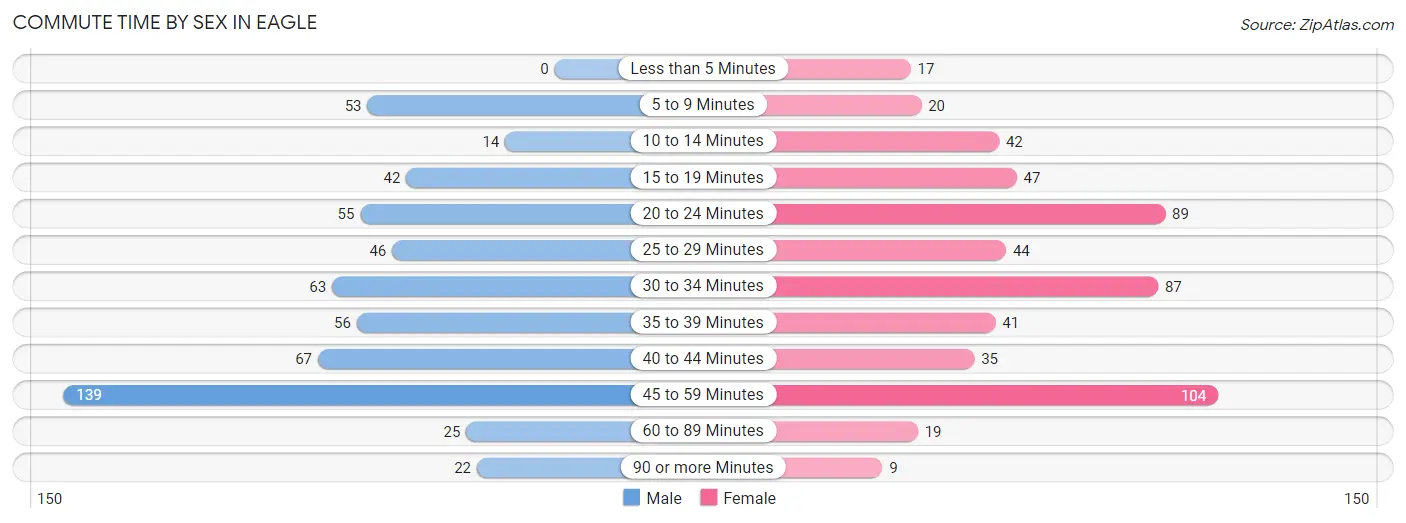
| Commute Time | Male | Female |
| Less than 5 Minutes | 0 (0.0%) | 17 (3.1%) |
| 5 to 9 Minutes | 53 (9.1%) | 20 (3.6%) |
| 10 to 14 Minutes | 14 (2.4%) | 42 (7.6%) |
| 15 to 19 Minutes | 42 (7.2%) | 47 (8.5%) |
| 20 to 24 Minutes | 55 (9.5%) | 89 (16.1%) |
| 25 to 29 Minutes | 46 (7.9%) | 44 (7.9%) |
| 30 to 34 Minutes | 63 (10.8%) | 87 (15.7%) |
| 35 to 39 Minutes | 56 (9.6%) | 41 (7.4%) |
| 40 to 44 Minutes | 67 (11.5%) | 35 (6.3%) |
| 45 to 59 Minutes | 139 (23.9%) | 104 (18.8%) |
| 60 to 89 Minutes | 25 (4.3%) | 19 (3.4%) |
| 90 or more Minutes | 22 (3.8%) | 9 (1.6%) |
Time of Departure to Work by Sex in Eagle
The most frequent times of departure to work in Eagle are 12:00 AM to 4:59 AM (121, 20.8%) for males and 6:30 AM to 6:59 AM (97, 17.5%) for females.
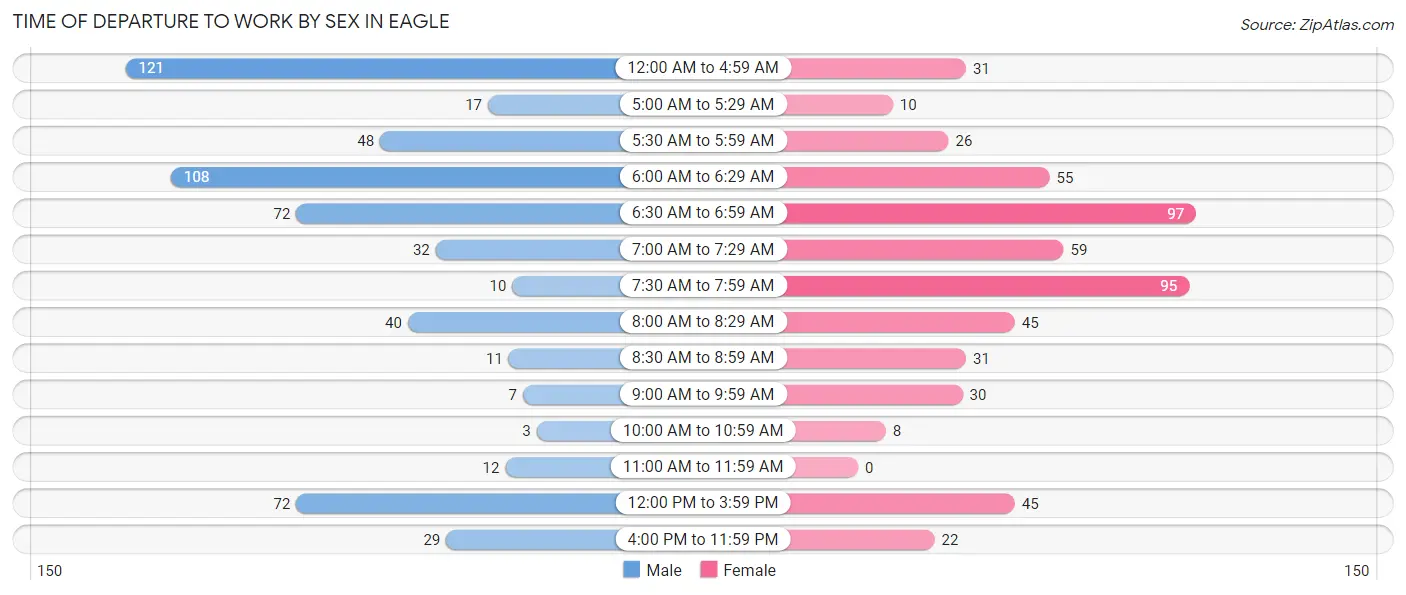
| Time of Departure | Male | Female |
| 12:00 AM to 4:59 AM | 121 (20.8%) | 31 (5.6%) |
| 5:00 AM to 5:29 AM | 17 (2.9%) | 10 (1.8%) |
| 5:30 AM to 5:59 AM | 48 (8.3%) | 26 (4.7%) |
| 6:00 AM to 6:29 AM | 108 (18.6%) | 55 (9.9%) |
| 6:30 AM to 6:59 AM | 72 (12.4%) | 97 (17.5%) |
| 7:00 AM to 7:29 AM | 32 (5.5%) | 59 (10.6%) |
| 7:30 AM to 7:59 AM | 10 (1.7%) | 95 (17.2%) |
| 8:00 AM to 8:29 AM | 40 (6.9%) | 45 (8.1%) |
| 8:30 AM to 8:59 AM | 11 (1.9%) | 31 (5.6%) |
| 9:00 AM to 9:59 AM | 7 (1.2%) | 30 (5.4%) |
| 10:00 AM to 10:59 AM | 3 (0.5%) | 8 (1.4%) |
| 11:00 AM to 11:59 AM | 12 (2.1%) | 0 (0.0%) |
| 12:00 PM to 3:59 PM | 72 (12.4%) | 45 (8.1%) |
| 4:00 PM to 11:59 PM | 29 (5.0%) | 22 (4.0%) |
| Total | 582 (100.0%) | 554 (100.0%) |
Housing Occupancy in Eagle
Occupancy by Ownership in Eagle
Of the total 788 dwellings in Eagle, owner-occupied units account for 699 (88.7%), while renter-occupied units make up 89 (11.3%).
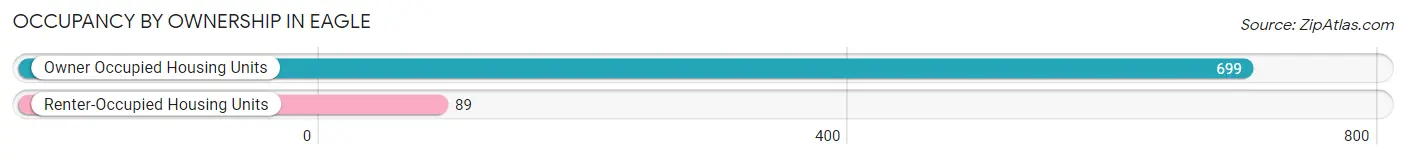
| Occupancy | # Housing Units | % Housing Units |
| Owner Occupied Housing Units | 699 | 88.7% |
| Renter-Occupied Housing Units | 89 | 11.3% |
| Total Occupied Housing Units | 788 | 100.0% |
Occupancy by Household Size in Eagle
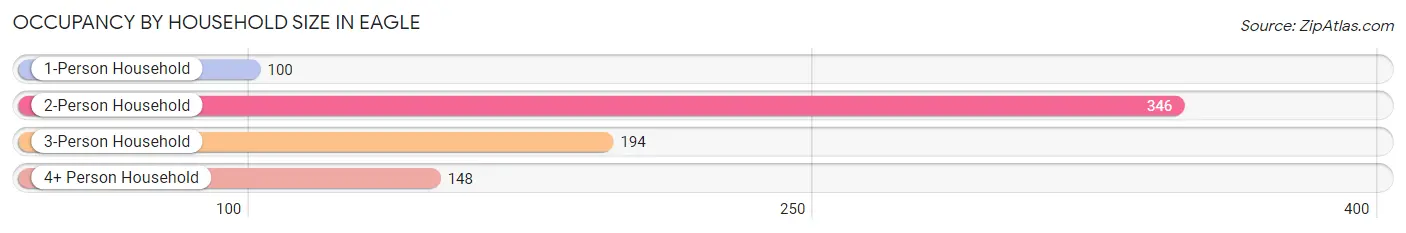
| Household Size | # Housing Units | % Housing Units |
| 1-Person Household | 100 | 12.7% |
| 2-Person Household | 346 | 43.9% |
| 3-Person Household | 194 | 24.6% |
| 4+ Person Household | 148 | 18.8% |
| Total Housing Units | 788 | 100.0% |
Occupancy by Ownership by Household Size in Eagle
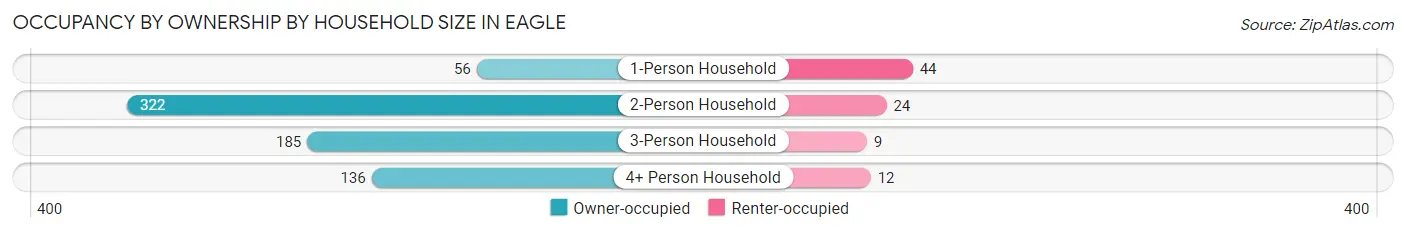
| Household Size | Owner-occupied | Renter-occupied |
| 1-Person Household | 56 (56.0%) | 44 (44.0%) |
| 2-Person Household | 322 (93.1%) | 24 (6.9%) |
| 3-Person Household | 185 (95.4%) | 9 (4.6%) |
| 4+ Person Household | 136 (91.9%) | 12 (8.1%) |
| Total Housing Units | 699 (88.7%) | 89 (11.3%) |
Occupancy by Educational Attainment in Eagle
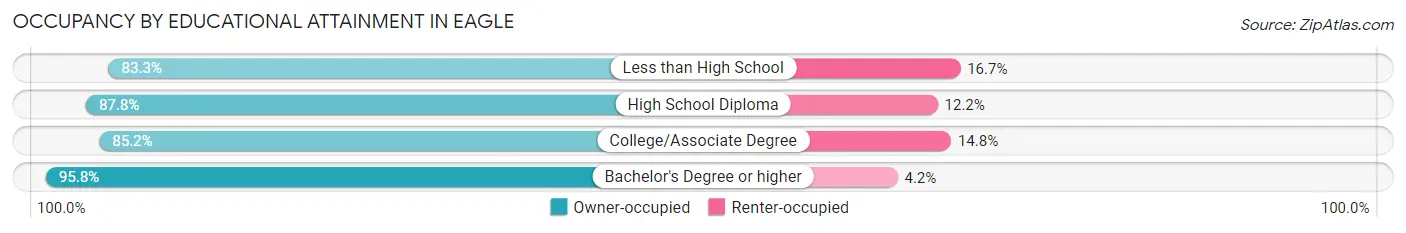
| Household Size | Owner-occupied | Renter-occupied |
| Less than High School | 20 (83.3%) | 4 (16.7%) |
| High School Diploma | 274 (87.8%) | 38 (12.2%) |
| College/Associate Degree | 224 (85.2%) | 39 (14.8%) |
| Bachelor's Degree or higher | 181 (95.8%) | 8 (4.2%) |
Occupancy by Age of Householder in Eagle
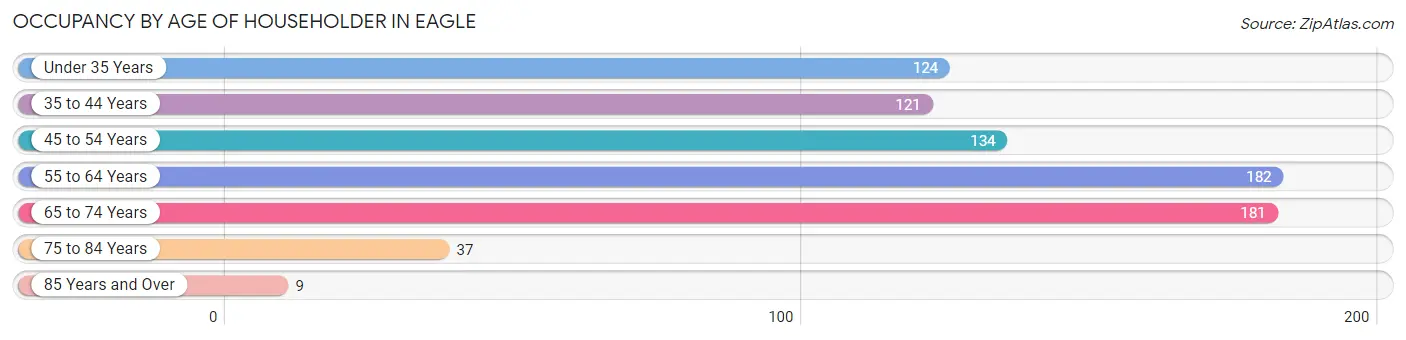
| Age Bracket | # Households | % Households |
| Under 35 Years | 124 | 15.7% |
| 35 to 44 Years | 121 | 15.4% |
| 45 to 54 Years | 134 | 17.0% |
| 55 to 64 Years | 182 | 23.1% |
| 65 to 74 Years | 181 | 23.0% |
| 75 to 84 Years | 37 | 4.7% |
| 85 Years and Over | 9 | 1.1% |
| Total | 788 | 100.0% |
Housing Finances in Eagle
Median Income by Occupancy in Eagle
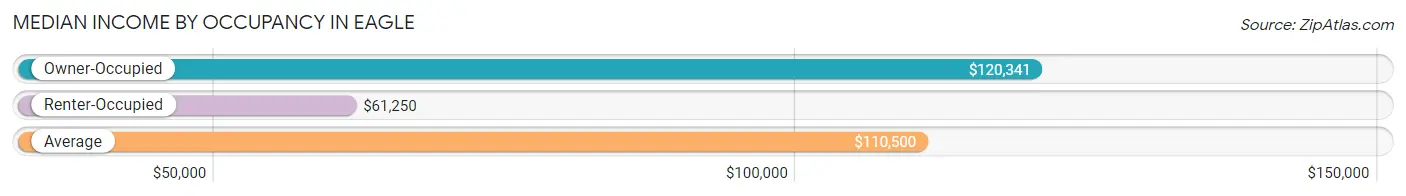
| Occupancy Type | # Households | Median Income |
| Owner-Occupied | 699 (88.7%) | $120,341 |
| Renter-Occupied | 89 (11.3%) | $61,250 |
| Average | 788 (100.0%) | $110,500 |
Occupancy by Householder Income Bracket in Eagle
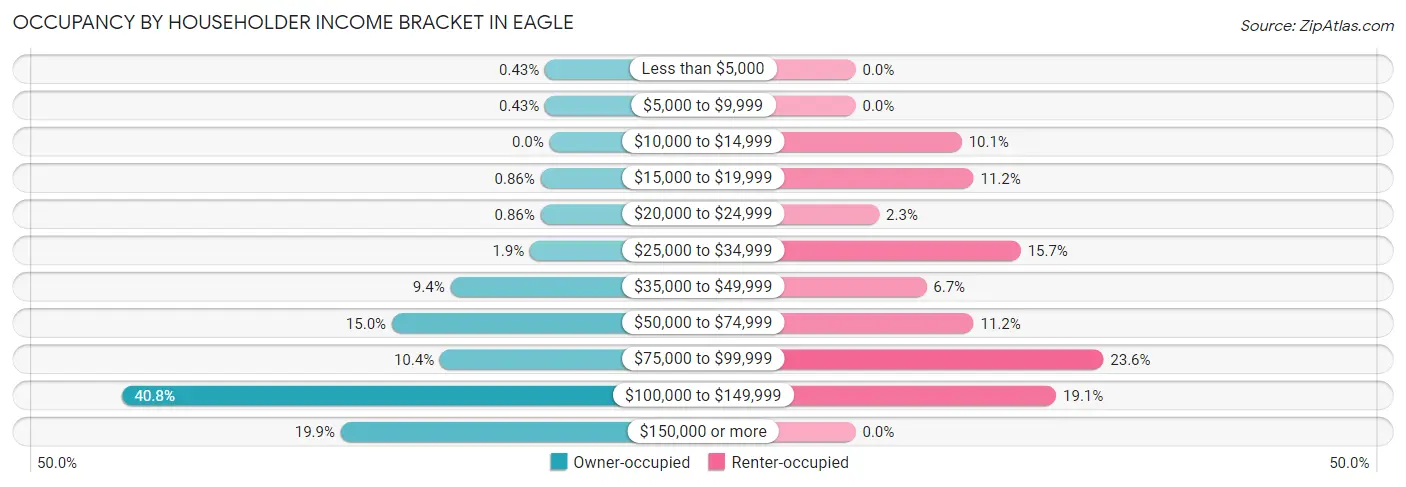
| Income Bracket | Owner-occupied | Renter-occupied |
| Less than $5,000 | 3 (0.4%) | 0 (0.0%) |
| $5,000 to $9,999 | 3 (0.4%) | 0 (0.0%) |
| $10,000 to $14,999 | 0 (0.0%) | 9 (10.1%) |
| $15,000 to $19,999 | 6 (0.9%) | 10 (11.2%) |
| $20,000 to $24,999 | 6 (0.9%) | 2 (2.2%) |
| $25,000 to $34,999 | 13 (1.9%) | 14 (15.7%) |
| $35,000 to $49,999 | 66 (9.4%) | 6 (6.7%) |
| $50,000 to $74,999 | 105 (15.0%) | 10 (11.2%) |
| $75,000 to $99,999 | 73 (10.4%) | 21 (23.6%) |
| $100,000 to $149,999 | 285 (40.8%) | 17 (19.1%) |
| $150,000 or more | 139 (19.9%) | 0 (0.0%) |
| Total | 699 (100.0%) | 89 (100.0%) |
Monthly Housing Cost Tiers in Eagle
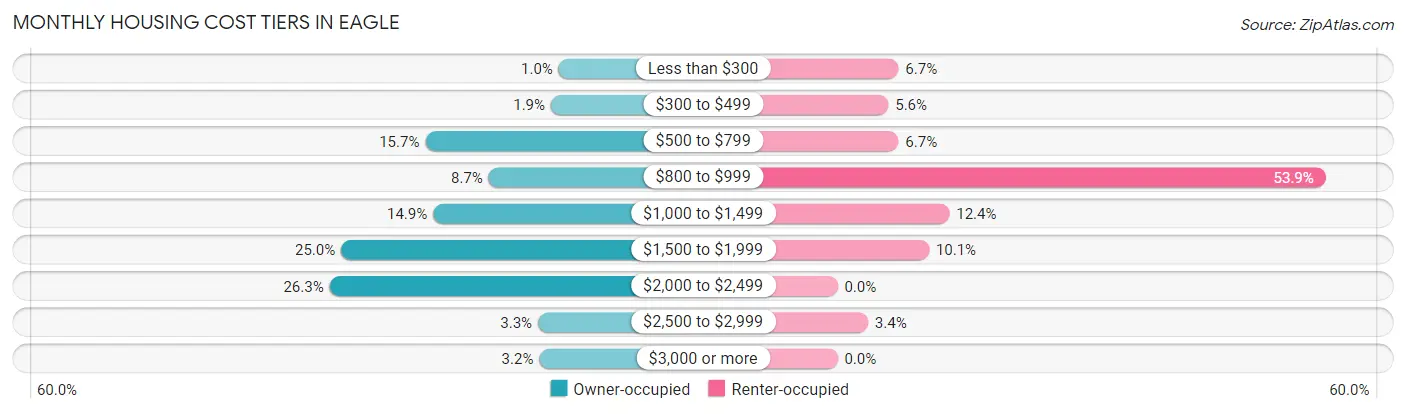
| Monthly Cost | Owner-occupied | Renter-occupied |
| Less than $300 | 7 (1.0%) | 6 (6.7%) |
| $300 to $499 | 13 (1.9%) | 5 (5.6%) |
| $500 to $799 | 110 (15.7%) | 6 (6.7%) |
| $800 to $999 | 61 (8.7%) | 48 (53.9%) |
| $1,000 to $1,499 | 104 (14.9%) | 11 (12.4%) |
| $1,500 to $1,999 | 175 (25.0%) | 9 (10.1%) |
| $2,000 to $2,499 | 184 (26.3%) | 0 (0.0%) |
| $2,500 to $2,999 | 23 (3.3%) | 3 (3.4%) |
| $3,000 or more | 22 (3.2%) | 0 (0.0%) |
| Total | 699 (100.0%) | 89 (100.0%) |
Physical Housing Characteristics in Eagle
Housing Structures in Eagle
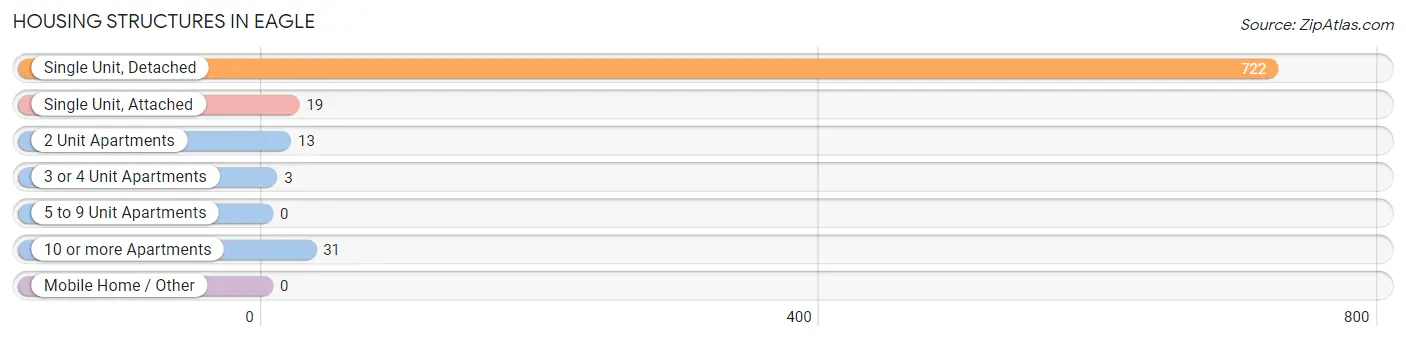
| Structure Type | # Housing Units | % Housing Units |
| Single Unit, Detached | 722 | 91.6% |
| Single Unit, Attached | 19 | 2.4% |
| 2 Unit Apartments | 13 | 1.7% |
| 3 or 4 Unit Apartments | 3 | 0.4% |
| 5 to 9 Unit Apartments | 0 | 0.0% |
| 10 or more Apartments | 31 | 3.9% |
| Mobile Home / Other | 0 | 0.0% |
| Total | 788 | 100.0% |
Housing Structures by Occupancy in Eagle
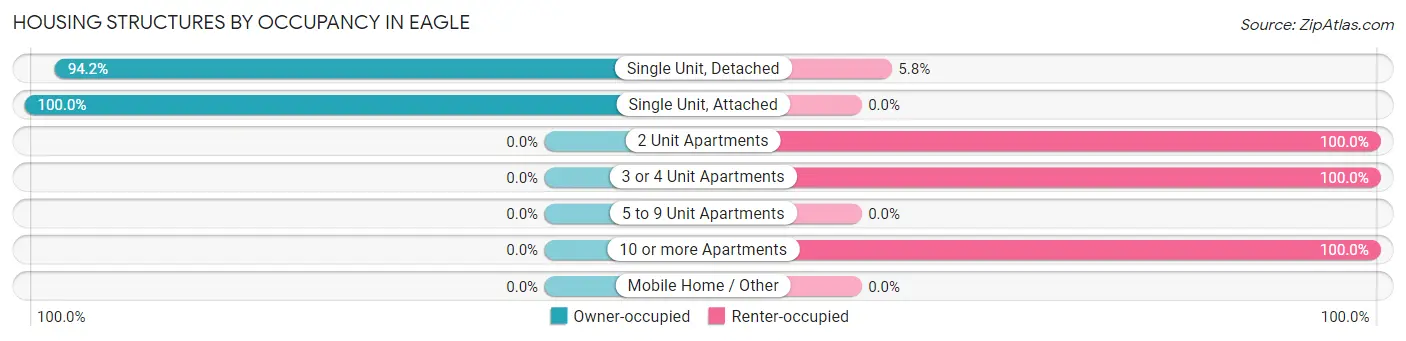
| Structure Type | Owner-occupied | Renter-occupied |
| Single Unit, Detached | 680 (94.2%) | 42 (5.8%) |
| Single Unit, Attached | 19 (100.0%) | 0 (0.0%) |
| 2 Unit Apartments | 0 (0.0%) | 13 (100.0%) |
| 3 or 4 Unit Apartments | 0 (0.0%) | 3 (100.0%) |
| 5 to 9 Unit Apartments | 0 (0.0%) | 0 (0.0%) |
| 10 or more Apartments | 0 (0.0%) | 31 (100.0%) |
| Mobile Home / Other | 0 (0.0%) | 0 (0.0%) |
| Total | 699 (88.7%) | 89 (11.3%) |
Housing Structures by Number of Rooms in Eagle
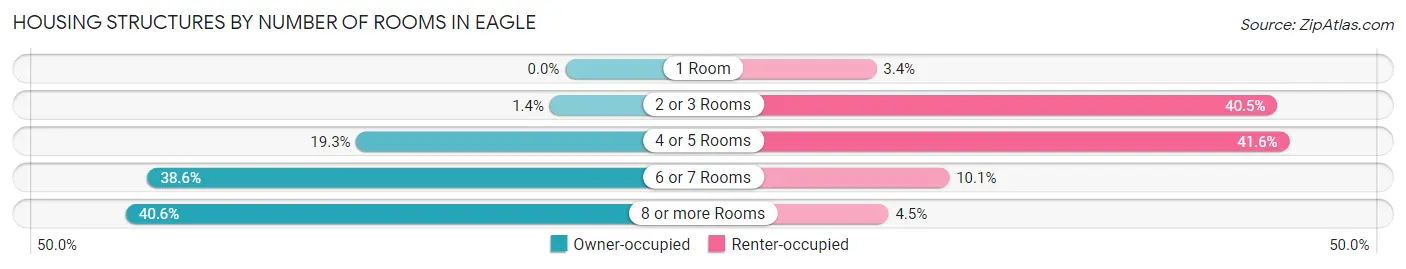
| Number of Rooms | Owner-occupied | Renter-occupied |
| 1 Room | 0 (0.0%) | 3 (3.4%) |
| 2 or 3 Rooms | 10 (1.4%) | 36 (40.5%) |
| 4 or 5 Rooms | 135 (19.3%) | 37 (41.6%) |
| 6 or 7 Rooms | 270 (38.6%) | 9 (10.1%) |
| 8 or more Rooms | 284 (40.6%) | 4 (4.5%) |
| Total | 699 (100.0%) | 89 (100.0%) |
Housing Structure by Heating Type in Eagle
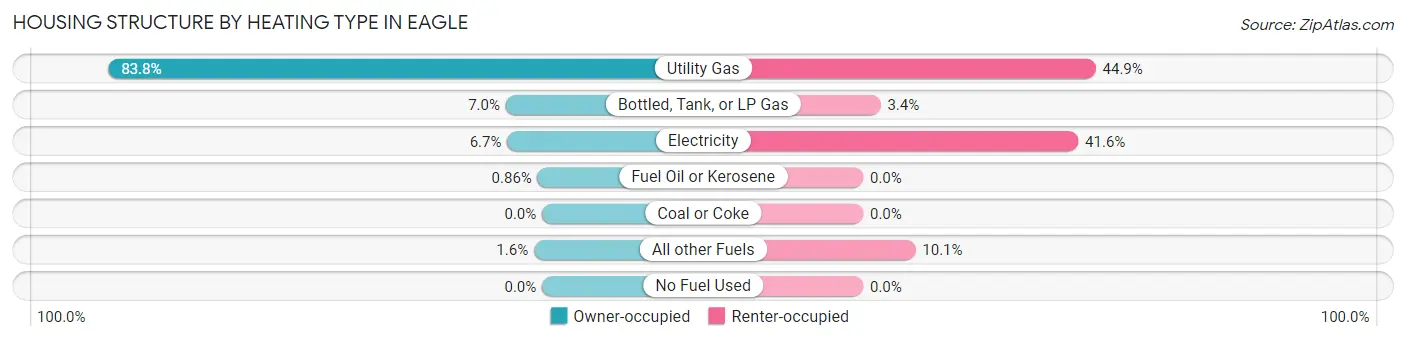
| Heating Type | Owner-occupied | Renter-occupied |
| Utility Gas | 586 (83.8%) | 40 (44.9%) |
| Bottled, Tank, or LP Gas | 49 (7.0%) | 3 (3.4%) |
| Electricity | 47 (6.7%) | 37 (41.6%) |
| Fuel Oil or Kerosene | 6 (0.9%) | 0 (0.0%) |
| Coal or Coke | 0 (0.0%) | 0 (0.0%) |
| All other Fuels | 11 (1.6%) | 9 (10.1%) |
| No Fuel Used | 0 (0.0%) | 0 (0.0%) |
| Total | 699 (100.0%) | 89 (100.0%) |
Household Vehicle Usage in Eagle
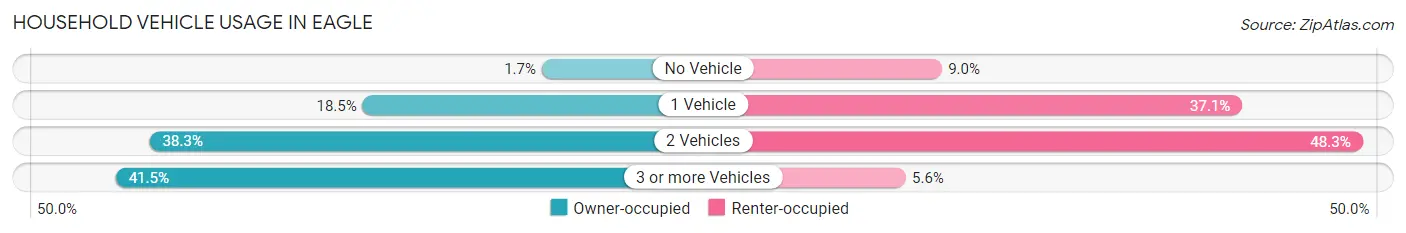
| Vehicles per Household | Owner-occupied | Renter-occupied |
| No Vehicle | 12 (1.7%) | 8 (9.0%) |
| 1 Vehicle | 129 (18.4%) | 33 (37.1%) |
| 2 Vehicles | 268 (38.3%) | 43 (48.3%) |
| 3 or more Vehicles | 290 (41.5%) | 5 (5.6%) |
| Total | 699 (100.0%) | 89 (100.0%) |
Real Estate & Mortgages in Eagle
Real Estate and Mortgage Overview in Eagle
| Characteristic | Without Mortgage | With Mortgage |
| Housing Units | 133 | 566 |
| Median Property Value | $244,100 | $301,300 |
| Median Household Income | $88,542 | $128 |
| Monthly Housing Costs | $597 | $22 |
| Real Estate Taxes | $3,536 | $0 |
Property Value by Mortgage Status in Eagle
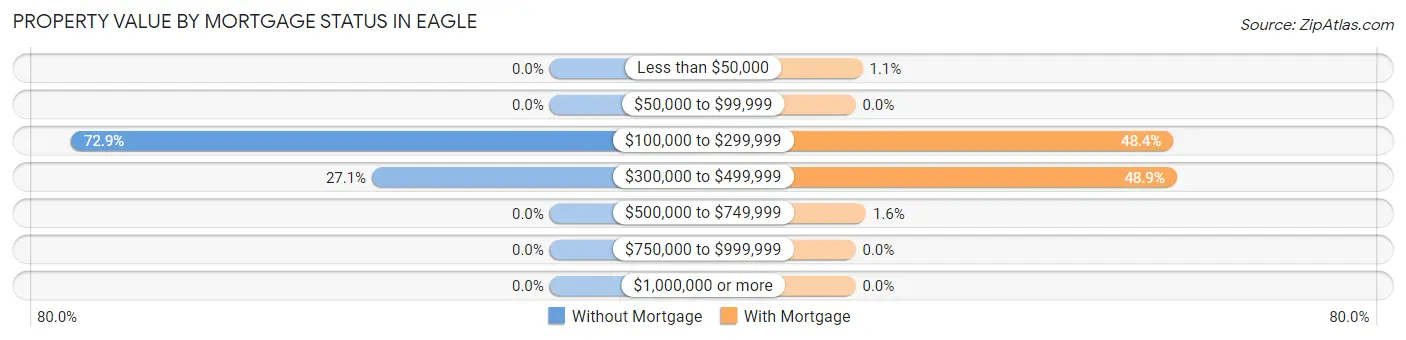
| Property Value | Without Mortgage | With Mortgage |
| Less than $50,000 | 0 (0.0%) | 6 (1.1%) |
| $50,000 to $99,999 | 0 (0.0%) | 0 (0.0%) |
| $100,000 to $299,999 | 97 (72.9%) | 274 (48.4%) |
| $300,000 to $499,999 | 36 (27.1%) | 277 (48.9%) |
| $500,000 to $749,999 | 0 (0.0%) | 9 (1.6%) |
| $750,000 to $999,999 | 0 (0.0%) | 0 (0.0%) |
| $1,000,000 or more | 0 (0.0%) | 0 (0.0%) |
| Total | 133 (100.0%) | 566 (100.0%) |
Household Income by Mortgage Status in Eagle
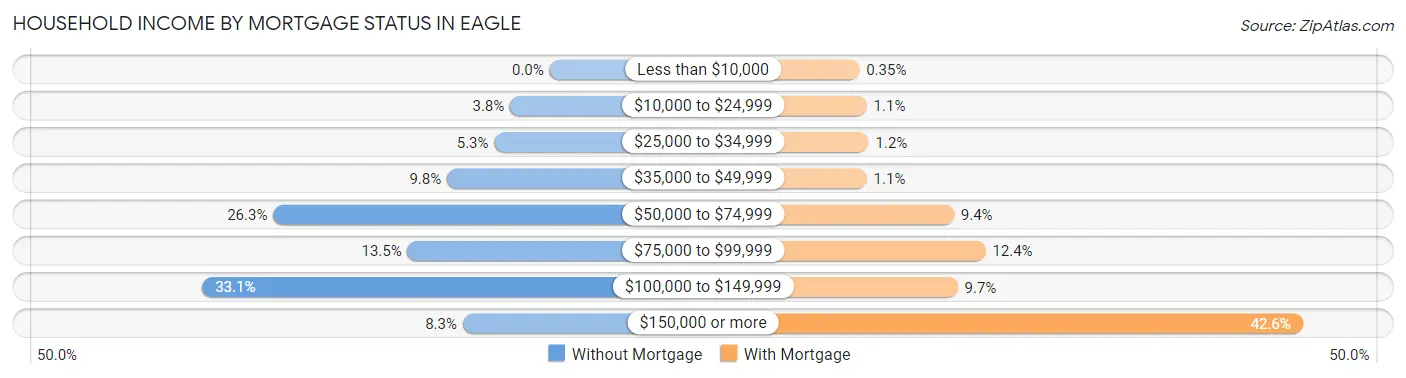
| Household Income | Without Mortgage | With Mortgage |
| Less than $10,000 | 0 (0.0%) | 2 (0.4%) |
| $10,000 to $24,999 | 5 (3.8%) | 6 (1.1%) |
| $25,000 to $34,999 | 7 (5.3%) | 7 (1.2%) |
| $35,000 to $49,999 | 13 (9.8%) | 6 (1.1%) |
| $50,000 to $74,999 | 35 (26.3%) | 53 (9.4%) |
| $75,000 to $99,999 | 18 (13.5%) | 70 (12.4%) |
| $100,000 to $149,999 | 44 (33.1%) | 55 (9.7%) |
| $150,000 or more | 11 (8.3%) | 241 (42.6%) |
| Total | 133 (100.0%) | 566 (100.0%) |
Property Value to Household Income Ratio in Eagle
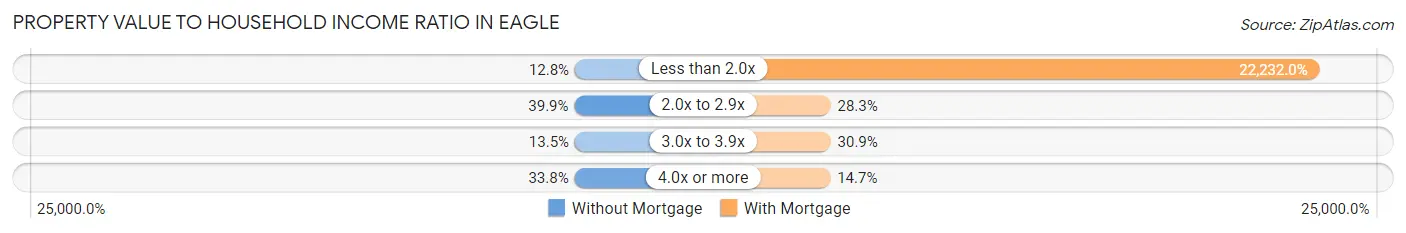
| Value-to-Income Ratio | Without Mortgage | With Mortgage |
| Less than 2.0x | 17 (12.8%) | 125,833 (22,232.0%) |
| 2.0x to 2.9x | 53 (39.9%) | 160 (28.3%) |
| 3.0x to 3.9x | 18 (13.5%) | 175 (30.9%) |
| 4.0x or more | 45 (33.8%) | 83 (14.7%) |
| Total | 133 (100.0%) | 566 (100.0%) |
Real Estate Taxes by Mortgage Status in Eagle
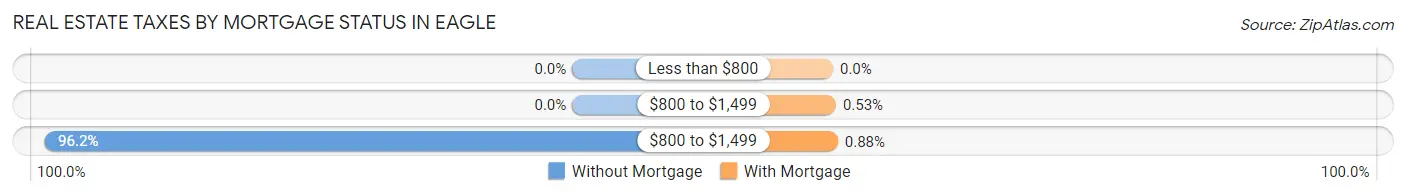
| Property Taxes | Without Mortgage | With Mortgage |
| Less than $800 | 0 (0.0%) | 0 (0.0%) |
| $800 to $1,499 | 0 (0.0%) | 3 (0.5%) |
| $800 to $1,499 | 128 (96.2%) | 5 (0.9%) |
| Total | 133 (100.0%) | 566 (100.0%) |
Health & Disability in Eagle
Health Insurance Coverage by Age in Eagle
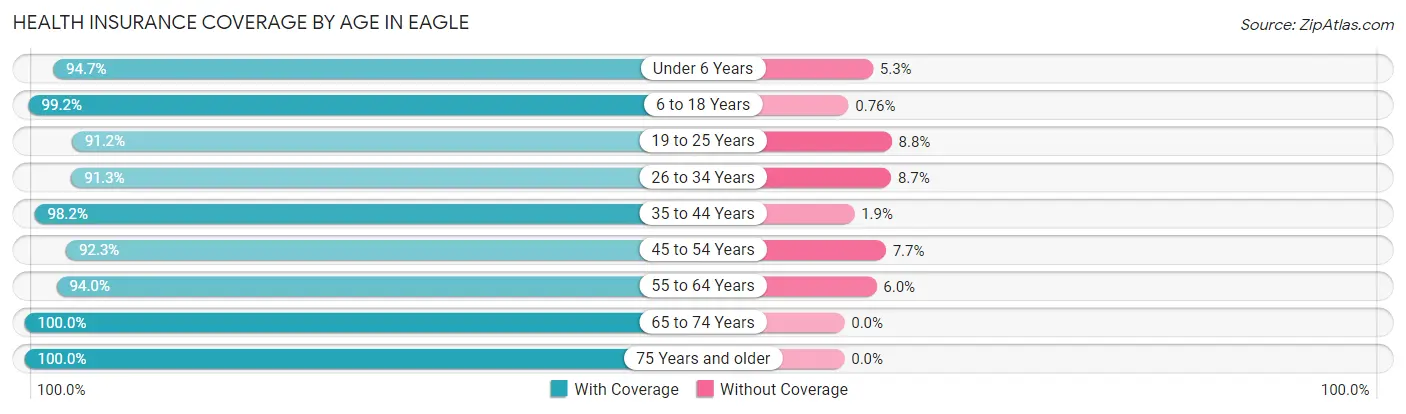
| Age Bracket | With Coverage | Without Coverage |
| Under 6 Years | 142 (94.7%) | 8 (5.3%) |
| 6 to 18 Years | 262 (99.2%) | 2 (0.8%) |
| 19 to 25 Years | 186 (91.2%) | 18 (8.8%) |
| 26 to 34 Years | 220 (91.3%) | 21 (8.7%) |
| 35 to 44 Years | 265 (98.2%) | 5 (1.8%) |
| 45 to 54 Years | 263 (92.3%) | 22 (7.7%) |
| 55 to 64 Years | 299 (94.0%) | 19 (6.0%) |
| 65 to 74 Years | 239 (100.0%) | 0 (0.0%) |
| 75 Years and older | 79 (100.0%) | 0 (0.0%) |
| Total | 1,955 (95.4%) | 95 (4.6%) |
Health Insurance Coverage by Citizenship Status in Eagle
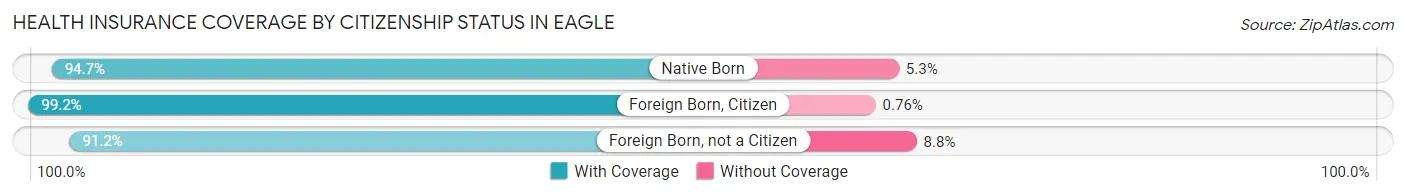
| Citizenship Status | With Coverage | Without Coverage |
| Native Born | 142 (94.7%) | 8 (5.3%) |
| Foreign Born, Citizen | 262 (99.2%) | 2 (0.8%) |
| Foreign Born, not a Citizen | 186 (91.2%) | 18 (8.8%) |
Health Insurance Coverage by Household Income in Eagle
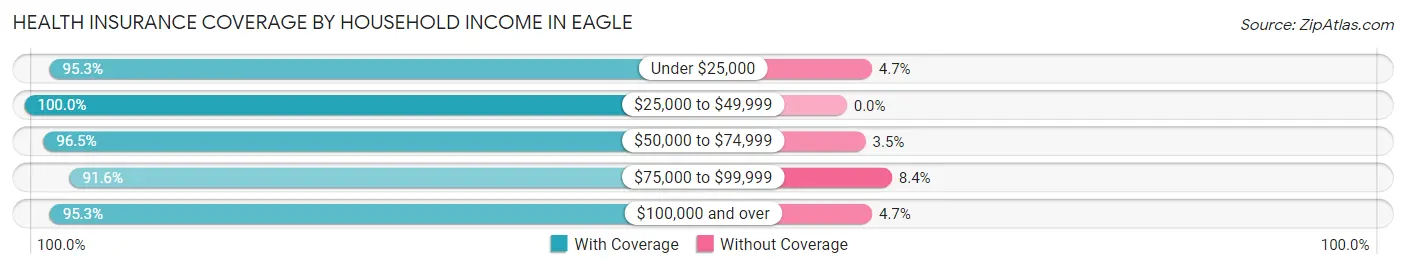
| Household Income | With Coverage | Without Coverage |
| Under $25,000 | 61 (95.3%) | 3 (4.7%) |
| $25,000 to $49,999 | 153 (100.0%) | 0 (0.0%) |
| $50,000 to $74,999 | 274 (96.5%) | 10 (3.5%) |
| $75,000 to $99,999 | 217 (91.6%) | 20 (8.4%) |
| $100,000 and over | 1,250 (95.3%) | 62 (4.7%) |
Public vs Private Health Insurance Coverage by Age in Eagle
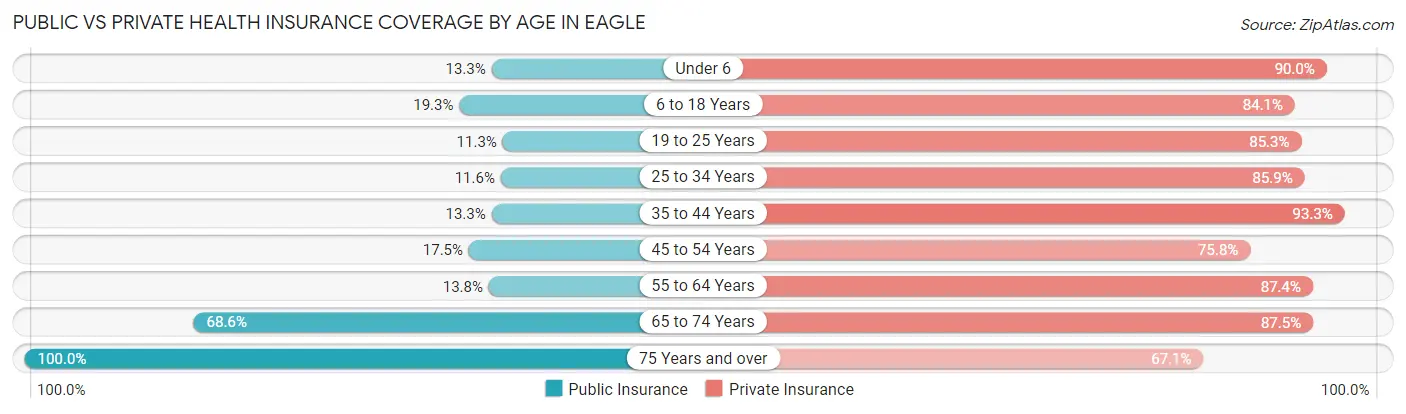
| Age Bracket | Public Insurance | Private Insurance |
| Under 6 | 20 (13.3%) | 135 (90.0%) |
| 6 to 18 Years | 51 (19.3%) | 222 (84.1%) |
| 19 to 25 Years | 23 (11.3%) | 174 (85.3%) |
| 25 to 34 Years | 28 (11.6%) | 207 (85.9%) |
| 35 to 44 Years | 36 (13.3%) | 252 (93.3%) |
| 45 to 54 Years | 50 (17.5%) | 216 (75.8%) |
| 55 to 64 Years | 44 (13.8%) | 278 (87.4%) |
| 65 to 74 Years | 164 (68.6%) | 209 (87.5%) |
| 75 Years and over | 79 (100.0%) | 53 (67.1%) |
| Total | 495 (24.1%) | 1,746 (85.2%) |
Disability Status by Sex by Age in Eagle
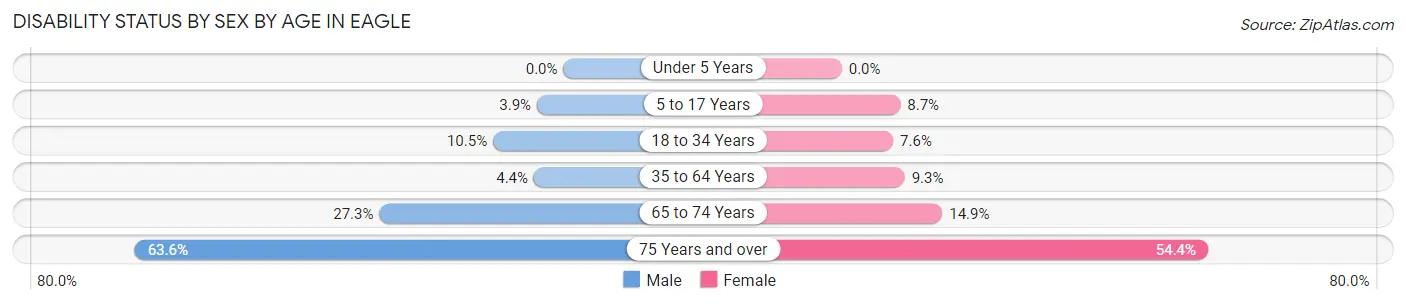
| Age Bracket | Male | Female |
| Under 5 Years | 0 (0.0%) | 0 (0.0%) |
| 5 to 17 Years | 6 (3.9%) | 12 (8.7%) |
| 18 to 34 Years | 23 (10.4%) | 18 (7.6%) |
| 35 to 64 Years | 19 (4.4%) | 41 (9.3%) |
| 65 to 74 Years | 47 (27.3%) | 10 (14.9%) |
| 75 Years and over | 21 (63.6%) | 25 (54.3%) |
Disability Class by Sex by Age in Eagle
Disability Class: Hearing Difficulty
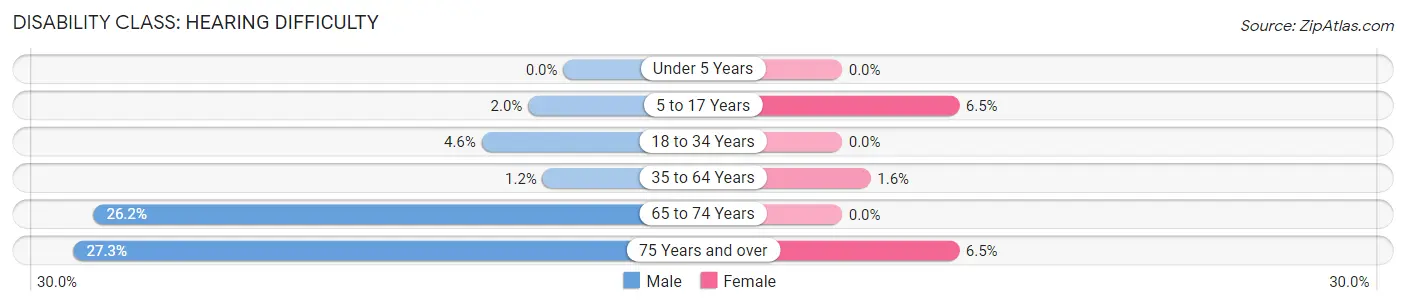
| Age Bracket | Male | Female |
| Under 5 Years | 0 (0.0%) | 0 (0.0%) |
| 5 to 17 Years | 3 (2.0%) | 9 (6.5%) |
| 18 to 34 Years | 10 (4.5%) | 0 (0.0%) |
| 35 to 64 Years | 5 (1.1%) | 7 (1.6%) |
| 65 to 74 Years | 45 (26.2%) | 0 (0.0%) |
| 75 Years and over | 9 (27.3%) | 3 (6.5%) |
Disability Class: Vision Difficulty
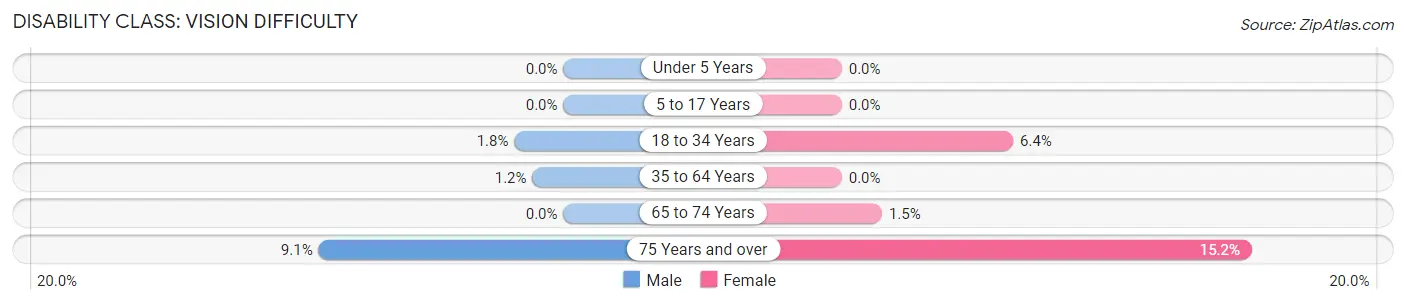
| Age Bracket | Male | Female |
| Under 5 Years | 0 (0.0%) | 0 (0.0%) |
| 5 to 17 Years | 0 (0.0%) | 0 (0.0%) |
| 18 to 34 Years | 4 (1.8%) | 15 (6.4%) |
| 35 to 64 Years | 5 (1.1%) | 0 (0.0%) |
| 65 to 74 Years | 0 (0.0%) | 1 (1.5%) |
| 75 Years and over | 3 (9.1%) | 7 (15.2%) |
Disability Class: Cognitive Difficulty
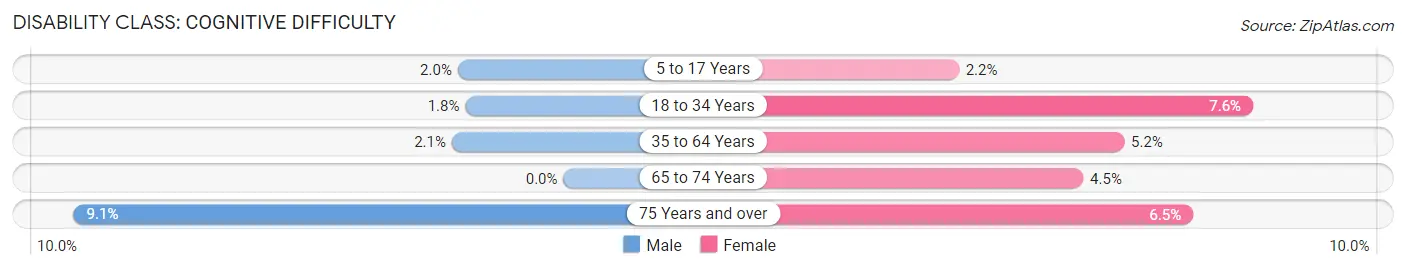
| Age Bracket | Male | Female |
| 5 to 17 Years | 3 (2.0%) | 3 (2.2%) |
| 18 to 34 Years | 4 (1.8%) | 18 (7.6%) |
| 35 to 64 Years | 9 (2.1%) | 23 (5.2%) |
| 65 to 74 Years | 0 (0.0%) | 3 (4.5%) |
| 75 Years and over | 3 (9.1%) | 3 (6.5%) |
Disability Class: Ambulatory Difficulty
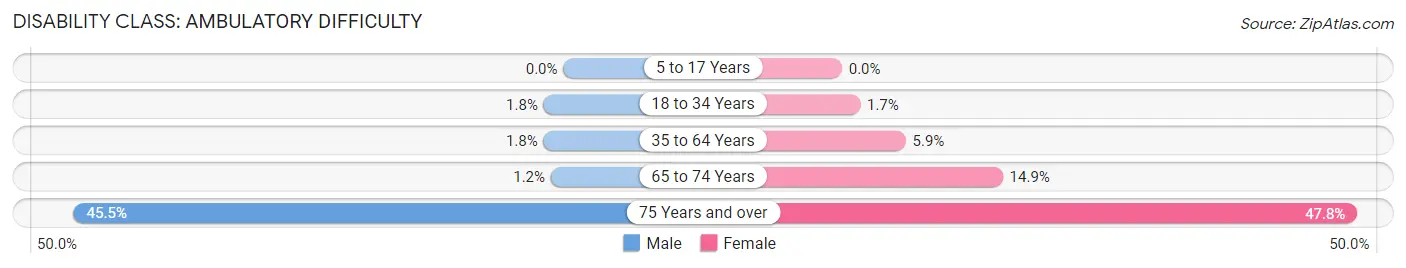
| Age Bracket | Male | Female |
| 5 to 17 Years | 0 (0.0%) | 0 (0.0%) |
| 18 to 34 Years | 4 (1.8%) | 4 (1.7%) |
| 35 to 64 Years | 8 (1.8%) | 26 (5.9%) |
| 65 to 74 Years | 2 (1.2%) | 10 (14.9%) |
| 75 Years and over | 15 (45.5%) | 22 (47.8%) |
Disability Class: Self-Care Difficulty
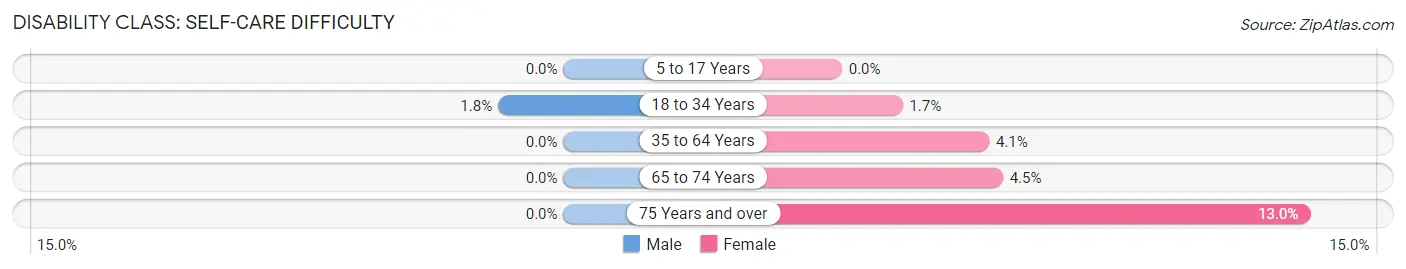
| Age Bracket | Male | Female |
| 5 to 17 Years | 0 (0.0%) | 0 (0.0%) |
| 18 to 34 Years | 4 (1.8%) | 4 (1.7%) |
| 35 to 64 Years | 0 (0.0%) | 18 (4.1%) |
| 65 to 74 Years | 0 (0.0%) | 3 (4.5%) |
| 75 Years and over | 0 (0.0%) | 6 (13.0%) |
Technology Access in Eagle
Computing Device Access in Eagle
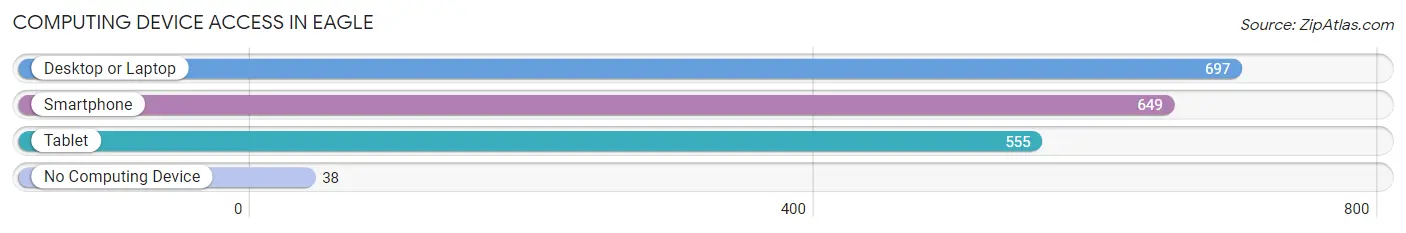
| Device Type | # Households | % Households |
| Desktop or Laptop | 697 | 88.4% |
| Smartphone | 649 | 82.4% |
| Tablet | 555 | 70.4% |
| No Computing Device | 38 | 4.8% |
| Total | 788 | 100.0% |
Internet Access in Eagle
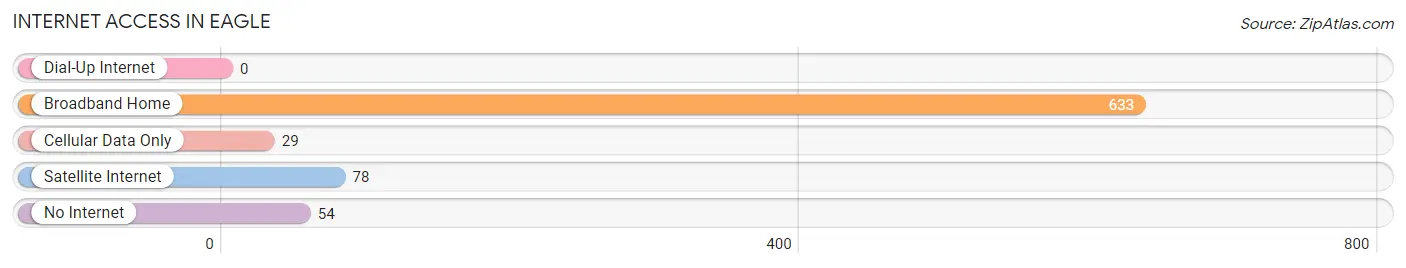
| Internet Type | # Households | % Households |
| Dial-Up Internet | 0 | 0.0% |
| Broadband Home | 633 | 80.3% |
| Cellular Data Only | 29 | 3.7% |
| Satellite Internet | 78 | 9.9% |
| No Internet | 54 | 6.9% |
| Total | 788 | 100.0% |
Eagle Summary
Eagle, Wisconsin is a small village located in Waukesha County, Wisconsin. It is situated on the banks of the Fox River, about 25 miles northwest of Milwaukee. The village has a population of approximately 2,500 people and covers an area of 1.3 square miles.
History
The area that is now Eagle was first settled in the early 1800s by settlers from New England. The village was originally known as “Eagle Mills” and was named after the eagle that was seen flying over the area. The village was officially incorporated in 1846.
In the late 1800s, Eagle was a thriving community with a variety of businesses, including a sawmill, a grist mill, a blacksmith shop, a general store, and a hotel. The village also had a post office, a school, and a church.
In the early 1900s, the village began to decline as the population shifted to larger cities. However, the village was able to remain a viable community due to its proximity to Milwaukee.
Geography
Eagle is located in southeastern Wisconsin, about 25 miles northwest of Milwaukee. The village is situated on the banks of the Fox River and is surrounded by rolling hills and farmland. The village is located in the Kettle Moraine State Forest, which is a popular destination for outdoor recreation.
The climate in Eagle is typical of the Midwest, with cold winters and hot, humid summers. The average annual temperature is around 50 degrees Fahrenheit.
Economy
The economy of Eagle is largely based on agriculture and tourism. The village is home to several small businesses, including a grocery store, a hardware store, and a few restaurants. The village also has a few small manufacturing companies.
Tourism is an important part of the local economy. The village is home to several popular attractions, including the Eagle Nature Center, the Eagle Historical Society Museum, and the Eagle River Nature Center.
Demographics
As of the 2010 census, the population of Eagle was 2,500. The racial makeup of the village was 97.2% White, 0.8% African American, 0.4% Native American, 0.4% Asian, and 1.2% from other races. The median household income was $50,000.
Conclusion
Eagle, Wisconsin is a small village located in Waukesha County, Wisconsin. It is situated on the banks of the Fox River, about 25 miles northwest of Milwaukee. The village has a population of approximately 2,500 people and covers an area of 1.3 square miles. The economy of Eagle is largely based on agriculture and tourism, and the village is home to several popular attractions. The racial makeup of the village is 97.2% White, 0.8% African American, 0.4% Native American, 0.4% Asian, and 1.2% from other races. The median household income was $50,000.
Common Questions
What is Per Capita Income in Eagle?
Per Capita income in Eagle is $42,808.
What is the Median Family Income in Eagle?
Median Family Income in Eagle is $118,897.
What is the Median Household income in Eagle?
Median Household Income in Eagle is $110,500.
What is Income or Wage Gap in Eagle?
Income or Wage Gap in Eagle is 39.5%.
Women in Eagle earn 60.5 cents for every dollar earned by a man.
What is Inequality or Gini Index in Eagle?
Inequality or Gini Index in Eagle is 0.30.
What is the Total Population of Eagle?
Total Population of Eagle is 2,050.
What is the Total Male Population of Eagle?
Total Male Population of Eagle is 1,061.
What is the Total Female Population of Eagle?
Total Female Population of Eagle is 989.
What is the Ratio of Males per 100 Females in Eagle?
There are 107.28 Males per 100 Females in Eagle.
What is the Ratio of Females per 100 Males in Eagle?
There are 93.21 Females per 100 Males in Eagle.
What is the Median Population Age in Eagle?
Median Population Age in Eagle is 41.4 Years.
What is the Average Family Size in Eagle
Average Family Size in Eagle is 2.8 People.
What is the Average Household Size in Eagle
Average Household Size in Eagle is 2.6 People.
How Large is the Labor Force in Eagle?
There are 1,248 People in the Labor Forcein in Eagle.
What is the Percentage of People in the Labor Force in Eagle?
74.0% of People are in the Labor Force in Eagle.
What is the Unemployment Rate in Eagle?
Unemployment Rate in Eagle is 1.8%.