Buffalo City, WI Map & Demographics
Buffalo City Map
Buffalo City Overview
$41,735
PER CAPITA INCOME
$77,750
AVG FAMILY INCOME
$67,955
AVG HOUSEHOLD INCOME
34.1%
WAGE / INCOME GAP [ % ]
65.9¢/ $1
WAGE / INCOME GAP [ $ ]
0.38
INEQUALITY / GINI INDEX
835
TOTAL POPULATION
449
MALE POPULATION
386
FEMALE POPULATION
116.32
MALES / 100 FEMALES
85.97
FEMALES / 100 MALES
56.3
MEDIAN AGE
2.4
AVG FAMILY SIZE
1.9
AVG HOUSEHOLD SIZE
487
LABOR FORCE [ PEOPLE ]
63.5%
PERCENT IN LABOR FORCE
2.3%
UNEMPLOYMENT RATE
Buffalo City Area Codes
Income in Buffalo City
Income Overview in Buffalo City
Per Capita Income in Buffalo City is $41,735, while median incomes of families and households are $77,750 and $67,955 respectively.
| Characteristic | Number | Measure |
| Per Capita Income | 835 | $41,735 |
| Median Family Income | 273 | $77,750 |
| Mean Family Income | 273 | $81,706 |
| Median Household Income | 432 | $67,955 |
| Mean Household Income | 432 | $75,395 |
| Income Deficit | 273 | $0 |
| Wage / Income Gap (%) | 835 | 34.10% |
| Wage / Income Gap ($) | 835 | 65.90¢ per $1 |
| Gini / Inequality Index | 835 | 0.38 |
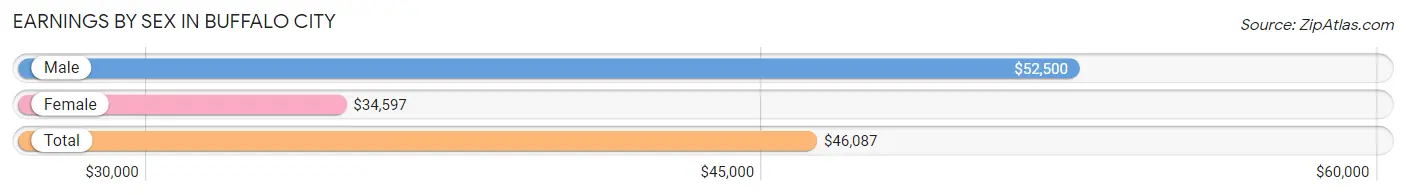
Earnings by Sex in Buffalo City
Average Earnings in Buffalo City are $46,087, $52,500 for men and $34,597 for women, a difference of 34.1%.
| Sex | Number | Average Earnings |
| Male | 284 (56.4%) | $52,500 |
| Female | 220 (43.6%) | $34,597 |
| Total | 504 (100.0%) | $46,087 |
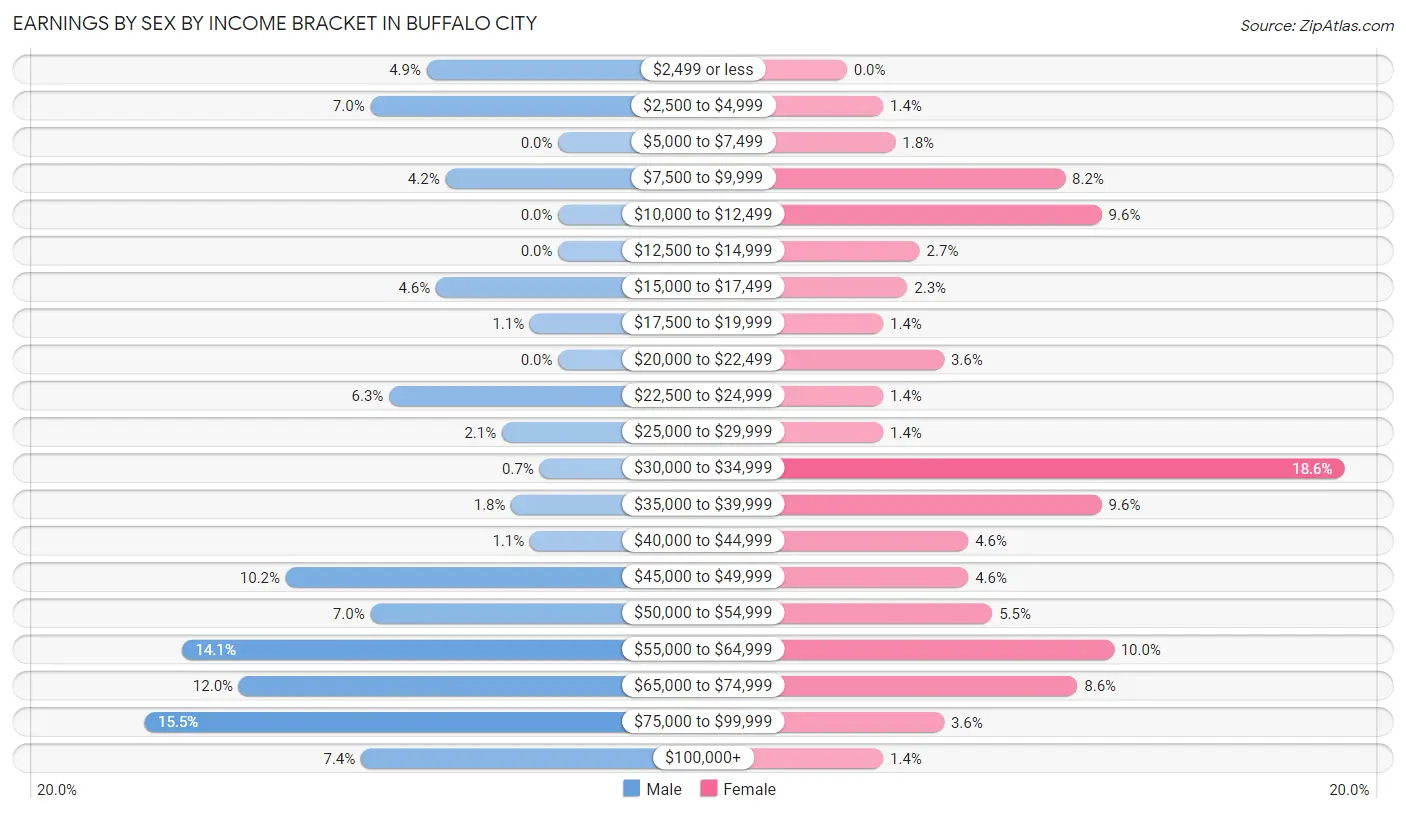
Earnings by Sex by Income Bracket in Buffalo City
The most common earnings brackets in Buffalo City are $75,000 to $99,999 for men (44 | 15.5%) and $30,000 to $34,999 for women (41 | 18.6%).
| Income | Male | Female |
| $2,499 or less | 14 (4.9%) | 0 (0.0%) |
| $2,500 to $4,999 | 20 (7.0%) | 3 (1.4%) |
| $5,000 to $7,499 | 0 (0.0%) | 4 (1.8%) |
| $7,500 to $9,999 | 12 (4.2%) | 18 (8.2%) |
| $10,000 to $12,499 | 0 (0.0%) | 21 (9.6%) |
| $12,500 to $14,999 | 0 (0.0%) | 6 (2.7%) |
| $15,000 to $17,499 | 13 (4.6%) | 5 (2.3%) |
| $17,500 to $19,999 | 3 (1.1%) | 3 (1.4%) |
| $20,000 to $22,499 | 0 (0.0%) | 8 (3.6%) |
| $22,500 to $24,999 | 18 (6.3%) | 3 (1.4%) |
| $25,000 to $29,999 | 6 (2.1%) | 3 (1.4%) |
| $30,000 to $34,999 | 2 (0.7%) | 41 (18.6%) |
| $35,000 to $39,999 | 5 (1.8%) | 21 (9.6%) |
| $40,000 to $44,999 | 3 (1.1%) | 10 (4.5%) |
| $45,000 to $49,999 | 29 (10.2%) | 10 (4.5%) |
| $50,000 to $54,999 | 20 (7.0%) | 12 (5.4%) |
| $55,000 to $64,999 | 40 (14.1%) | 22 (10.0%) |
| $65,000 to $74,999 | 34 (12.0%) | 19 (8.6%) |
| $75,000 to $99,999 | 44 (15.5%) | 8 (3.6%) |
| $100,000+ | 21 (7.4%) | 3 (1.4%) |
| Total | 284 (100.0%) | 220 (100.0%) |
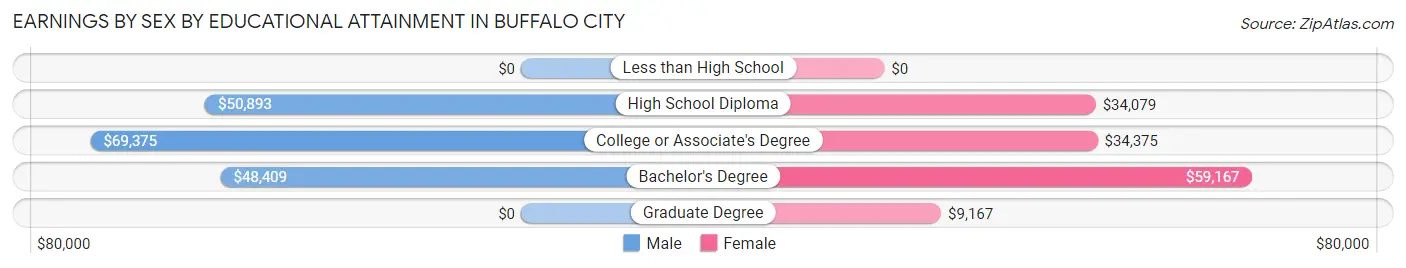
Earnings by Sex by Educational Attainment in Buffalo City
Average earnings in Buffalo City are $51,765 for men and $34,798 for women, a difference of 32.8%. Men with an educational attainment of college or associate's degree enjoy the highest average annual earnings of $69,375, while those with bachelor's degree education earn the least with $48,409. Women with an educational attainment of bachelor's degree earn the most with the average annual earnings of $59,167, while those with graduate degree education have the smallest earnings of $9,167.
| Educational Attainment | Male Income | Female Income |
| Less than High School | - | - |
| High School Diploma | $50,893 | $34,079 |
| College or Associate's Degree | $69,375 | $34,375 |
| Bachelor's Degree | $48,409 | $59,167 |
| Graduate Degree | - | - |
| Total | $51,765 | $34,798 |
Family Income in Buffalo City
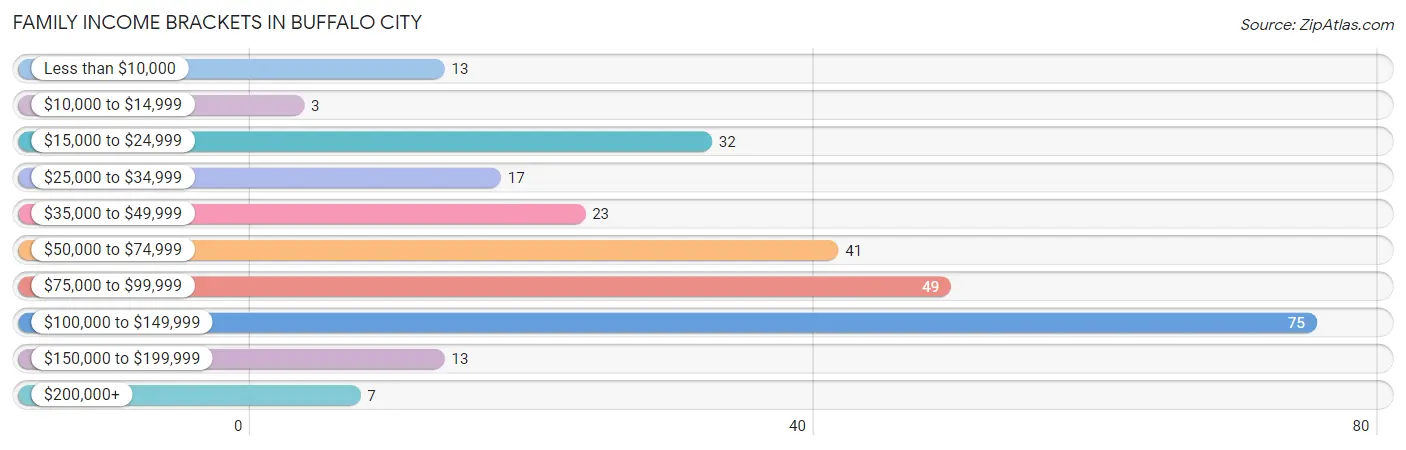
Family Income Brackets in Buffalo City
According to the Buffalo City family income data, there are 75 families falling into the $100,000 to $149,999 income range, which is the most common income bracket and makes up 27.5% of all families. Conversely, the $10,000 to $14,999 income bracket is the least frequent group with only 3 families (1.1%) belonging to this category.
| Income Bracket | # Families | % Families |
| Less than $10,000 | 13 | 4.8% |
| $10,000 to $14,999 | 3 | 1.1% |
| $15,000 to $24,999 | 32 | 11.7% |
| $25,000 to $34,999 | 17 | 6.2% |
| $35,000 to $49,999 | 23 | 8.4% |
| $50,000 to $74,999 | 41 | 15.0% |
| $75,000 to $99,999 | 49 | 17.9% |
| $100,000 to $149,999 | 75 | 27.5% |
| $150,000 to $199,999 | 13 | 4.8% |
| $200,000+ | 7 | 2.6% |
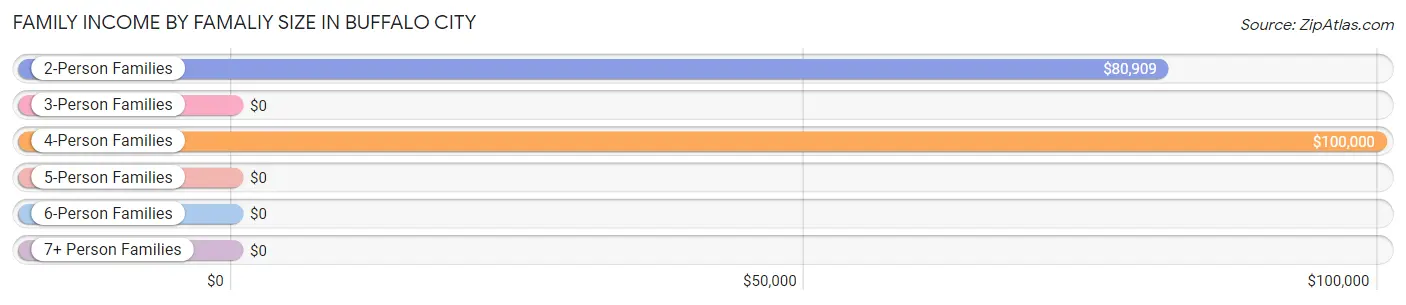
Family Income by Famaliy Size in Buffalo City
4-person families (16 | 5.9%) account for the highest median family income in Buffalo City with $100,000 per family, while 2-person families (200 | 73.3%) have the highest median income of $40,454 per family member.
| Income Bracket | # Families | Median Income |
| 2-Person Families | 200 (73.3%) | $80,909 |
| 3-Person Families | 54 (19.8%) | $0 |
| 4-Person Families | 16 (5.9%) | $100,000 |
| 5-Person Families | 0 (0.0%) | $0 |
| 6-Person Families | 3 (1.1%) | $0 |
| 7+ Person Families | 0 (0.0%) | $0 |
| Total | 273 (100.0%) | $77,750 |
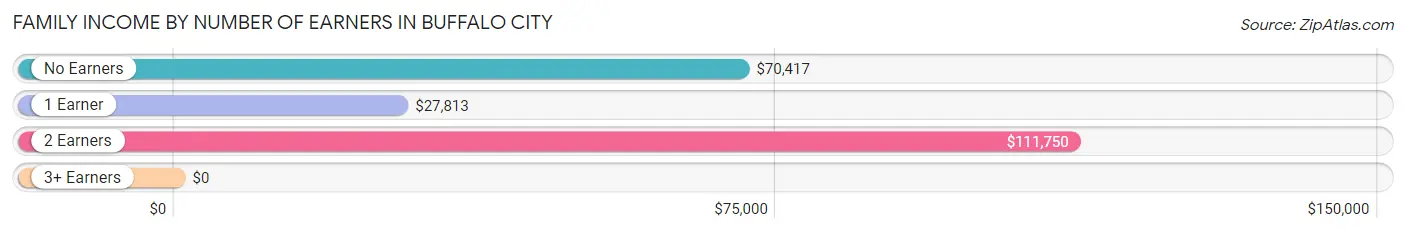
Family Income by Number of Earners in Buffalo City
| Number of Earners | # Families | Median Income |
| No Earners | 58 (21.2%) | $70,417 |
| 1 Earner | 92 (33.7%) | $27,813 |
| 2 Earners | 119 (43.6%) | $111,750 |
| 3+ Earners | 4 (1.5%) | $0 |
| Total | 273 (100.0%) | $77,750 |
Household Income in Buffalo City
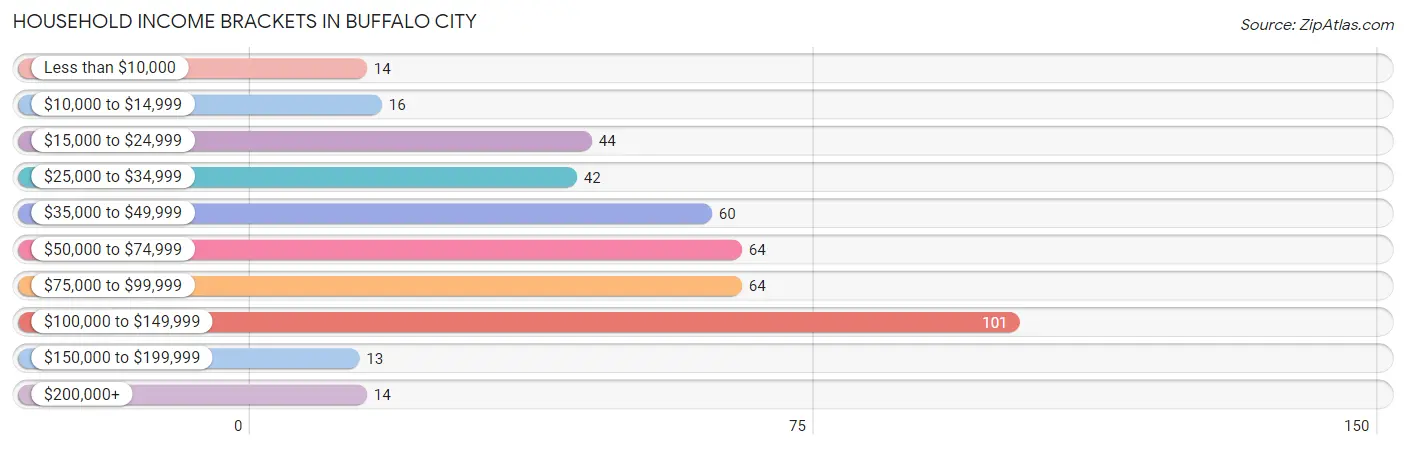
Household Income Brackets in Buffalo City
With 101 households falling in the category, the $100,000 to $149,999 income range is the most frequent in Buffalo City, accounting for 23.4% of all households. In contrast, only 13 households (3.0%) fall into the $150,000 to $199,999 income bracket, making it the least populous group.
| Income Bracket | # Households | % Households |
| Less than $10,000 | 14 | 3.2% |
| $10,000 to $14,999 | 16 | 3.7% |
| $15,000 to $24,999 | 44 | 10.2% |
| $25,000 to $34,999 | 42 | 9.7% |
| $35,000 to $49,999 | 60 | 13.9% |
| $50,000 to $74,999 | 64 | 14.8% |
| $75,000 to $99,999 | 64 | 14.8% |
| $100,000 to $149,999 | 101 | 23.4% |
| $150,000 to $199,999 | 13 | 3.0% |
| $200,000+ | 14 | 3.2% |
Household Income by Householder Age in Buffalo City
The median household income in Buffalo City is $67,955, with the highest median household income of $82,250 found in the 25 to 44 years age bracket for the primary householder. A total of 87 households (20.1%) fall into this category. Meanwhile, the 15 to 24 years age bracket for the primary householder has the lowest median household income of $0, with 14 households (3.2%) in this group.
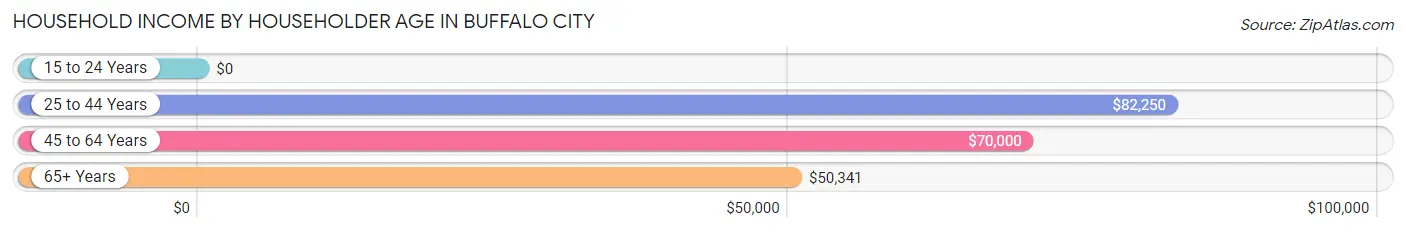
| Income Bracket | # Households | Median Income |
| 15 to 24 Years | 14 (3.2%) | $0 |
| 25 to 44 Years | 87 (20.1%) | $82,250 |
| 45 to 64 Years | 198 (45.8%) | $70,000 |
| 65+ Years | 133 (30.8%) | $50,341 |
| Total | 432 (100.0%) | $67,955 |
Poverty in Buffalo City
Income Below Poverty by Sex and Age in Buffalo City
With 4.9% poverty level for males and 7.2% for females among the residents of Buffalo City, under 5 year old males and 12 to 14 year old females are the most vulnerable to poverty, with 4 males (26.7%) and 4 females (44.4%) in their respective age groups living below the poverty level.
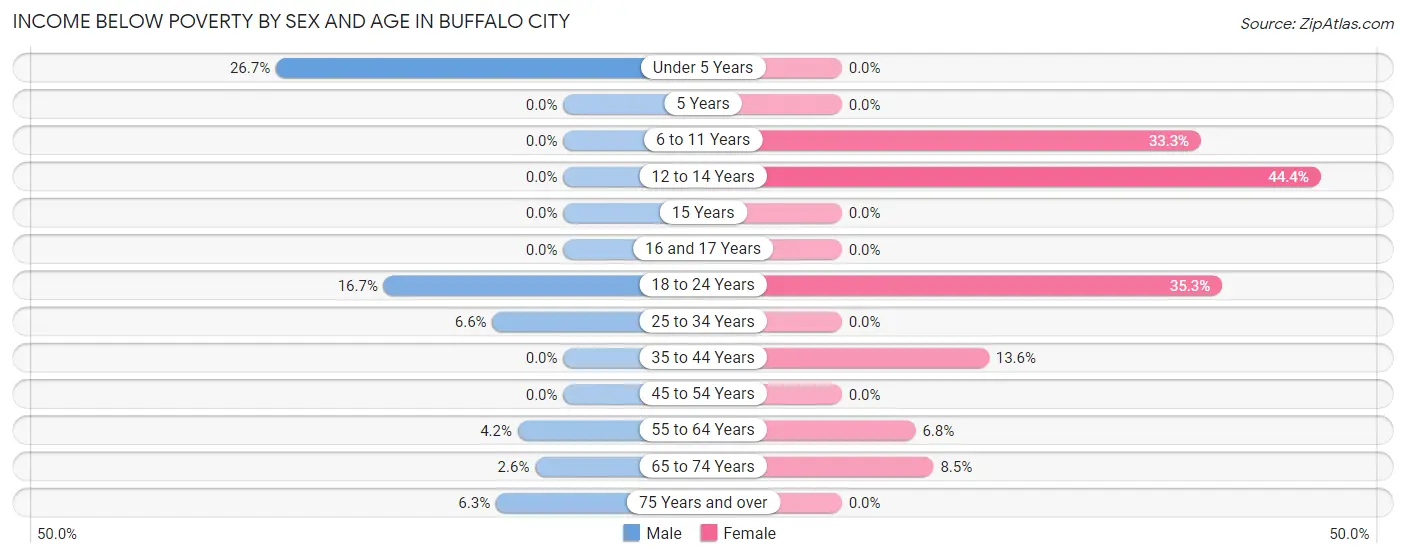
| Age Bracket | Male | Female |
| Under 5 Years | 4 (26.7%) | 0 (0.0%) |
| 5 Years | 0 (0.0%) | 0 (0.0%) |
| 6 to 11 Years | 0 (0.0%) | 3 (33.3%) |
| 12 to 14 Years | 0 (0.0%) | 4 (44.4%) |
| 15 Years | 0 (0.0%) | 0 (0.0%) |
| 16 and 17 Years | 0 (0.0%) | 0 (0.0%) |
| 18 to 24 Years | 4 (16.7%) | 6 (35.3%) |
| 25 to 34 Years | 5 (6.6%) | 0 (0.0%) |
| 35 to 44 Years | 0 (0.0%) | 3 (13.6%) |
| 45 to 54 Years | 0 (0.0%) | 0 (0.0%) |
| 55 to 64 Years | 3 (4.2%) | 8 (6.8%) |
| 65 to 74 Years | 3 (2.6%) | 4 (8.5%) |
| 75 Years and over | 3 (6.2%) | 0 (0.0%) |
| Total | 22 (4.9%) | 28 (7.2%) |
Income Above Poverty by Sex and Age in Buffalo City
According to the poverty statistics in Buffalo City, males aged 6 to 11 years and females aged under 5 years are the age groups that are most secure financially, with 100.0% of males and 100.0% of females in these age groups living above the poverty line.
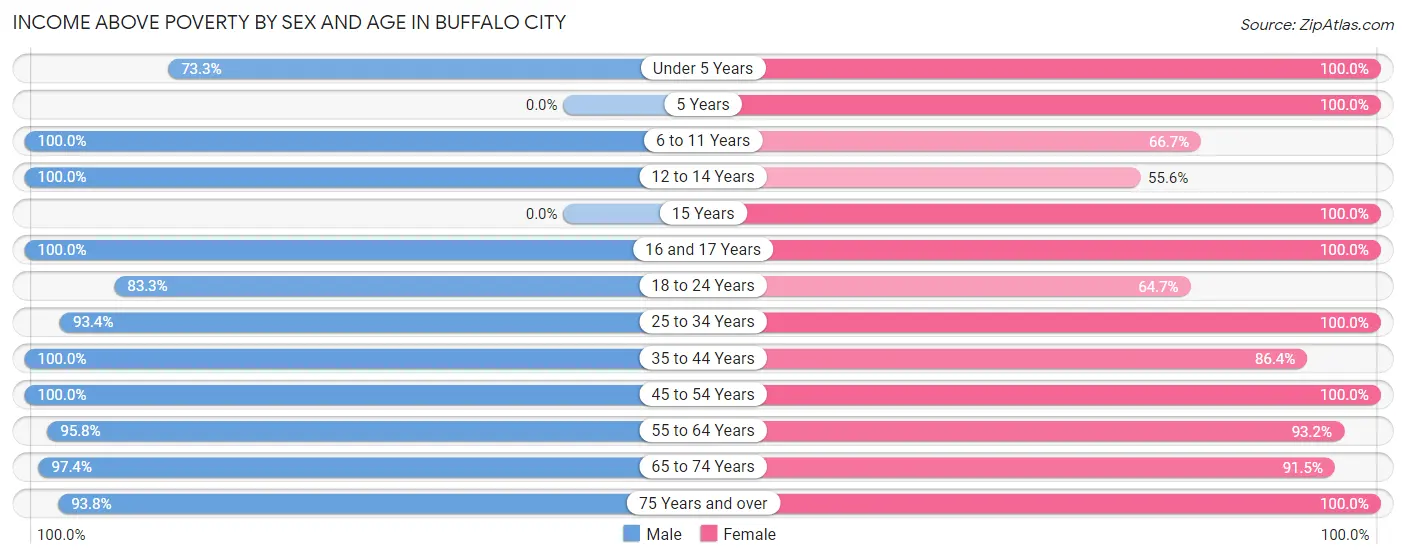
| Age Bracket | Male | Female |
| Under 5 Years | 11 (73.3%) | 16 (100.0%) |
| 5 Years | 0 (0.0%) | 3 (100.0%) |
| 6 to 11 Years | 9 (100.0%) | 6 (66.7%) |
| 12 to 14 Years | 4 (100.0%) | 5 (55.6%) |
| 15 Years | 0 (0.0%) | 3 (100.0%) |
| 16 and 17 Years | 2 (100.0%) | 4 (100.0%) |
| 18 to 24 Years | 20 (83.3%) | 11 (64.7%) |
| 25 to 34 Years | 71 (93.4%) | 59 (100.0%) |
| 35 to 44 Years | 31 (100.0%) | 19 (86.4%) |
| 45 to 54 Years | 54 (100.0%) | 49 (100.0%) |
| 55 to 64 Years | 68 (95.8%) | 109 (93.2%) |
| 65 to 74 Years | 112 (97.4%) | 43 (91.5%) |
| 75 Years and over | 45 (93.8%) | 31 (100.0%) |
| Total | 427 (95.1%) | 358 (92.7%) |
Income Below Poverty Among Married-Couple Families in Buffalo City
The poverty statistics for married-couple families in Buffalo City show that 2.2% or 5 of the total 232 families live below the poverty line. Families with no children have the highest poverty rate of 2.5%, comprising of 5 families. On the other hand, families with 1 or 2 children have the lowest poverty rate of 0.0%, which includes 0 families.
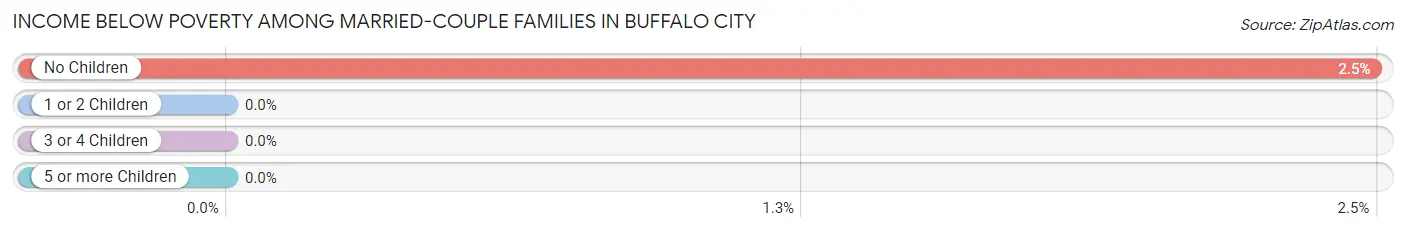
| Children | Above Poverty | Below Poverty |
| No Children | 196 (97.5%) | 5 (2.5%) |
| 1 or 2 Children | 28 (100.0%) | 0 (0.0%) |
| 3 or 4 Children | 3 (100.0%) | 0 (0.0%) |
| 5 or more Children | 0 (0.0%) | 0 (0.0%) |
| Total | 227 (97.8%) | 5 (2.2%) |
Income Below Poverty Among Single-Parent Households in Buffalo City
According to the poverty data in Buffalo City, 26.3% or 5 single-father households and 27.3% or 6 single-mother households are living below the poverty line. Among single-father households, those with 1 or 2 children have the highest poverty rate, with 5 households (55.6%) experiencing poverty. Likewise, among single-mother households, those with 1 or 2 children have the highest poverty rate, with 3 households (37.5%) falling below the poverty line.
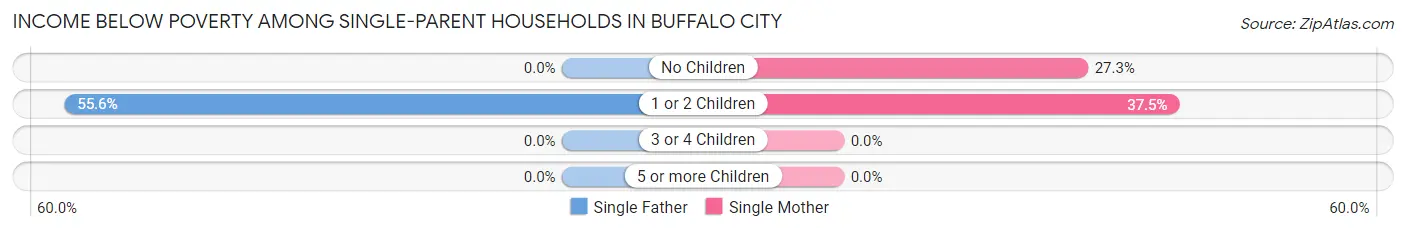
| Children | Single Father | Single Mother |
| No Children | 0 (0.0%) | 3 (27.3%) |
| 1 or 2 Children | 5 (55.6%) | 3 (37.5%) |
| 3 or 4 Children | 0 (0.0%) | 0 (0.0%) |
| 5 or more Children | 0 (0.0%) | 0 (0.0%) |
| Total | 5 (26.3%) | 6 (27.3%) |
Income Below Poverty Among Married-Couple vs Single-Parent Households in Buffalo City
The poverty data for Buffalo City shows that 5 of the married-couple family households (2.2%) and 11 of the single-parent households (26.8%) are living below the poverty level. Within the married-couple family households, those with no children have the highest poverty rate, with 5 households (2.5%) falling below the poverty line. Among the single-parent households, those with 1 or 2 children have the highest poverty rate, with 8 household (47.1%) living below poverty.
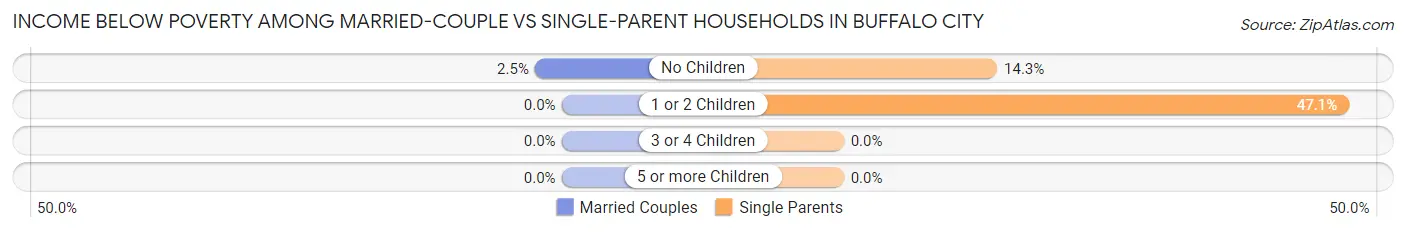
| Children | Married-Couple Families | Single-Parent Households |
| No Children | 5 (2.5%) | 3 (14.3%) |
| 1 or 2 Children | 0 (0.0%) | 8 (47.1%) |
| 3 or 4 Children | 0 (0.0%) | 0 (0.0%) |
| 5 or more Children | 0 (0.0%) | 0 (0.0%) |
| Total | 5 (2.2%) | 11 (26.8%) |
Race in Buffalo City
The most populous races in Buffalo City are White / Caucasian (821 | 98.3%), and Two or more Races (14 | 1.7%).
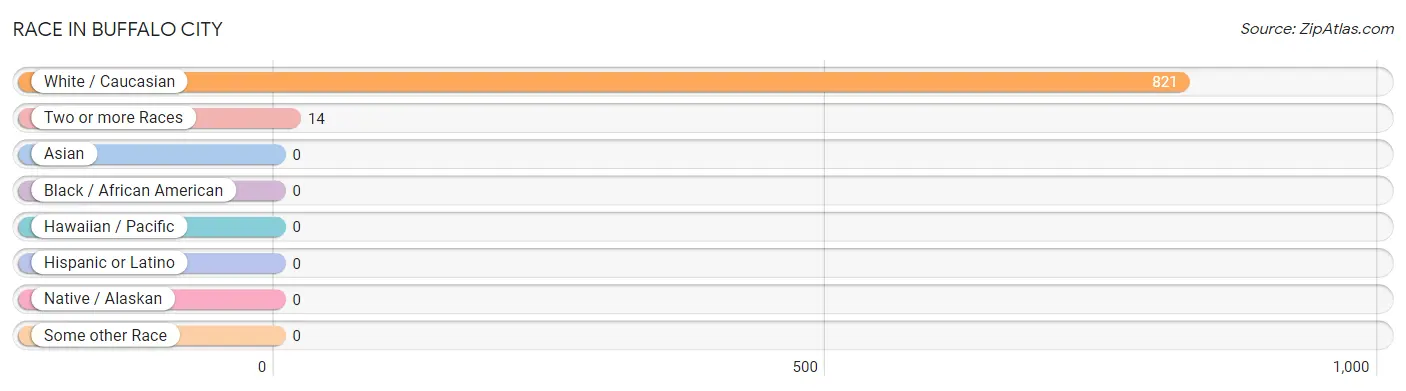
| Race | # Population | % Population |
| Asian | 0 | 0.0% |
| Black / African American | 0 | 0.0% |
| Hawaiian / Pacific | 0 | 0.0% |
| Hispanic or Latino | 0 | 0.0% |
| Native / Alaskan | 0 | 0.0% |
| White / Caucasian | 821 | 98.3% |
| Two or more Races | 14 | 1.7% |
| Some other Race | 0 | 0.0% |
| Total | 835 | 100.0% |
Ancestry in Buffalo City
The most populous ancestries reported in Buffalo City are German (398 | 47.7%), Polish (133 | 15.9%), Irish (76 | 9.1%), French (71 | 8.5%), and Norwegian (67 | 8.0%), together accounting for 89.2% of all Buffalo City residents.
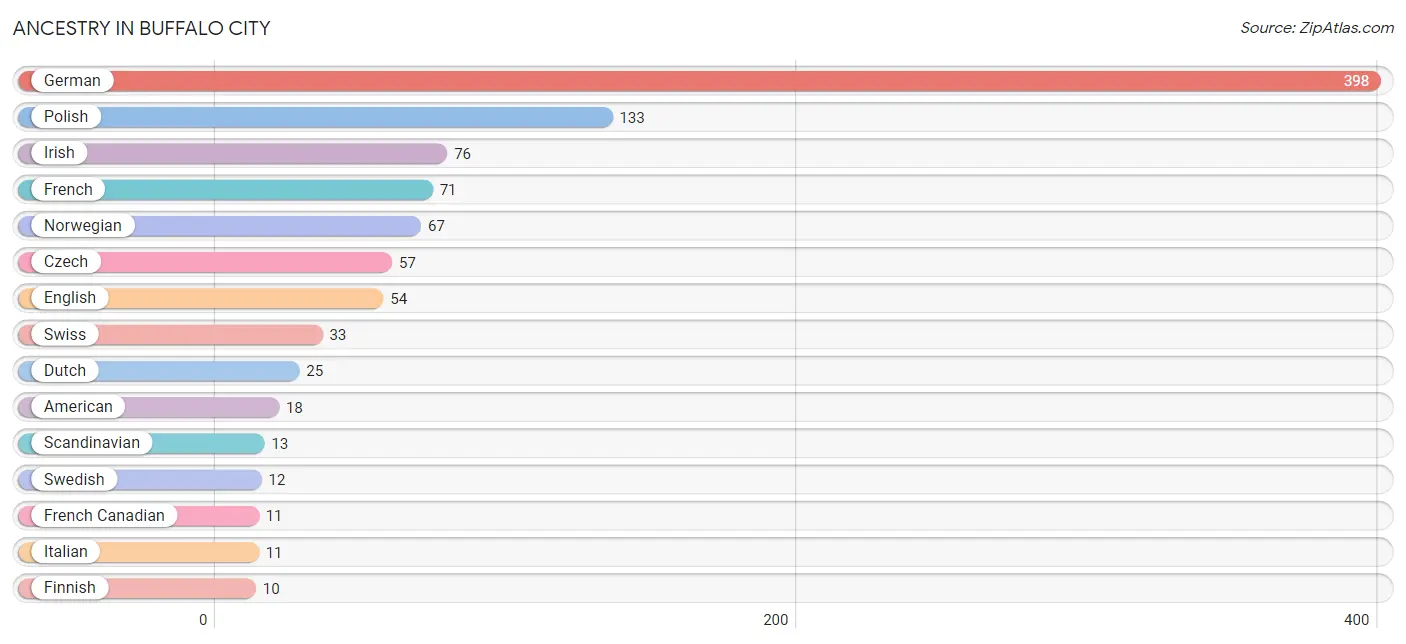
| Ancestry | # Population | % Population |
| American | 18 | 2.2% |
| Arab | 3 | 0.4% |
| Austrian | 2 | 0.2% |
| Croatian | 3 | 0.4% |
| Czech | 57 | 6.8% |
| Danish | 8 | 1.0% |
| Dutch | 25 | 3.0% |
| English | 54 | 6.5% |
| European | 3 | 0.4% |
| Finnish | 10 | 1.2% |
| French | 71 | 8.5% |
| French American Indian | 2 | 0.2% |
| French Canadian | 11 | 1.3% |
| German | 398 | 47.7% |
| Irish | 76 | 9.1% |
| Italian | 11 | 1.3% |
| Lebanese | 3 | 0.4% |
| Northern European | 3 | 0.4% |
| Norwegian | 67 | 8.0% |
| Polish | 133 | 15.9% |
| Russian | 3 | 0.4% |
| Scandinavian | 13 | 1.6% |
| Scottish | 6 | 0.7% |
| Swedish | 12 | 1.4% |
| Swiss | 33 | 4.0% |
| Welsh | 6 | 0.7% | View All 26 Rows |
Immigrants in Buffalo City
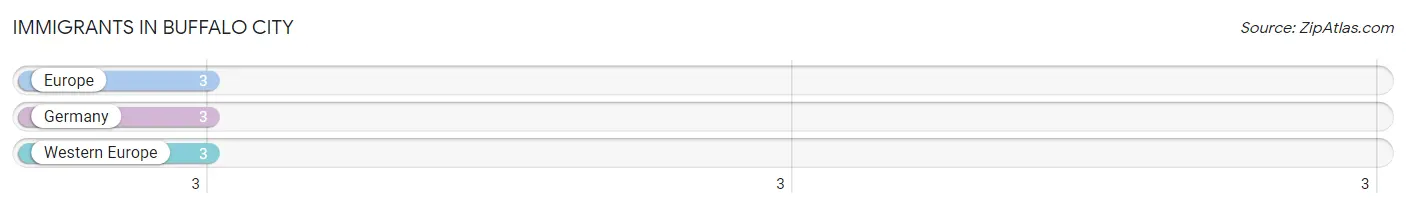
The most numerous immigrant groups reported in Buffalo City came from Europe (3 | 0.4%), Germany (3 | 0.4%), and Western Europe (3 | 0.4%), together accounting for 1.1% of all Buffalo City residents.
| Immigration Origin | # Population | % Population |
| Europe | 3 | 0.4% |
| Germany | 3 | 0.4% |
| Western Europe | 3 | 0.4% | View All 3 Rows |
Sex and Age in Buffalo City
Sex and Age in Buffalo City
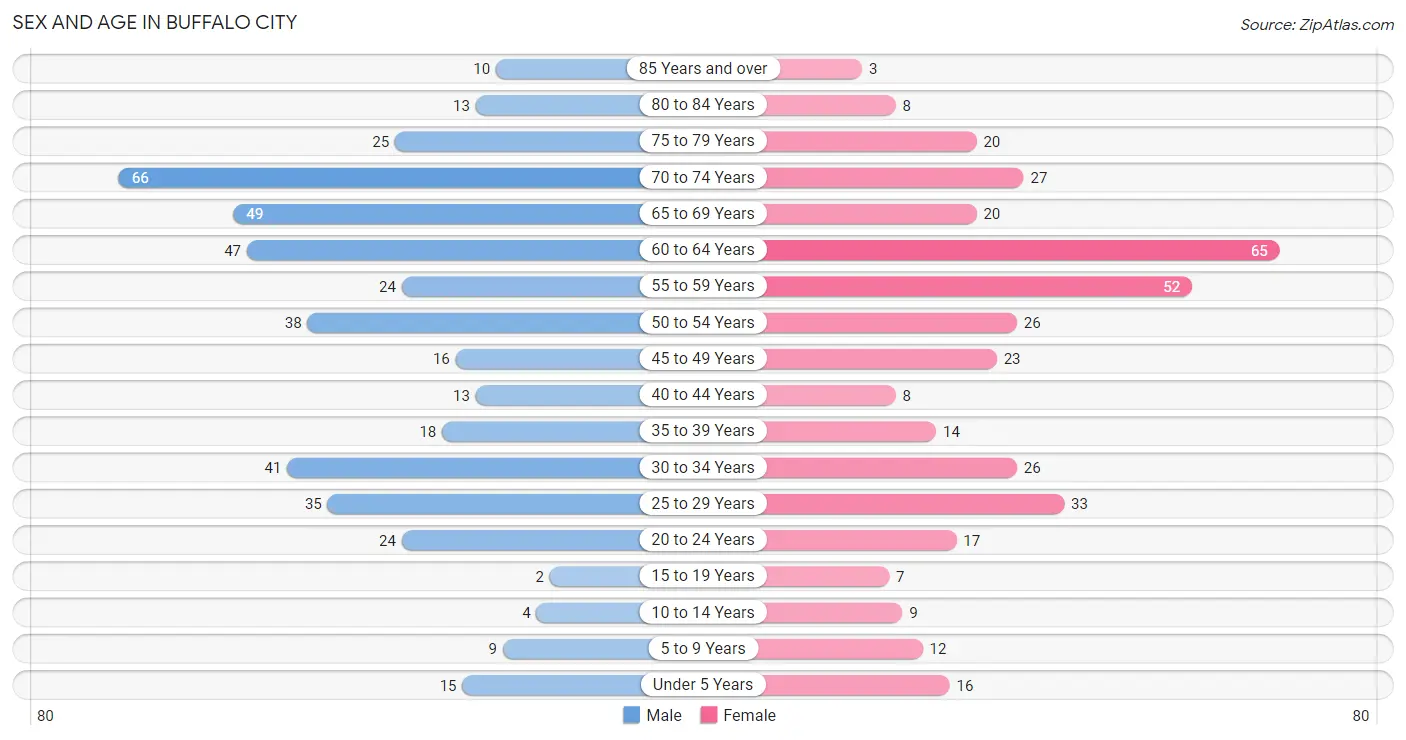
The most populous age groups in Buffalo City are 70 to 74 Years (66 | 14.7%) for men and 60 to 64 Years (65 | 16.8%) for women.
| Age Bracket | Male | Female |
| Under 5 Years | 15 (3.3%) | 16 (4.2%) |
| 5 to 9 Years | 9 (2.0%) | 12 (3.1%) |
| 10 to 14 Years | 4 (0.9%) | 9 (2.3%) |
| 15 to 19 Years | 2 (0.4%) | 7 (1.8%) |
| 20 to 24 Years | 24 (5.3%) | 17 (4.4%) |
| 25 to 29 Years | 35 (7.8%) | 33 (8.6%) |
| 30 to 34 Years | 41 (9.1%) | 26 (6.7%) |
| 35 to 39 Years | 18 (4.0%) | 14 (3.6%) |
| 40 to 44 Years | 13 (2.9%) | 8 (2.1%) |
| 45 to 49 Years | 16 (3.6%) | 23 (6.0%) |
| 50 to 54 Years | 38 (8.5%) | 26 (6.7%) |
| 55 to 59 Years | 24 (5.3%) | 52 (13.5%) |
| 60 to 64 Years | 47 (10.5%) | 65 (16.8%) |
| 65 to 69 Years | 49 (10.9%) | 20 (5.2%) |
| 70 to 74 Years | 66 (14.7%) | 27 (7.0%) |
| 75 to 79 Years | 25 (5.6%) | 20 (5.2%) |
| 80 to 84 Years | 13 (2.9%) | 8 (2.1%) |
| 85 Years and over | 10 (2.2%) | 3 (0.8%) |
| Total | 449 (100.0%) | 386 (100.0%) |
Families and Households in Buffalo City
Median Family Size in Buffalo City
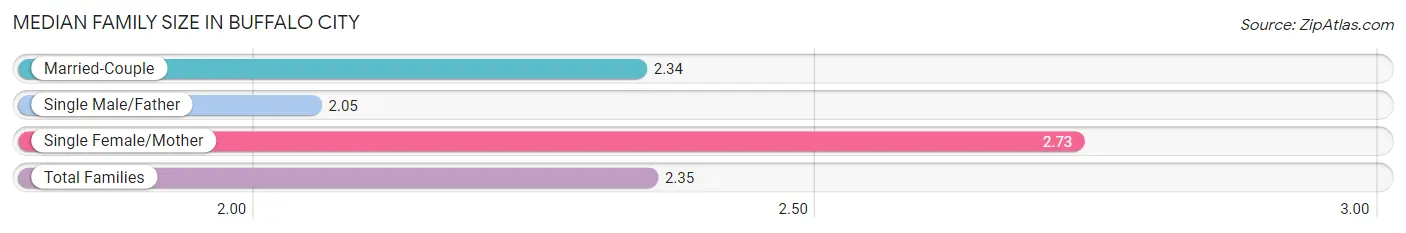
The median family size in Buffalo City is 2.35 persons per family, with single female/mother families (22 | 8.1%) accounting for the largest median family size of 2.73 persons per family. On the other hand, single male/father families (19 | 7.0%) represent the smallest median family size with 2.05 persons per family.
| Family Type | # Families | Family Size |
| Married-Couple | 232 (85.0%) | 2.34 |
| Single Male/Father | 19 (7.0%) | 2.05 |
| Single Female/Mother | 22 (8.1%) | 2.73 |
| Total Families | 273 (100.0%) | 2.35 |
Median Household Size in Buffalo City
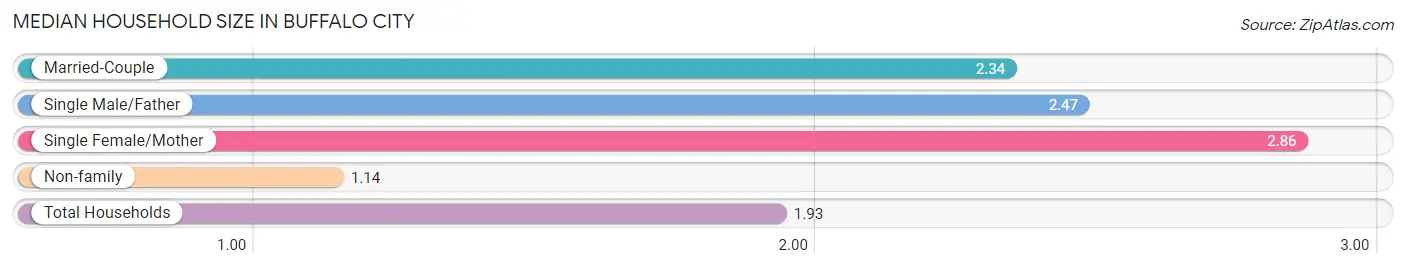
The median household size in Buffalo City is 1.93 persons per household, with single female/mother households (22 | 5.1%) accounting for the largest median household size of 2.86 persons per household. non-family households (159 | 36.8%) represent the smallest median household size with 1.14 persons per household.
| Household Type | # Households | Household Size |
| Married-Couple | 232 (53.7%) | 2.34 |
| Single Male/Father | 19 (4.4%) | 2.47 |
| Single Female/Mother | 22 (5.1%) | 2.86 |
| Non-family | 159 (36.8%) | 1.14 |
| Total Households | 432 (100.0%) | 1.93 |
Household Size by Marriage Status in Buffalo City
Out of a total of 432 households in Buffalo City, 273 (63.2%) are family households, while 159 (36.8%) are nonfamily households. The most numerous type of family households are 2-person households, comprising 189, and the most common type of nonfamily households are 1-person households, comprising 142.
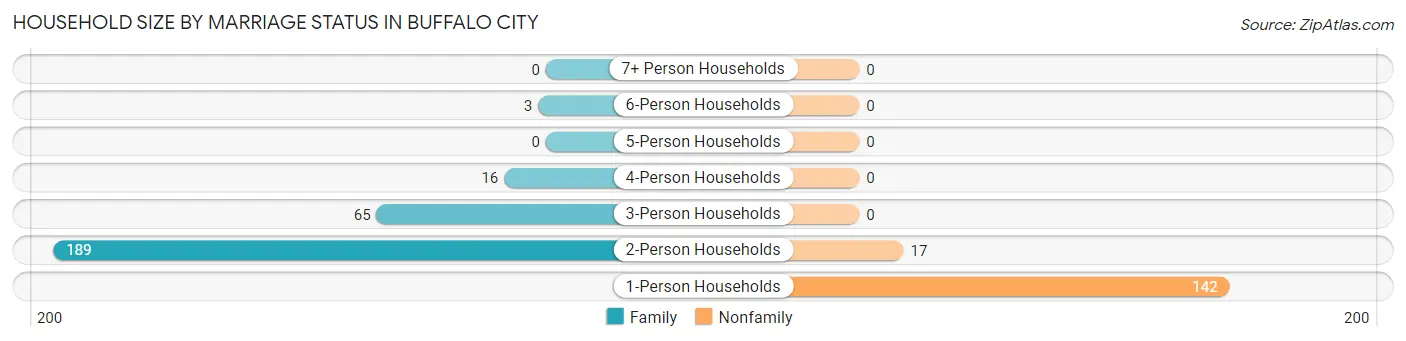
| Household Size | Family Households | Nonfamily Households |
| 1-Person Households | - | 142 (32.9%) |
| 2-Person Households | 189 (43.8%) | 17 (3.9%) |
| 3-Person Households | 65 (15.0%) | 0 (0.0%) |
| 4-Person Households | 16 (3.7%) | 0 (0.0%) |
| 5-Person Households | 0 (0.0%) | 0 (0.0%) |
| 6-Person Households | 3 (0.7%) | 0 (0.0%) |
| 7+ Person Households | 0 (0.0%) | 0 (0.0%) |
| Total | 273 (63.2%) | 159 (36.8%) |
Female Fertility in Buffalo City
Fertility by Age in Buffalo City
Average fertility rate in Buffalo City is 103.0 births per 1,000 women. Women in the age bracket of 20 to 34 years have the highest fertility rate with 184.0 births per 1,000 women. Women in the age bracket of 20 to 34 years acount for 100.0% of all women with births.
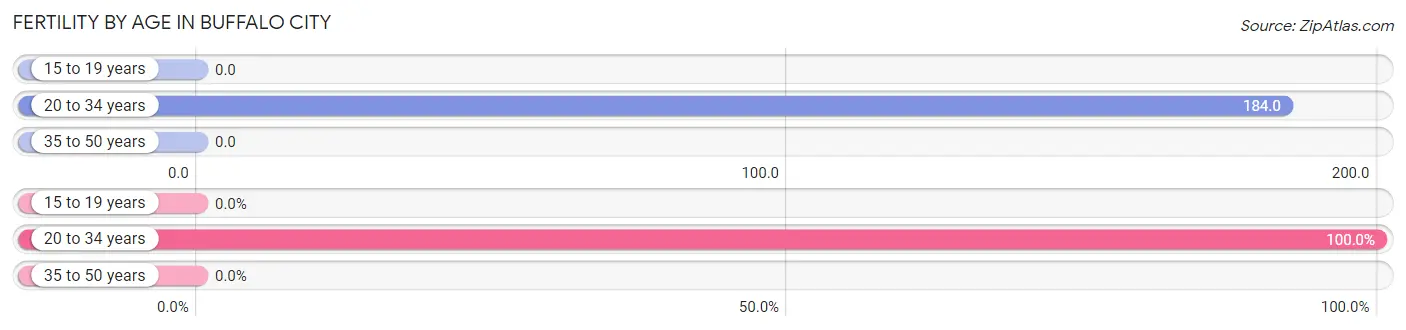
| Age Bracket | Women with Births | Births / 1,000 Women |
| 15 to 19 years | 0 (0.0%) | 0.0 |
| 20 to 34 years | 14 (100.0%) | 184.0 |
| 35 to 50 years | 0 (0.0%) | 0.0 |
| Total | 14 (100.0%) | 103.0 |
Fertility by Age by Marriage Status in Buffalo City
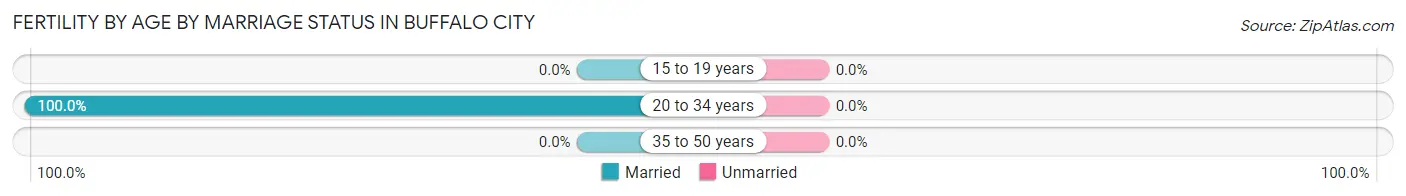
| Age Bracket | Married | Unmarried |
| 15 to 19 years | 0 (0.0%) | 0 (0.0%) |
| 20 to 34 years | 14 (100.0%) | 0 (0.0%) |
| 35 to 50 years | 0 (0.0%) | 0 (0.0%) |
| Total | 14 (100.0%) | 0 (0.0%) |
Fertility by Education in Buffalo City
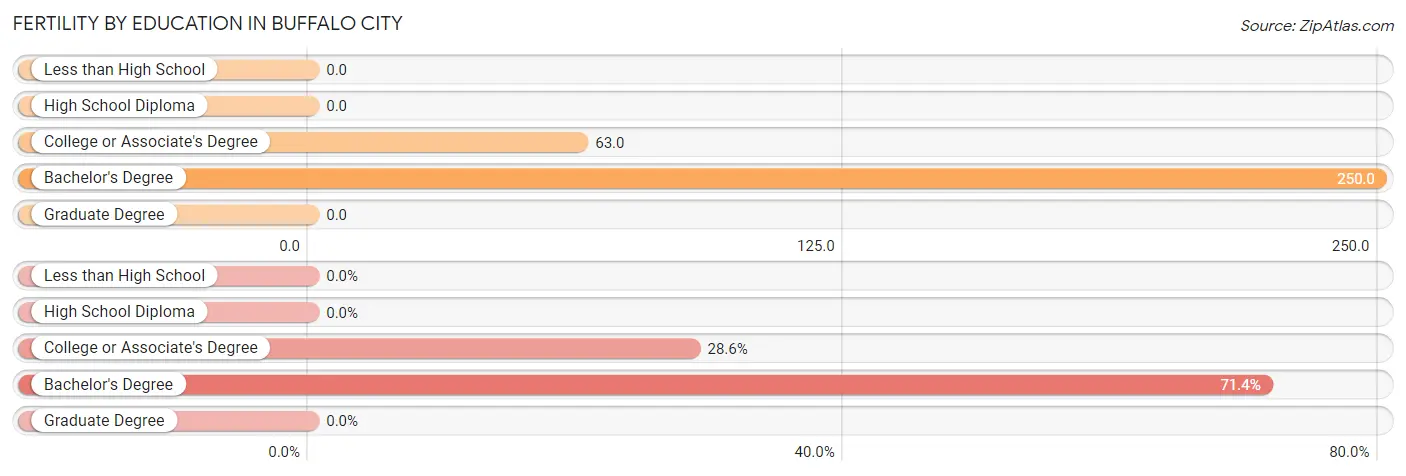
| Educational Attainment | Women with Births | Births / 1,000 Women |
| Less than High School | 0 (0.0%) | 0.0 |
| High School Diploma | 0 (0.0%) | 0.0 |
| College or Associate's Degree | 4 (28.6%) | 63.0 |
| Bachelor's Degree | 10 (71.4%) | 250.0 |
| Graduate Degree | 0 (0.0%) | 0.0 |
| Total | 14 (100.0%) | 103.0 |
Fertility by Education by Marriage Status in Buffalo City
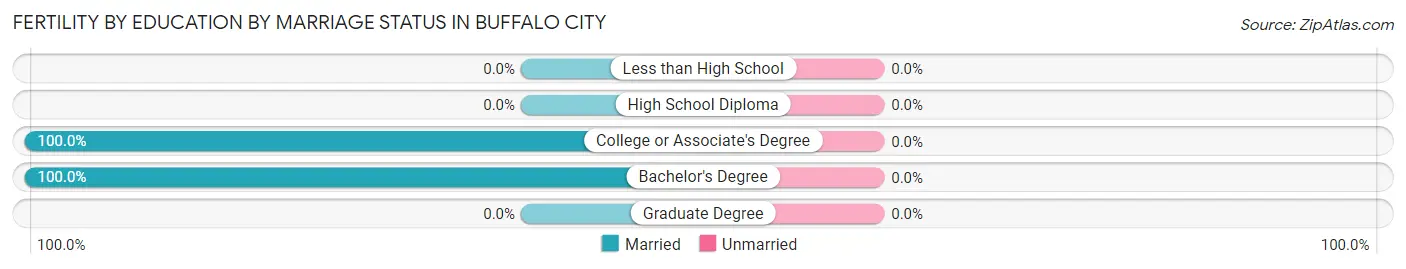
| Educational Attainment | Married | Unmarried |
| Less than High School | 0 (0.0%) | 0 (0.0%) |
| High School Diploma | 0 (0.0%) | 0 (0.0%) |
| College or Associate's Degree | 4 (100.0%) | 0 (0.0%) |
| Bachelor's Degree | 10 (100.0%) | 0 (0.0%) |
| Graduate Degree | 0 (0.0%) | 0 (0.0%) |
| Total | 14 (100.0%) | 0 (0.0%) |
Employment Characteristics in Buffalo City
Employment by Class of Employer in Buffalo City
Among the 457 employed individuals in Buffalo City, private company employees (307 | 67.2%), local government employees (42 | 9.2%), and not-for-profit organizations (40 | 8.7%) make up the most common classes of employment.
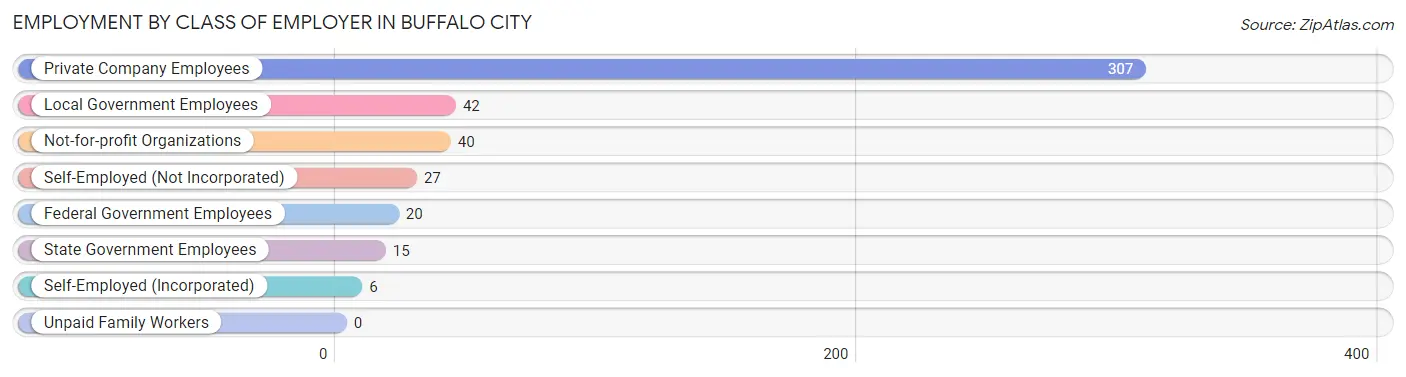
| Employer Class | # Employees | % Employees |
| Private Company Employees | 307 | 67.2% |
| Self-Employed (Incorporated) | 6 | 1.3% |
| Self-Employed (Not Incorporated) | 27 | 5.9% |
| Not-for-profit Organizations | 40 | 8.7% |
| Local Government Employees | 42 | 9.2% |
| State Government Employees | 15 | 3.3% |
| Federal Government Employees | 20 | 4.4% |
| Unpaid Family Workers | 0 | 0.0% |
| Total | 457 | 100.0% |
Employment Status by Age in Buffalo City
According to the labor force statistics for Buffalo City, out of the total population over 16 years of age (767), 63.5% or 487 individuals are in the labor force, with 2.3% or 11 of them unemployed. The age group with the highest labor force participation rate is 30 to 34 years, with 100.0% or 67 individuals in the labor force. Within the labor force, the 20 to 24 years age range has the highest percentage of unemployed individuals, with 10.8% or 4 of them being unemployed.
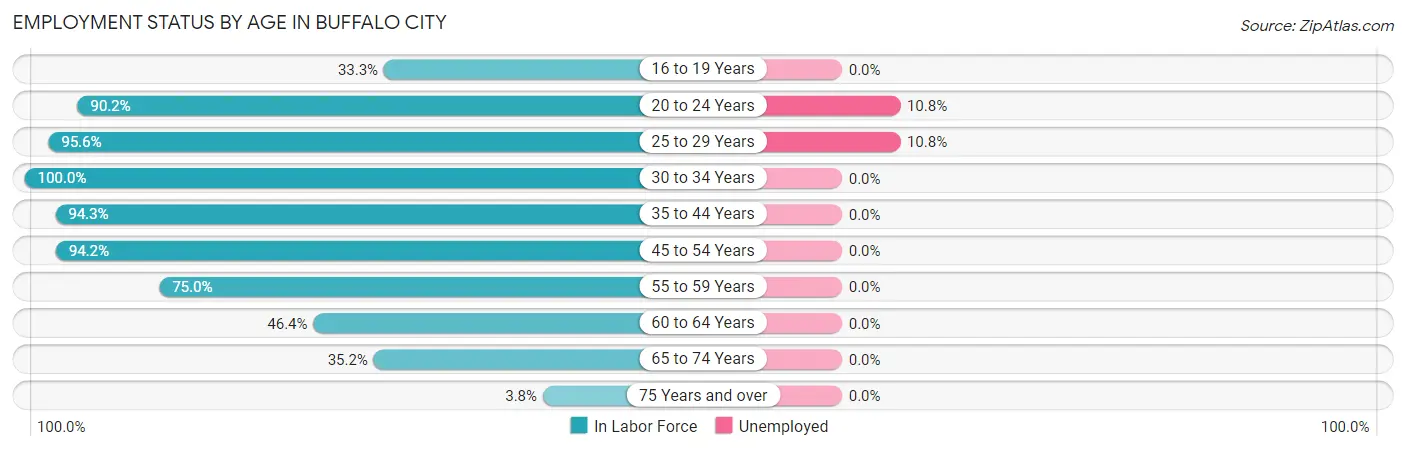
| Age Bracket | In Labor Force | Unemployed |
| 16 to 19 Years | 2 (33.3%) | 0 (0.0%) |
| 20 to 24 Years | 37 (90.2%) | 4 (10.8%) |
| 25 to 29 Years | 65 (95.6%) | 7 (10.8%) |
| 30 to 34 Years | 67 (100.0%) | 0 (0.0%) |
| 35 to 44 Years | 50 (94.3%) | 0 (0.0%) |
| 45 to 54 Years | 97 (94.2%) | 0 (0.0%) |
| 55 to 59 Years | 57 (75.0%) | 0 (0.0%) |
| 60 to 64 Years | 52 (46.4%) | 0 (0.0%) |
| 65 to 74 Years | 57 (35.2%) | 0 (0.0%) |
| 75 Years and over | 3 (3.8%) | 0 (0.0%) |
| Total | 487 (63.5%) | 11 (2.3%) |
Employment Status by Educational Attainment in Buffalo City
According to labor force statistics for Buffalo City, 81.0% of individuals (388) out of the total population between 25 and 64 years of age (479) are in the labor force, with 1.8% or 7 of them being unemployed. The group with the highest labor force participation rate are those with the educational attainment of bachelor's degree or higher, with 96.2% or 75 individuals in the labor force. Within the labor force, individuals with college / associate degree education have the highest percentage of unemployment, with 4.5% or 7 of them being unemployed.
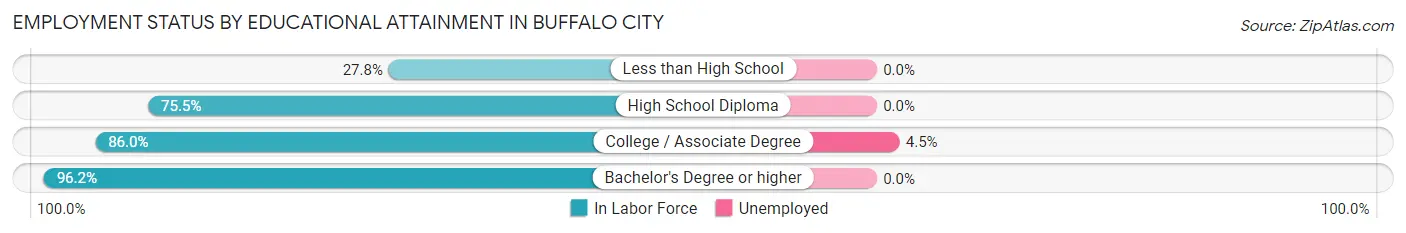
| Educational Attainment | In Labor Force | Unemployed |
| Less than High School | 5 (27.8%) | 0 (0.0%) |
| High School Diploma | 154 (75.5%) | 0 (0.0%) |
| College / Associate Degree | 154 (86.0%) | 8 (4.5%) |
| Bachelor's Degree or higher | 75 (96.2%) | 0 (0.0%) |
| Total | 388 (81.0%) | 9 (1.8%) |
Employment Occupations by Sex in Buffalo City
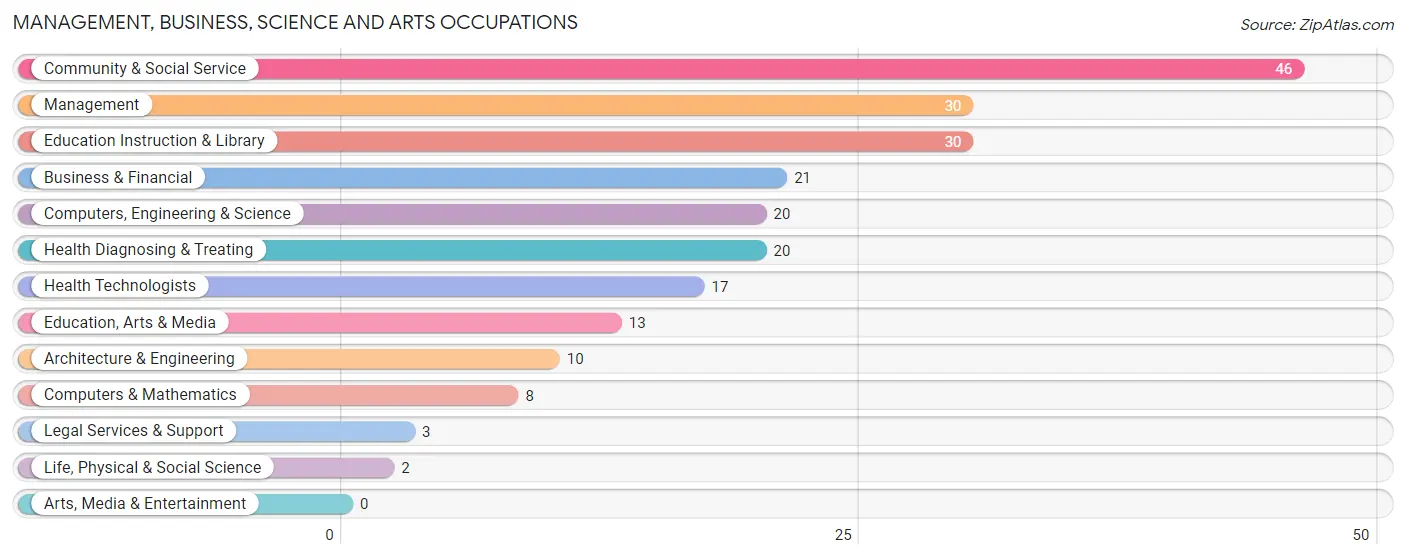
Management, Business, Science and Arts Occupations
The most common Management, Business, Science and Arts occupations in Buffalo City are Community & Social Service (46 | 9.7%), Management (30 | 6.3%), Education Instruction & Library (30 | 6.3%), Business & Financial (21 | 4.4%), and Computers, Engineering & Science (20 | 4.2%).
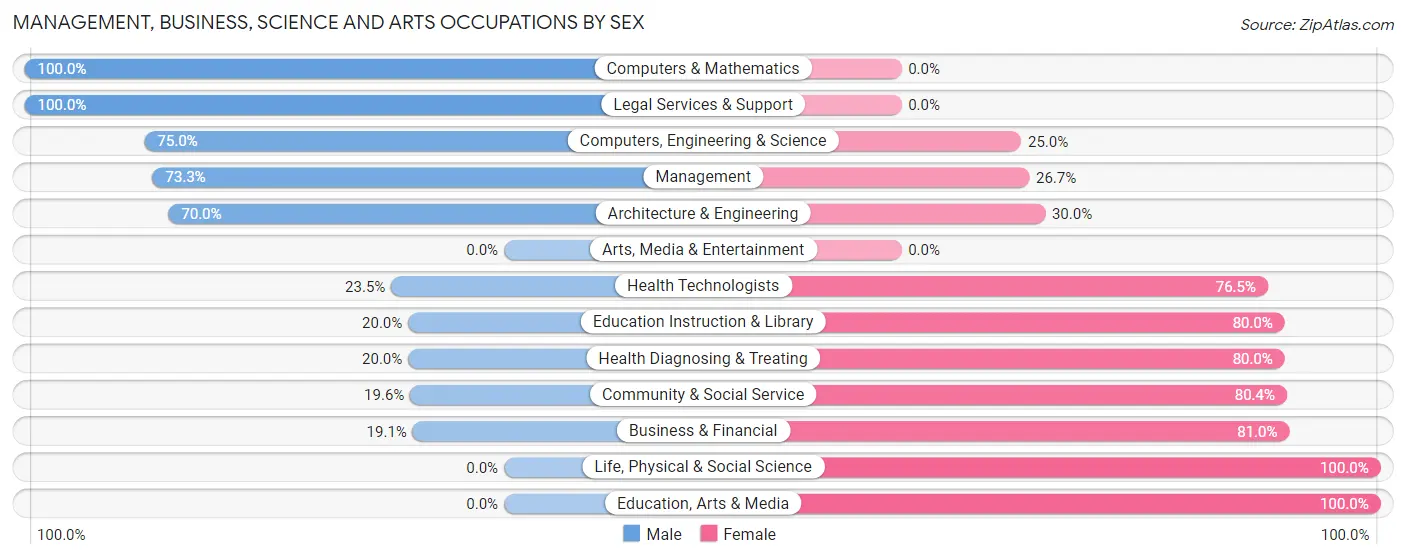
Management, Business, Science and Arts Occupations by Sex
Within the Management, Business, Science and Arts occupations in Buffalo City, the most male-oriented occupations are Computers & Mathematics (100.0%), Legal Services & Support (100.0%), and Computers, Engineering & Science (75.0%), while the most female-oriented occupations are Life, Physical & Social Science (100.0%), Education, Arts & Media (100.0%), and Business & Financial (80.9%).
| Occupation | Male | Female |
| Management | 22 (73.3%) | 8 (26.7%) |
| Business & Financial | 4 (19.1%) | 17 (80.9%) |
| Computers, Engineering & Science | 15 (75.0%) | 5 (25.0%) |
| Computers & Mathematics | 8 (100.0%) | 0 (0.0%) |
| Architecture & Engineering | 7 (70.0%) | 3 (30.0%) |
| Life, Physical & Social Science | 0 (0.0%) | 2 (100.0%) |
| Community & Social Service | 9 (19.6%) | 37 (80.4%) |
| Education, Arts & Media | 0 (0.0%) | 13 (100.0%) |
| Legal Services & Support | 3 (100.0%) | 0 (0.0%) |
| Education Instruction & Library | 6 (20.0%) | 24 (80.0%) |
| Arts, Media & Entertainment | 0 (0.0%) | 0 (0.0%) |
| Health Diagnosing & Treating | 4 (20.0%) | 16 (80.0%) |
| Health Technologists | 4 (23.5%) | 13 (76.5%) |
| Total (Category) | 54 (39.4%) | 83 (60.6%) |
| Total (Overall) | 265 (55.7%) | 211 (44.3%) |
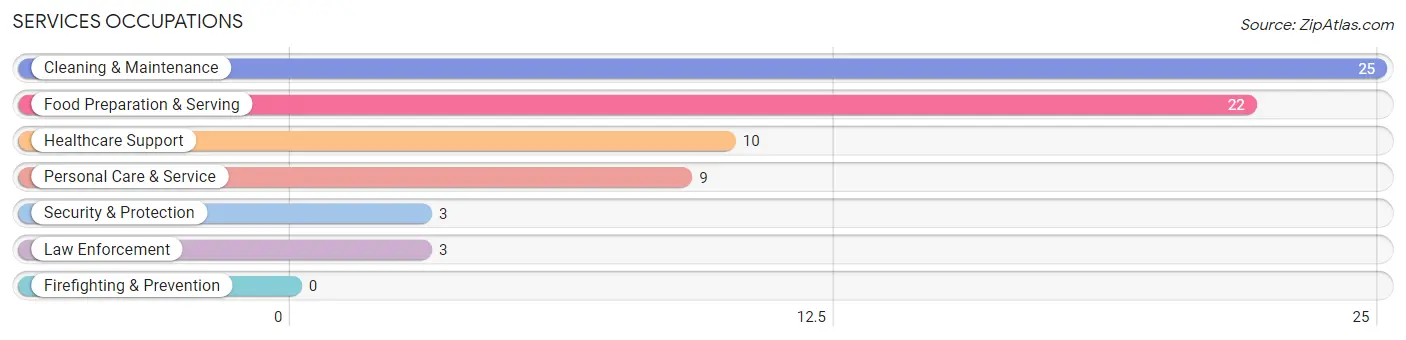
Services Occupations
The most common Services occupations in Buffalo City are Cleaning & Maintenance (25 | 5.2%), Food Preparation & Serving (22 | 4.6%), Healthcare Support (10 | 2.1%), Personal Care & Service (9 | 1.9%), and Security & Protection (3 | 0.6%).
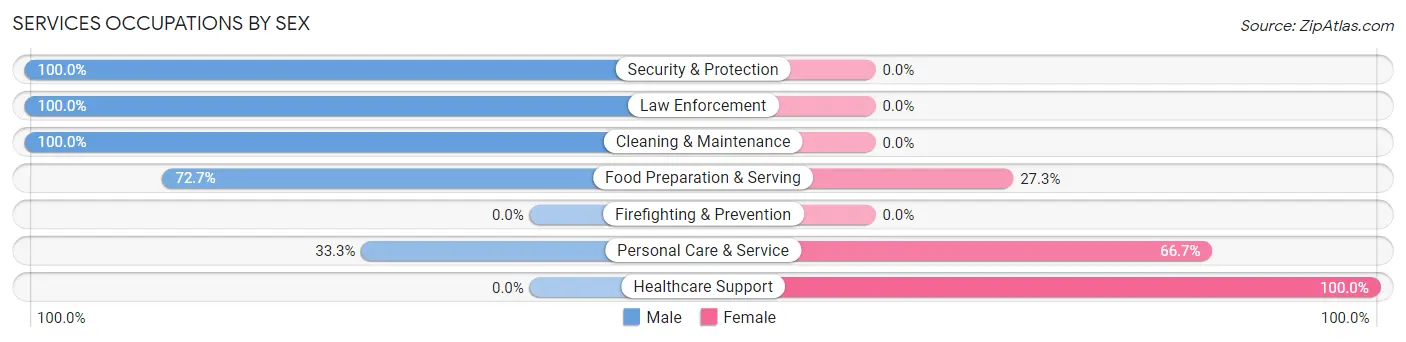
Services Occupations by Sex
Within the Services occupations in Buffalo City, the most male-oriented occupations are Security & Protection (100.0%), Law Enforcement (100.0%), and Cleaning & Maintenance (100.0%), while the most female-oriented occupations are Healthcare Support (100.0%), Personal Care & Service (66.7%), and Food Preparation & Serving (27.3%).
| Occupation | Male | Female |
| Healthcare Support | 0 (0.0%) | 10 (100.0%) |
| Security & Protection | 3 (100.0%) | 0 (0.0%) |
| Firefighting & Prevention | 0 (0.0%) | 0 (0.0%) |
| Law Enforcement | 3 (100.0%) | 0 (0.0%) |
| Food Preparation & Serving | 16 (72.7%) | 6 (27.3%) |
| Cleaning & Maintenance | 25 (100.0%) | 0 (0.0%) |
| Personal Care & Service | 3 (33.3%) | 6 (66.7%) |
| Total (Category) | 47 (68.1%) | 22 (31.9%) |
| Total (Overall) | 265 (55.7%) | 211 (44.3%) |
Sales and Office Occupations
The most common Sales and Office occupations in Buffalo City are Office & Administration (53 | 11.1%), and Sales & Related (40 | 8.4%).

Sales and Office Occupations by Sex

| Occupation | Male | Female |
| Sales & Related | 12 (30.0%) | 28 (70.0%) |
| Office & Administration | 7 (13.2%) | 46 (86.8%) |
| Total (Category) | 19 (20.4%) | 74 (79.6%) |
| Total (Overall) | 265 (55.7%) | 211 (44.3%) |
Natural Resources, Construction and Maintenance Occupations
The most common Natural Resources, Construction and Maintenance occupations in Buffalo City are Construction & Extraction (24 | 5.0%), and Installation, Maintenance & Repair (17 | 3.6%).
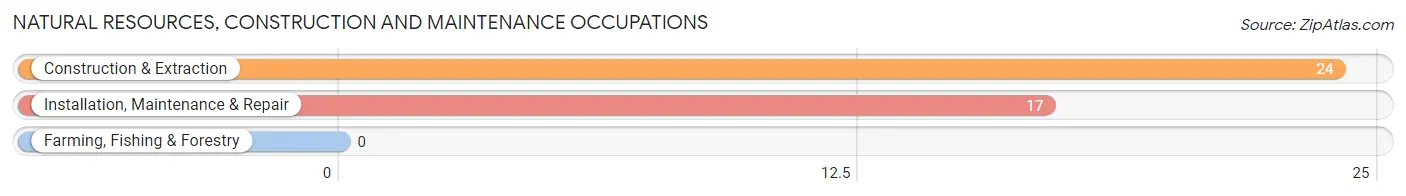
Natural Resources, Construction and Maintenance Occupations by Sex

| Occupation | Male | Female |
| Farming, Fishing & Forestry | 0 (0.0%) | 0 (0.0%) |
| Construction & Extraction | 24 (100.0%) | 0 (0.0%) |
| Installation, Maintenance & Repair | 17 (100.0%) | 0 (0.0%) |
| Total (Category) | 41 (100.0%) | 0 (0.0%) |
| Total (Overall) | 265 (55.7%) | 211 (44.3%) |
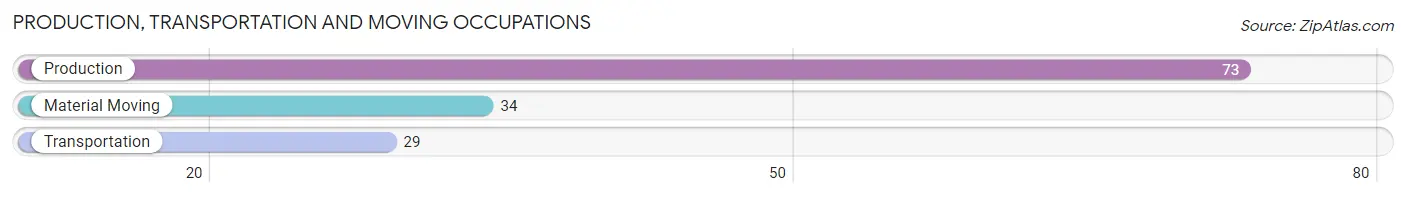
Production, Transportation and Moving Occupations
The most common Production, Transportation and Moving occupations in Buffalo City are Production (73 | 15.3%), Material Moving (34 | 7.1%), and Transportation (29 | 6.1%).
Production, Transportation and Moving Occupations by Sex
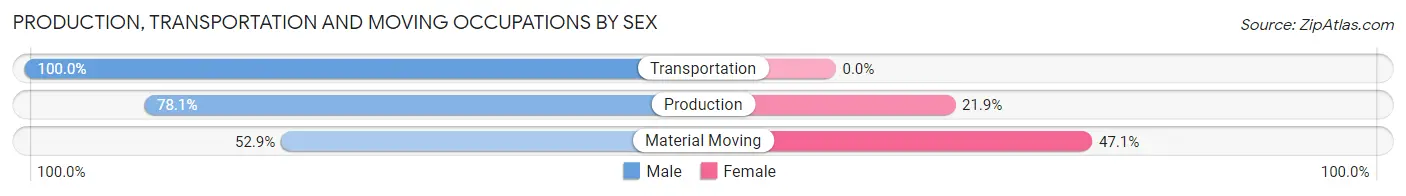
| Occupation | Male | Female |
| Production | 57 (78.1%) | 16 (21.9%) |
| Transportation | 29 (100.0%) | 0 (0.0%) |
| Material Moving | 18 (52.9%) | 16 (47.1%) |
| Total (Category) | 104 (76.5%) | 32 (23.5%) |
| Total (Overall) | 265 (55.7%) | 211 (44.3%) |
Employment Industries by Sex in Buffalo City
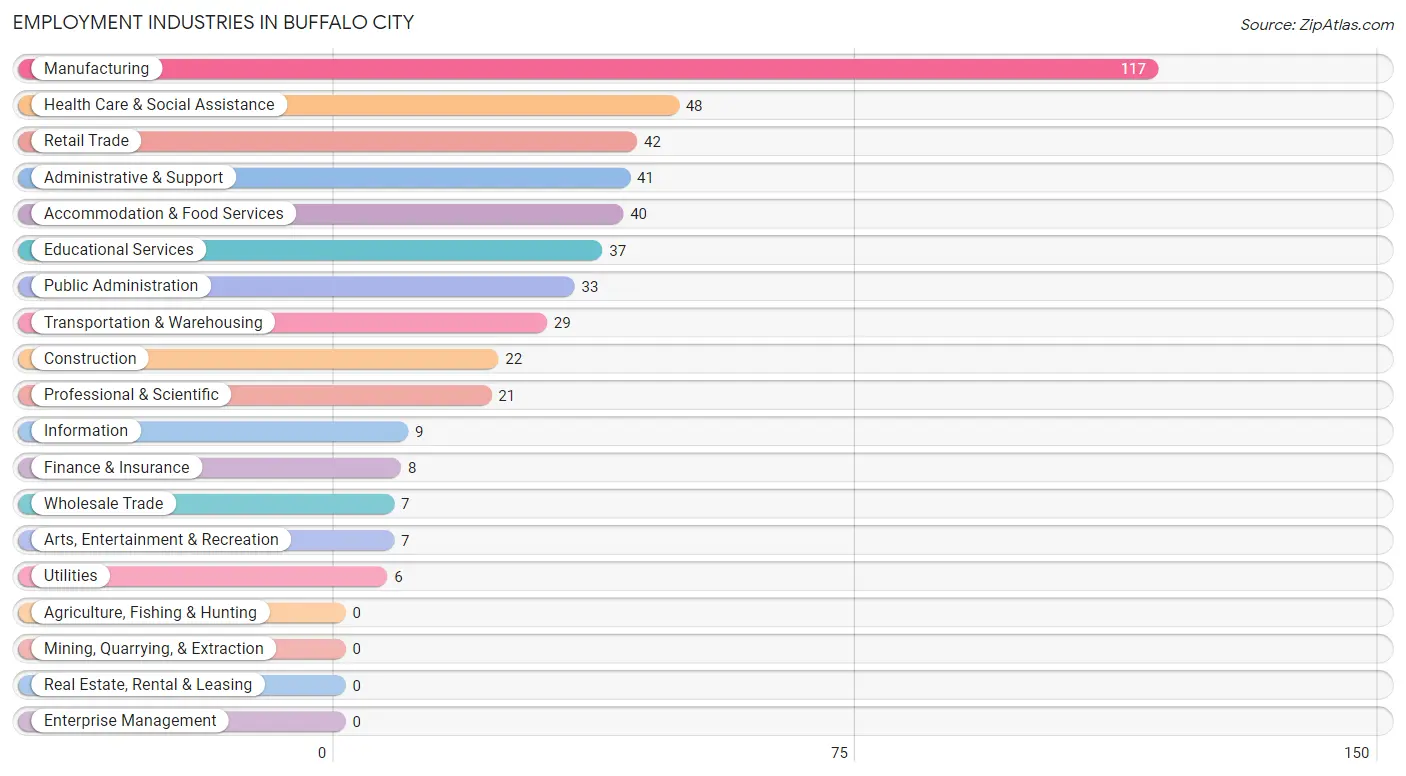
Employment Industries in Buffalo City
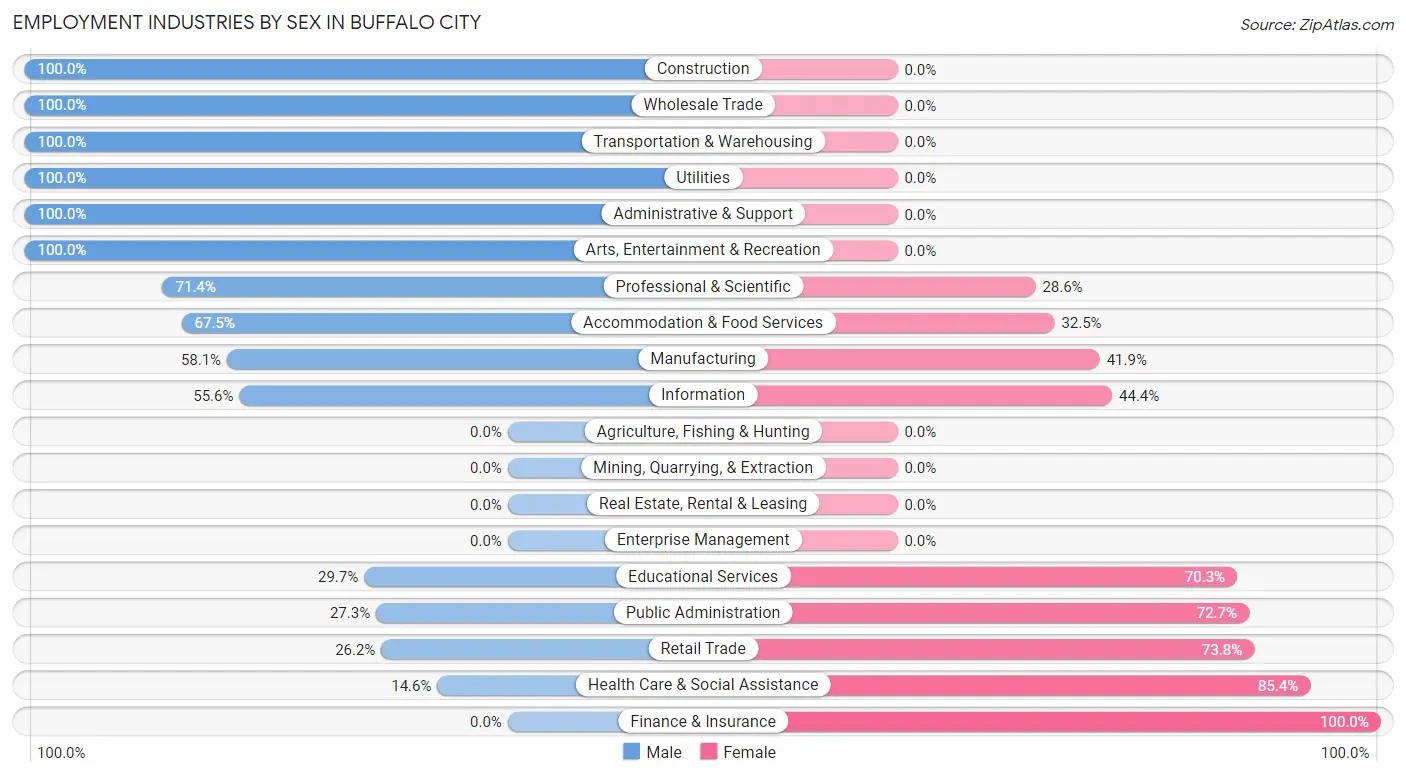
The major employment industries in Buffalo City include Manufacturing (117 | 24.6%), Health Care & Social Assistance (48 | 10.1%), Retail Trade (42 | 8.8%), Administrative & Support (41 | 8.6%), and Accommodation & Food Services (40 | 8.4%).
Employment Industries by Sex in Buffalo City
The Buffalo City industries that see more men than women are Construction (100.0%), Wholesale Trade (100.0%), and Transportation & Warehousing (100.0%), whereas the industries that tend to have a higher number of women are Finance & Insurance (100.0%), Health Care & Social Assistance (85.4%), and Retail Trade (73.8%).
| Industry | Male | Female |
| Agriculture, Fishing & Hunting | 0 (0.0%) | 0 (0.0%) |
| Mining, Quarrying, & Extraction | 0 (0.0%) | 0 (0.0%) |
| Construction | 22 (100.0%) | 0 (0.0%) |
| Manufacturing | 68 (58.1%) | 49 (41.9%) |
| Wholesale Trade | 7 (100.0%) | 0 (0.0%) |
| Retail Trade | 11 (26.2%) | 31 (73.8%) |
| Transportation & Warehousing | 29 (100.0%) | 0 (0.0%) |
| Utilities | 6 (100.0%) | 0 (0.0%) |
| Information | 5 (55.6%) | 4 (44.4%) |
| Finance & Insurance | 0 (0.0%) | 8 (100.0%) |
| Real Estate, Rental & Leasing | 0 (0.0%) | 0 (0.0%) |
| Professional & Scientific | 15 (71.4%) | 6 (28.6%) |
| Enterprise Management | 0 (0.0%) | 0 (0.0%) |
| Administrative & Support | 41 (100.0%) | 0 (0.0%) |
| Educational Services | 11 (29.7%) | 26 (70.3%) |
| Health Care & Social Assistance | 7 (14.6%) | 41 (85.4%) |
| Arts, Entertainment & Recreation | 7 (100.0%) | 0 (0.0%) |
| Accommodation & Food Services | 27 (67.5%) | 13 (32.5%) |
| Public Administration | 9 (27.3%) | 24 (72.7%) |
| Total | 265 (55.7%) | 211 (44.3%) |
Education in Buffalo City
School Enrollment in Buffalo City
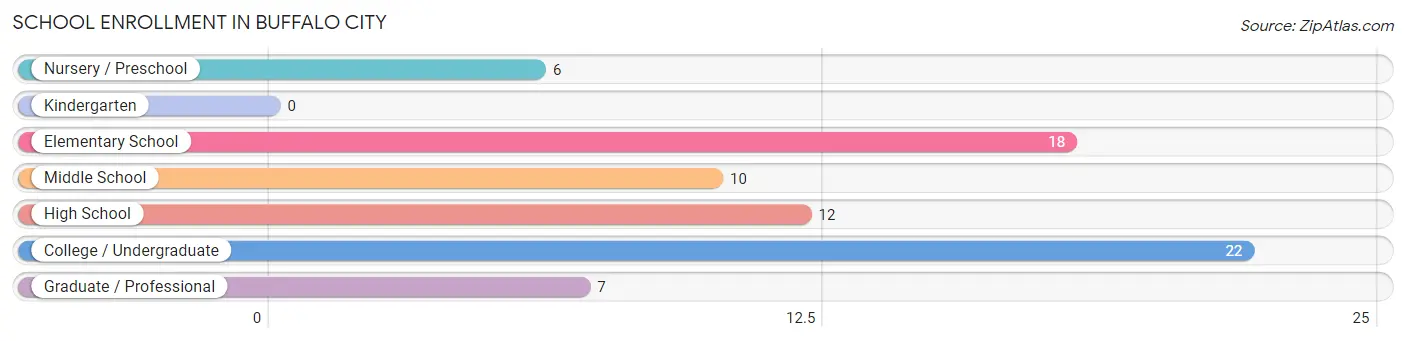
The most common levels of schooling among the 75 students in Buffalo City are college / undergraduate (22 | 29.3%), elementary school (18 | 24.0%), and high school (12 | 16.0%).
| School Level | # Students | % Students |
| Nursery / Preschool | 6 | 8.0% |
| Kindergarten | 0 | 0.0% |
| Elementary School | 18 | 24.0% |
| Middle School | 10 | 13.3% |
| High School | 12 | 16.0% |
| College / Undergraduate | 22 | 29.3% |
| Graduate / Professional | 7 | 9.3% |
| Total | 75 | 100.0% |
School Enrollment by Age by Funding Source in Buffalo City
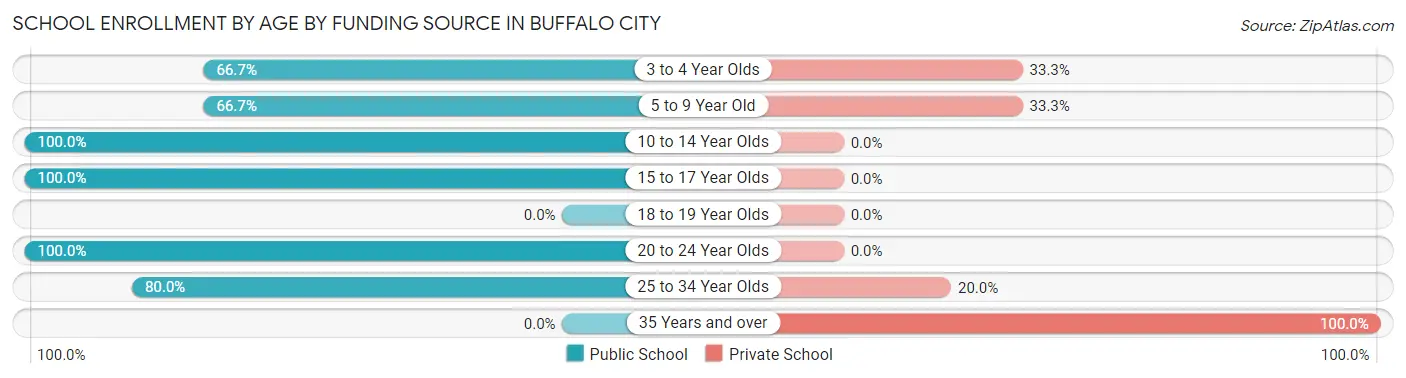
Out of a total of 75 students who are enrolled in schools in Buffalo City, 15 (20.0%) attend a private institution, while the remaining 60 (80.0%) are enrolled in public schools. The age group of 35 years and over has the highest likelihood of being enrolled in private schools, with 3 (100.0% in the age bracket) enrolled. Conversely, the age group of 10 to 14 year olds has the lowest likelihood of being enrolled in a private school, with 13 (100.0% in the age bracket) attending a public institution.
| Age Bracket | Public School | Private School |
| 3 to 4 Year Olds | 4 (66.7%) | 2 (33.3%) |
| 5 to 9 Year Old | 12 (66.7%) | 6 (33.3%) |
| 10 to 14 Year Olds | 13 (100.0%) | 0 (0.0%) |
| 15 to 17 Year Olds | 9 (100.0%) | 0 (0.0%) |
| 18 to 19 Year Olds | 0 (0.0%) | 0 (0.0%) |
| 20 to 24 Year Olds | 6 (100.0%) | 0 (0.0%) |
| 25 to 34 Year Olds | 16 (80.0%) | 4 (20.0%) |
| 35 Years and over | 0 (0.0%) | 3 (100.0%) |
| Total | 60 (80.0%) | 15 (20.0%) |
Educational Attainment by Field of Study in Buffalo City
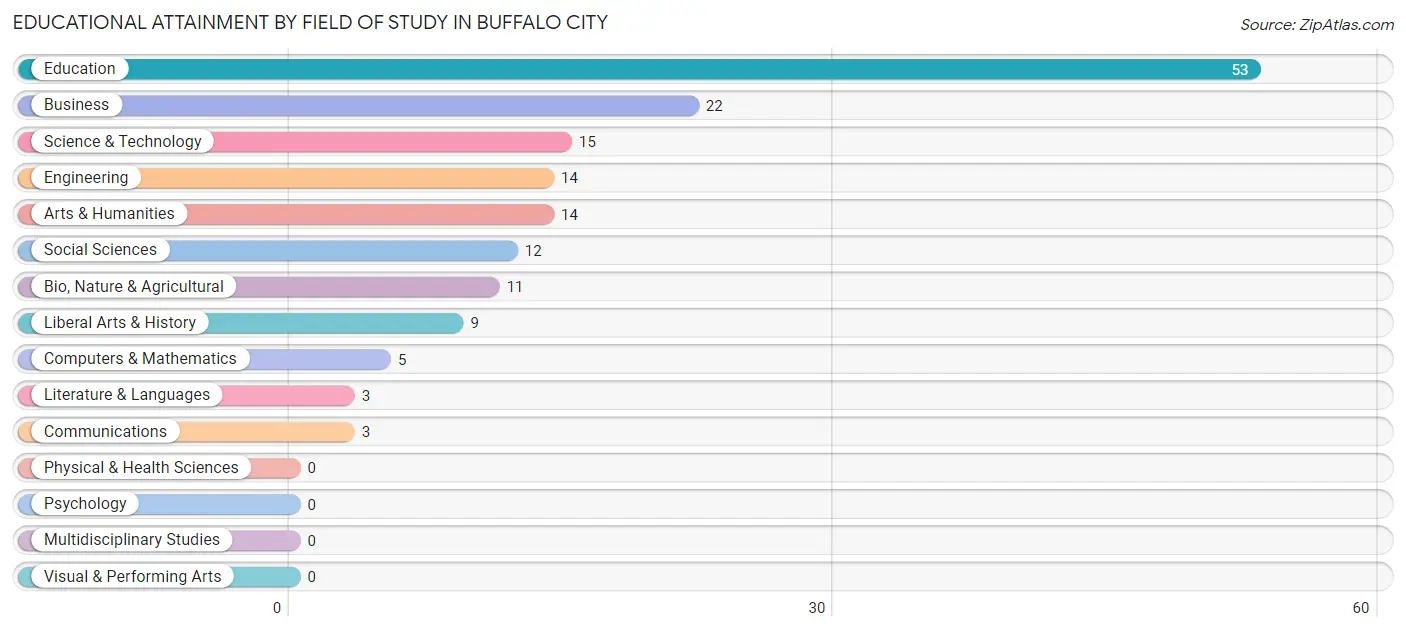
Education (53 | 32.9%), business (22 | 13.7%), science & technology (15 | 9.3%), engineering (14 | 8.7%), and arts & humanities (14 | 8.7%) are the most common fields of study among 161 individuals in Buffalo City who have obtained a bachelor's degree or higher.
| Field of Study | # Graduates | % Graduates |
| Computers & Mathematics | 5 | 3.1% |
| Bio, Nature & Agricultural | 11 | 6.8% |
| Physical & Health Sciences | 0 | 0.0% |
| Psychology | 0 | 0.0% |
| Social Sciences | 12 | 7.4% |
| Engineering | 14 | 8.7% |
| Multidisciplinary Studies | 0 | 0.0% |
| Science & Technology | 15 | 9.3% |
| Business | 22 | 13.7% |
| Education | 53 | 32.9% |
| Literature & Languages | 3 | 1.9% |
| Liberal Arts & History | 9 | 5.6% |
| Visual & Performing Arts | 0 | 0.0% |
| Communications | 3 | 1.9% |
| Arts & Humanities | 14 | 8.7% |
| Total | 161 | 100.0% |
Transportation & Commute in Buffalo City
Vehicle Availability by Sex in Buffalo City
The most prevalent vehicle ownership categories in Buffalo City are males with 2 vehicles (96, accounting for 38.7%) and females with 2 vehicles (79, making up 45.9%).
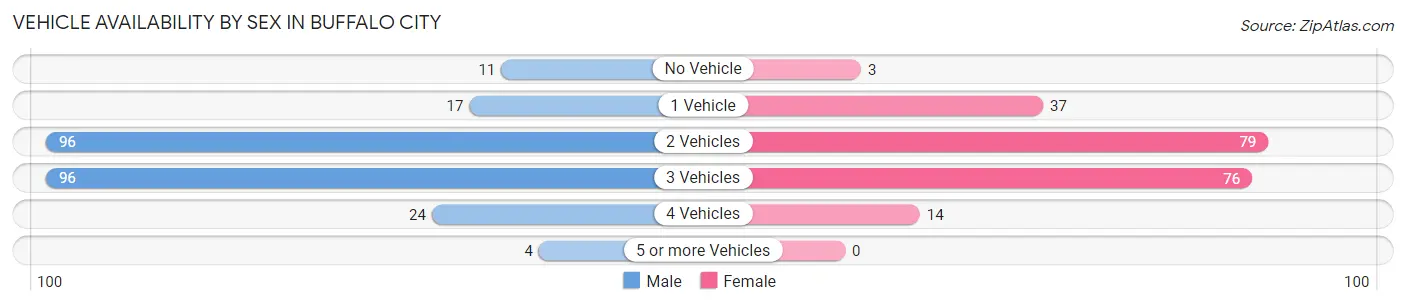
| Vehicles Available | Male | Female |
| No Vehicle | 11 (4.4%) | 3 (1.4%) |
| 1 Vehicle | 17 (6.9%) | 37 (17.7%) |
| 2 Vehicles | 96 (38.7%) | 79 (37.8%) |
| 3 Vehicles | 96 (38.7%) | 76 (36.4%) |
| 4 Vehicles | 24 (9.7%) | 14 (6.7%) |
| 5 or more Vehicles | 4 (1.6%) | 0 (0.0%) |
| Total | 248 (100.0%) | 209 (100.0%) |
Commute Time in Buffalo City
The most frequently occuring commute durations in Buffalo City are 30 to 34 minutes (122 commuters, 28.2%), 10 to 14 minutes (52 commuters, 12.0%), and 15 to 19 minutes (42 commuters, 9.7%).
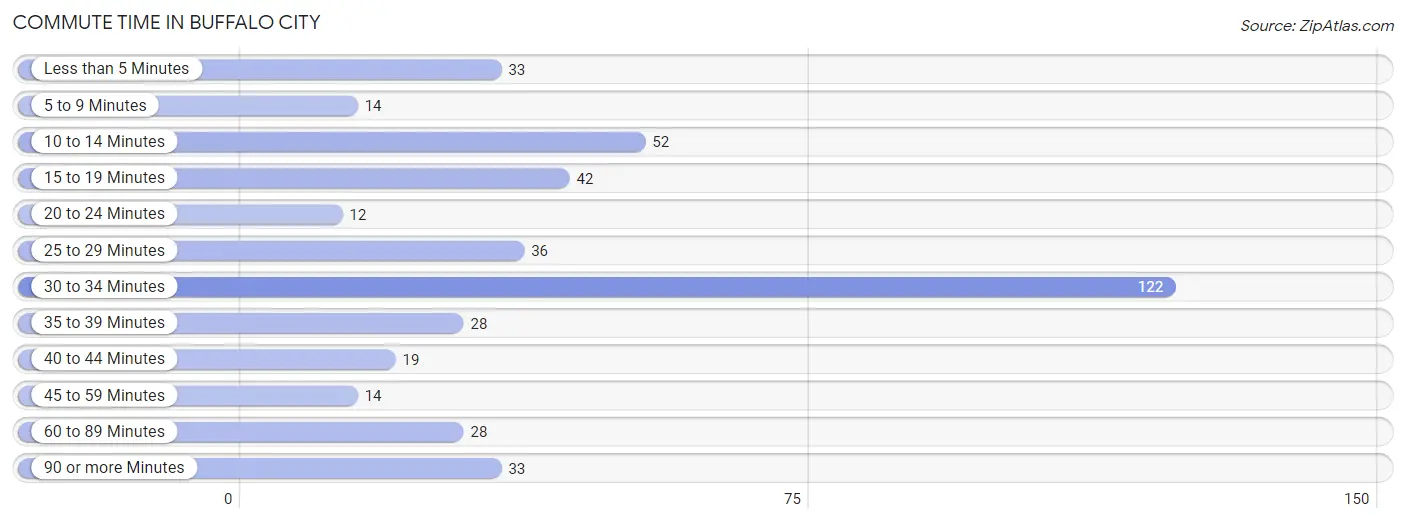
| Commute Time | # Commuters | % Commuters |
| Less than 5 Minutes | 33 | 7.6% |
| 5 to 9 Minutes | 14 | 3.2% |
| 10 to 14 Minutes | 52 | 12.0% |
| 15 to 19 Minutes | 42 | 9.7% |
| 20 to 24 Minutes | 12 | 2.8% |
| 25 to 29 Minutes | 36 | 8.3% |
| 30 to 34 Minutes | 122 | 28.2% |
| 35 to 39 Minutes | 28 | 6.5% |
| 40 to 44 Minutes | 19 | 4.4% |
| 45 to 59 Minutes | 14 | 3.2% |
| 60 to 89 Minutes | 28 | 6.5% |
| 90 or more Minutes | 33 | 7.6% |
Commute Time by Sex in Buffalo City
The most common commute times in Buffalo City are 30 to 34 minutes (59 commuters, 24.9%) for males and 30 to 34 minutes (63 commuters, 32.1%) for females.
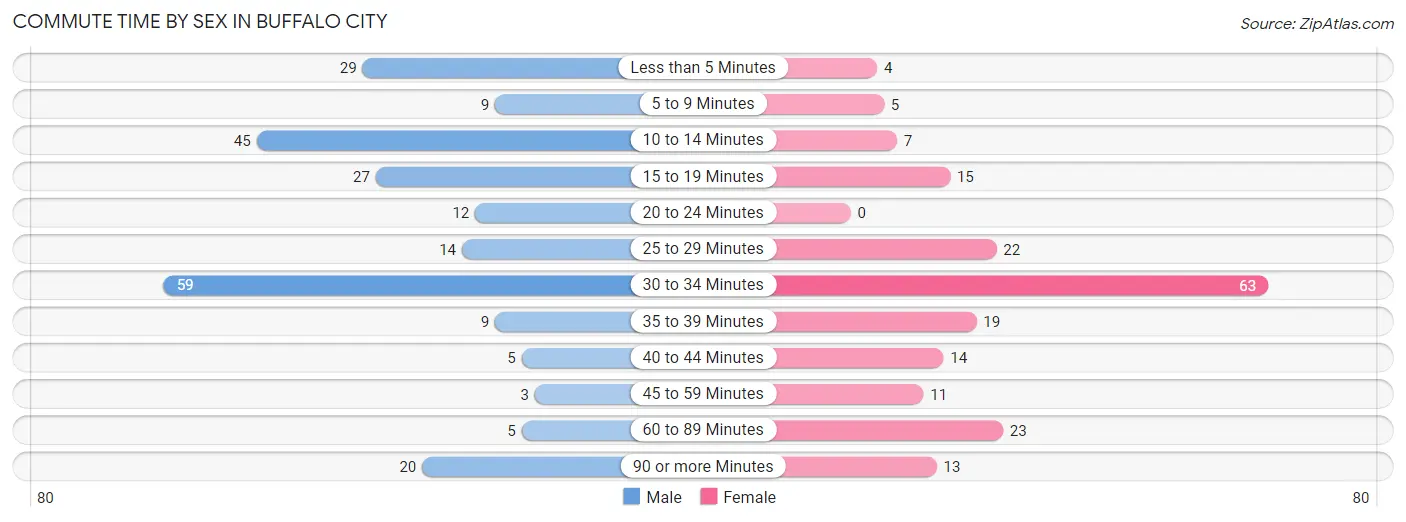
| Commute Time | Male | Female |
| Less than 5 Minutes | 29 (12.2%) | 4 (2.0%) |
| 5 to 9 Minutes | 9 (3.8%) | 5 (2.5%) |
| 10 to 14 Minutes | 45 (19.0%) | 7 (3.6%) |
| 15 to 19 Minutes | 27 (11.4%) | 15 (7.6%) |
| 20 to 24 Minutes | 12 (5.1%) | 0 (0.0%) |
| 25 to 29 Minutes | 14 (5.9%) | 22 (11.2%) |
| 30 to 34 Minutes | 59 (24.9%) | 63 (32.1%) |
| 35 to 39 Minutes | 9 (3.8%) | 19 (9.7%) |
| 40 to 44 Minutes | 5 (2.1%) | 14 (7.1%) |
| 45 to 59 Minutes | 3 (1.3%) | 11 (5.6%) |
| 60 to 89 Minutes | 5 (2.1%) | 23 (11.7%) |
| 90 or more Minutes | 20 (8.4%) | 13 (6.6%) |
Time of Departure to Work by Sex in Buffalo City
The most frequent times of departure to work in Buffalo City are 6:00 AM to 6:29 AM (44, 18.6%) for males and 6:30 AM to 6:59 AM (40, 20.4%) for females.
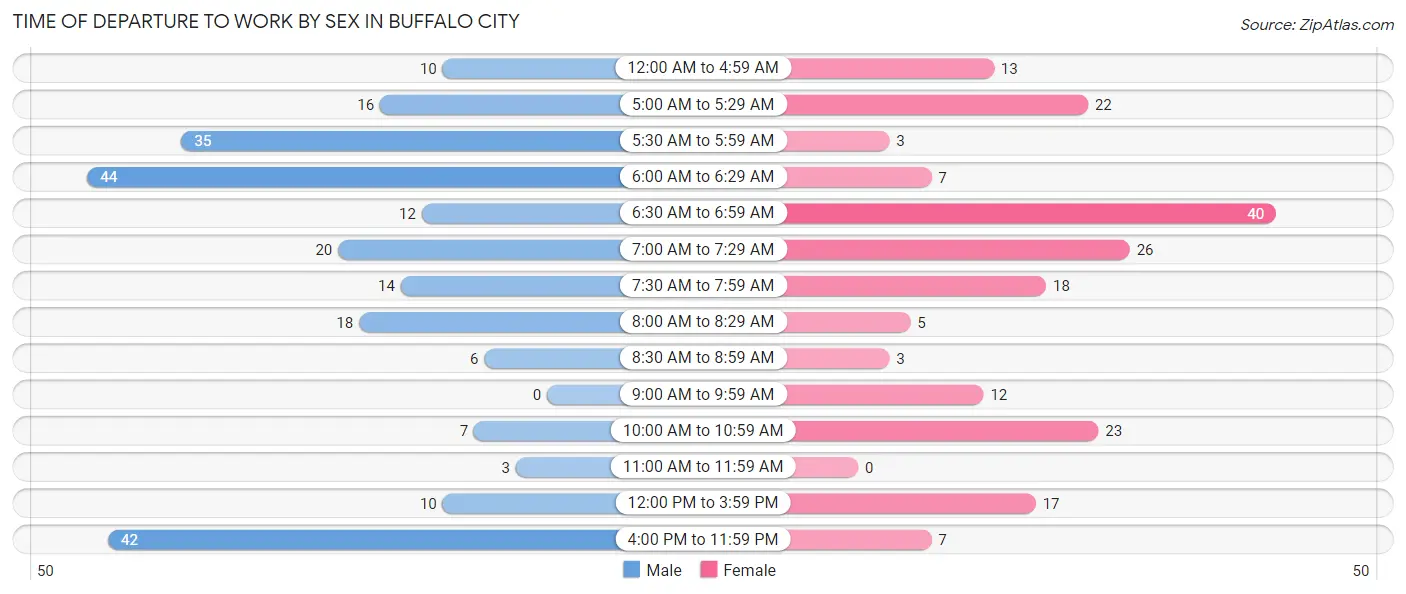
| Time of Departure | Male | Female |
| 12:00 AM to 4:59 AM | 10 (4.2%) | 13 (6.6%) |
| 5:00 AM to 5:29 AM | 16 (6.8%) | 22 (11.2%) |
| 5:30 AM to 5:59 AM | 35 (14.8%) | 3 (1.5%) |
| 6:00 AM to 6:29 AM | 44 (18.6%) | 7 (3.6%) |
| 6:30 AM to 6:59 AM | 12 (5.1%) | 40 (20.4%) |
| 7:00 AM to 7:29 AM | 20 (8.4%) | 26 (13.3%) |
| 7:30 AM to 7:59 AM | 14 (5.9%) | 18 (9.2%) |
| 8:00 AM to 8:29 AM | 18 (7.6%) | 5 (2.5%) |
| 8:30 AM to 8:59 AM | 6 (2.5%) | 3 (1.5%) |
| 9:00 AM to 9:59 AM | 0 (0.0%) | 12 (6.1%) |
| 10:00 AM to 10:59 AM | 7 (2.9%) | 23 (11.7%) |
| 11:00 AM to 11:59 AM | 3 (1.3%) | 0 (0.0%) |
| 12:00 PM to 3:59 PM | 10 (4.2%) | 17 (8.7%) |
| 4:00 PM to 11:59 PM | 42 (17.7%) | 7 (3.6%) |
| Total | 237 (100.0%) | 196 (100.0%) |
Housing Occupancy in Buffalo City
Occupancy by Ownership in Buffalo City
Of the total 432 dwellings in Buffalo City, owner-occupied units account for 398 (92.1%), while renter-occupied units make up 34 (7.9%).
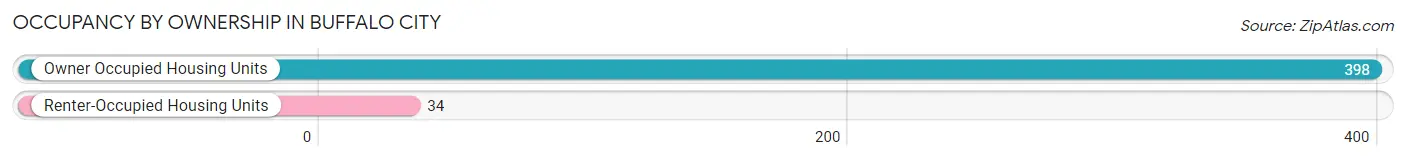
| Occupancy | # Housing Units | % Housing Units |
| Owner Occupied Housing Units | 398 | 92.1% |
| Renter-Occupied Housing Units | 34 | 7.9% |
| Total Occupied Housing Units | 432 | 100.0% |
Occupancy by Household Size in Buffalo City
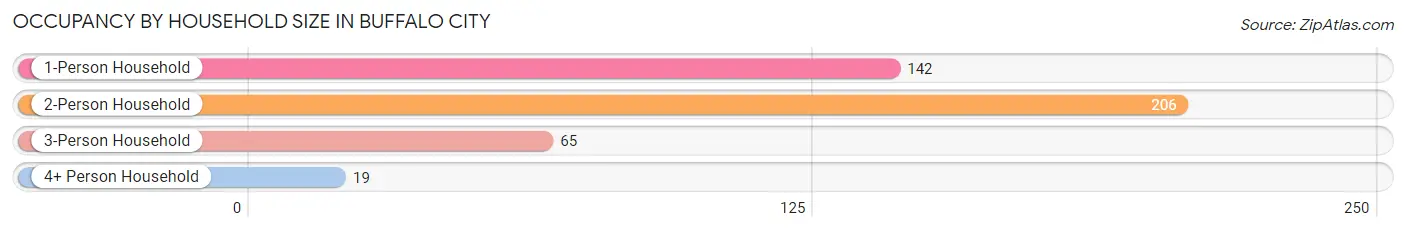
| Household Size | # Housing Units | % Housing Units |
| 1-Person Household | 142 | 32.9% |
| 2-Person Household | 206 | 47.7% |
| 3-Person Household | 65 | 15.0% |
| 4+ Person Household | 19 | 4.4% |
| Total Housing Units | 432 | 100.0% |
Occupancy by Ownership by Household Size in Buffalo City
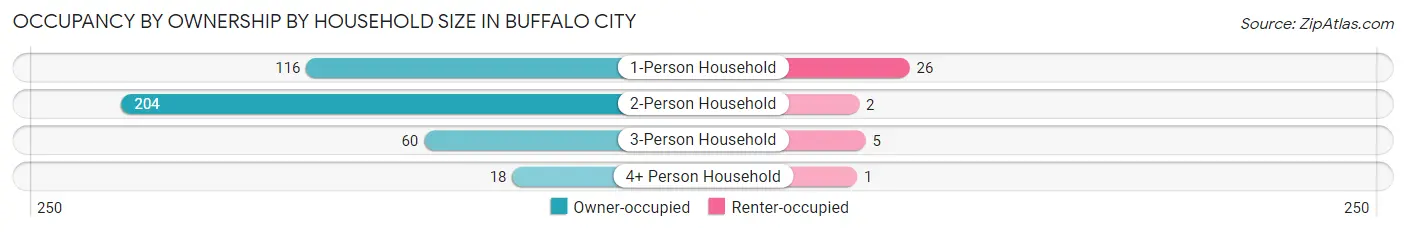
| Household Size | Owner-occupied | Renter-occupied |
| 1-Person Household | 116 (81.7%) | 26 (18.3%) |
| 2-Person Household | 204 (99.0%) | 2 (1.0%) |
| 3-Person Household | 60 (92.3%) | 5 (7.7%) |
| 4+ Person Household | 18 (94.7%) | 1 (5.3%) |
| Total Housing Units | 398 (92.1%) | 34 (7.9%) |
Occupancy by Educational Attainment in Buffalo City
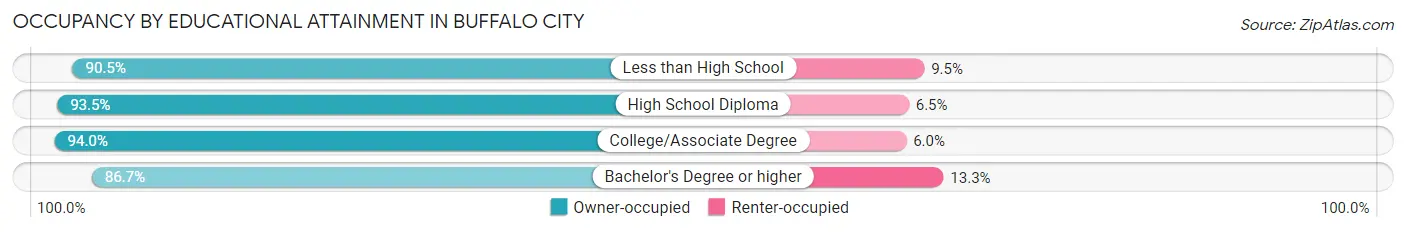
| Household Size | Owner-occupied | Renter-occupied |
| Less than High School | 19 (90.5%) | 2 (9.5%) |
| High School Diploma | 159 (93.5%) | 11 (6.5%) |
| College/Associate Degree | 142 (94.0%) | 9 (6.0%) |
| Bachelor's Degree or higher | 78 (86.7%) | 12 (13.3%) |
Occupancy by Age of Householder in Buffalo City
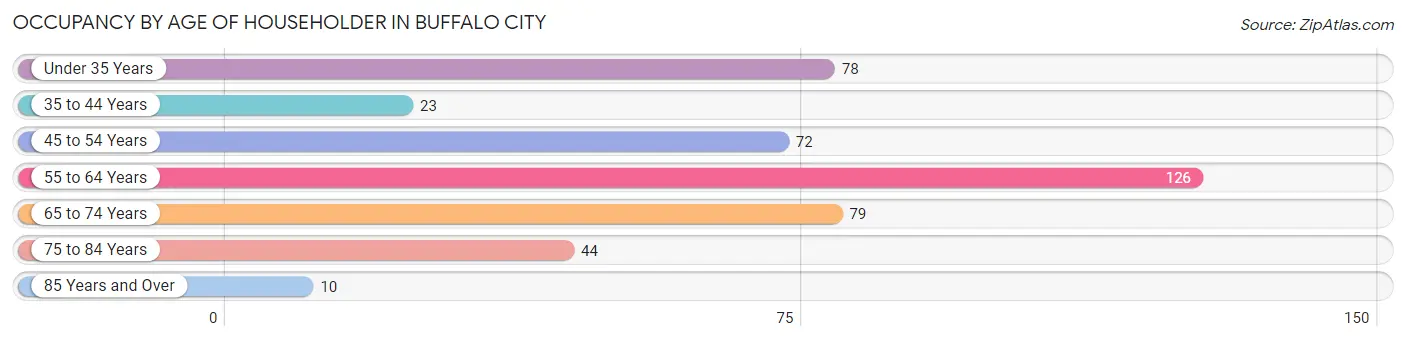
| Age Bracket | # Households | % Households |
| Under 35 Years | 78 | 18.1% |
| 35 to 44 Years | 23 | 5.3% |
| 45 to 54 Years | 72 | 16.7% |
| 55 to 64 Years | 126 | 29.2% |
| 65 to 74 Years | 79 | 18.3% |
| 75 to 84 Years | 44 | 10.2% |
| 85 Years and Over | 10 | 2.3% |
| Total | 432 | 100.0% |
Housing Finances in Buffalo City
Median Income by Occupancy in Buffalo City
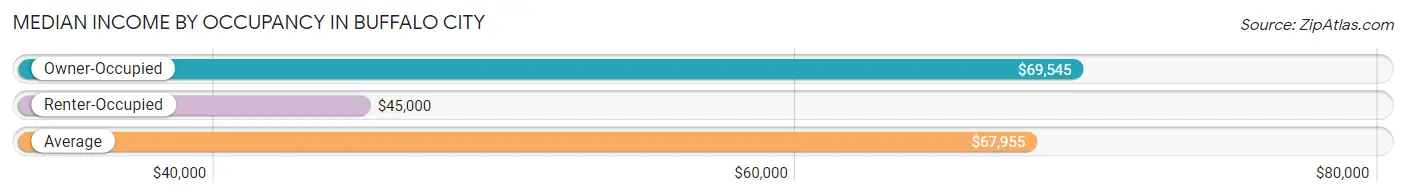
| Occupancy Type | # Households | Median Income |
| Owner-Occupied | 398 (92.1%) | $69,545 |
| Renter-Occupied | 34 (7.9%) | $45,000 |
| Average | 432 (100.0%) | $67,955 |
Occupancy by Householder Income Bracket in Buffalo City
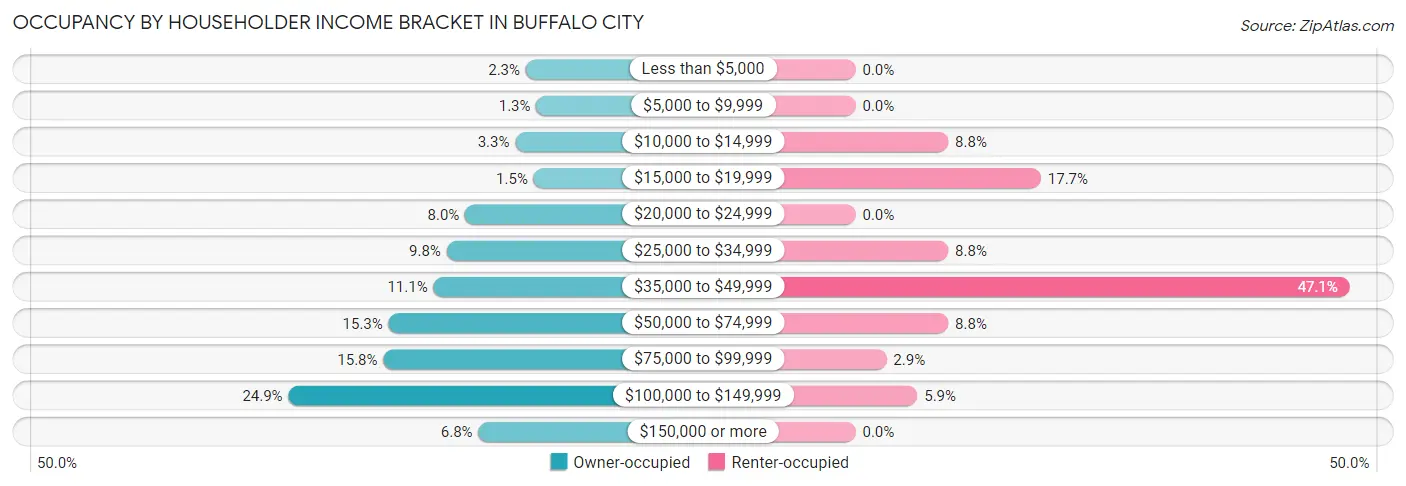
| Income Bracket | Owner-occupied | Renter-occupied |
| Less than $5,000 | 9 (2.3%) | 0 (0.0%) |
| $5,000 to $9,999 | 5 (1.3%) | 0 (0.0%) |
| $10,000 to $14,999 | 13 (3.3%) | 3 (8.8%) |
| $15,000 to $19,999 | 6 (1.5%) | 6 (17.6%) |
| $20,000 to $24,999 | 32 (8.0%) | 0 (0.0%) |
| $25,000 to $34,999 | 39 (9.8%) | 3 (8.8%) |
| $35,000 to $49,999 | 44 (11.1%) | 16 (47.1%) |
| $50,000 to $74,999 | 61 (15.3%) | 3 (8.8%) |
| $75,000 to $99,999 | 63 (15.8%) | 1 (2.9%) |
| $100,000 to $149,999 | 99 (24.9%) | 2 (5.9%) |
| $150,000 or more | 27 (6.8%) | 0 (0.0%) |
| Total | 398 (100.0%) | 34 (100.0%) |
Monthly Housing Cost Tiers in Buffalo City
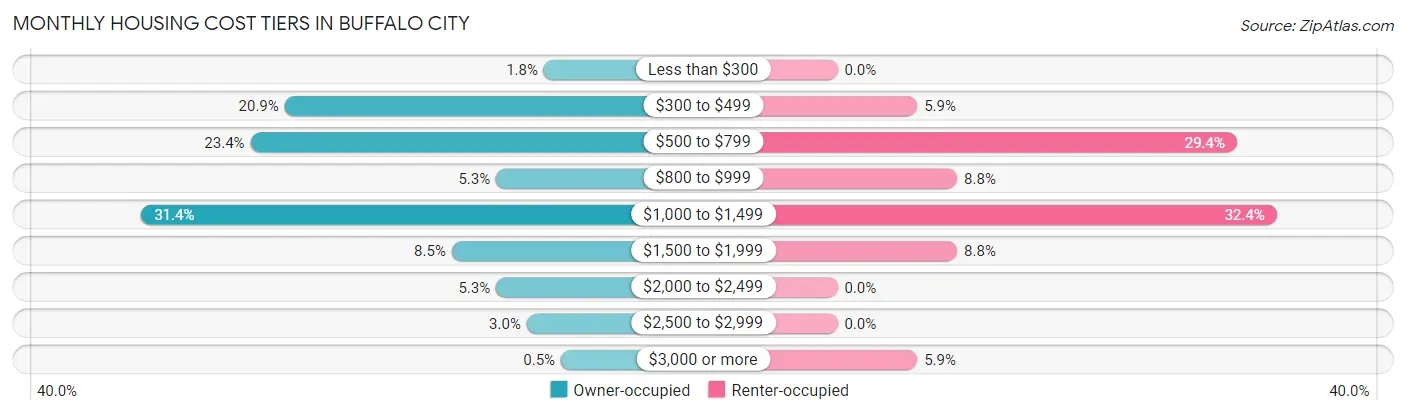
| Monthly Cost | Owner-occupied | Renter-occupied |
| Less than $300 | 7 (1.8%) | 0 (0.0%) |
| $300 to $499 | 83 (20.8%) | 2 (5.9%) |
| $500 to $799 | 93 (23.4%) | 10 (29.4%) |
| $800 to $999 | 21 (5.3%) | 3 (8.8%) |
| $1,000 to $1,499 | 125 (31.4%) | 11 (32.4%) |
| $1,500 to $1,999 | 34 (8.5%) | 3 (8.8%) |
| $2,000 to $2,499 | 21 (5.3%) | 0 (0.0%) |
| $2,500 to $2,999 | 12 (3.0%) | 0 (0.0%) |
| $3,000 or more | 2 (0.5%) | 2 (5.9%) |
| Total | 398 (100.0%) | 34 (100.0%) |
Physical Housing Characteristics in Buffalo City
Housing Structures in Buffalo City
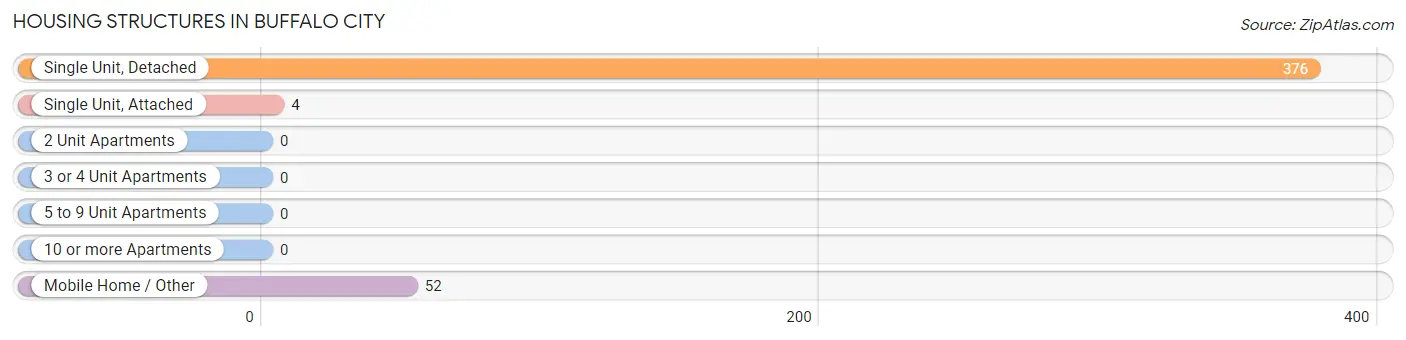
| Structure Type | # Housing Units | % Housing Units |
| Single Unit, Detached | 376 | 87.0% |
| Single Unit, Attached | 4 | 0.9% |
| 2 Unit Apartments | 0 | 0.0% |
| 3 or 4 Unit Apartments | 0 | 0.0% |
| 5 to 9 Unit Apartments | 0 | 0.0% |
| 10 or more Apartments | 0 | 0.0% |
| Mobile Home / Other | 52 | 12.0% |
| Total | 432 | 100.0% |
Housing Structures by Occupancy in Buffalo City
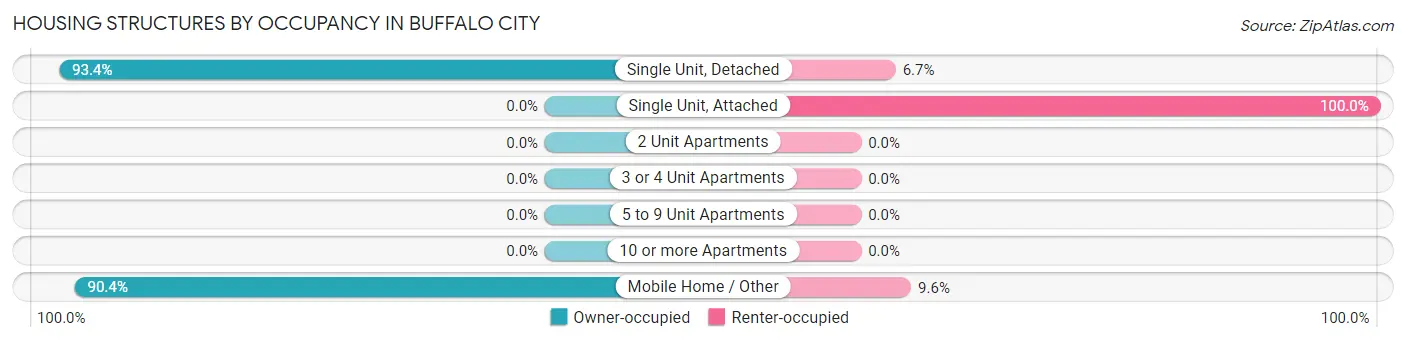
| Structure Type | Owner-occupied | Renter-occupied |
| Single Unit, Detached | 351 (93.3%) | 25 (6.7%) |
| Single Unit, Attached | 0 (0.0%) | 4 (100.0%) |
| 2 Unit Apartments | 0 (0.0%) | 0 (0.0%) |
| 3 or 4 Unit Apartments | 0 (0.0%) | 0 (0.0%) |
| 5 to 9 Unit Apartments | 0 (0.0%) | 0 (0.0%) |
| 10 or more Apartments | 0 (0.0%) | 0 (0.0%) |
| Mobile Home / Other | 47 (90.4%) | 5 (9.6%) |
| Total | 398 (92.1%) | 34 (7.9%) |
Housing Structures by Number of Rooms in Buffalo City
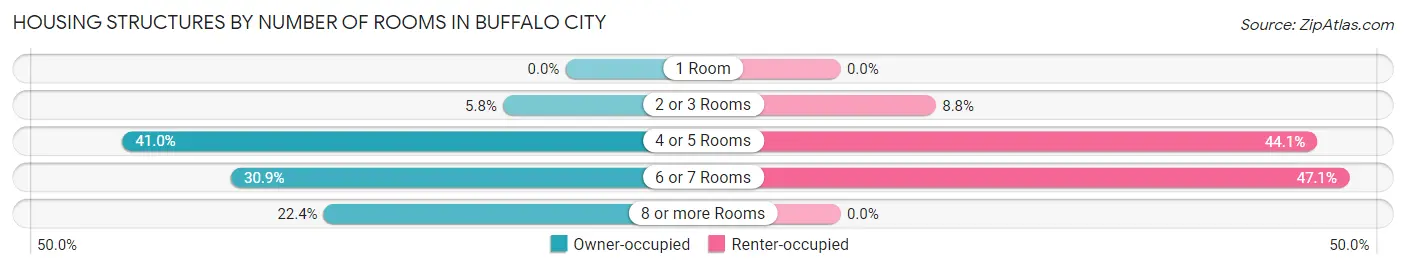
| Number of Rooms | Owner-occupied | Renter-occupied |
| 1 Room | 0 (0.0%) | 0 (0.0%) |
| 2 or 3 Rooms | 23 (5.8%) | 3 (8.8%) |
| 4 or 5 Rooms | 163 (40.9%) | 15 (44.1%) |
| 6 or 7 Rooms | 123 (30.9%) | 16 (47.1%) |
| 8 or more Rooms | 89 (22.4%) | 0 (0.0%) |
| Total | 398 (100.0%) | 34 (100.0%) |
Housing Structure by Heating Type in Buffalo City
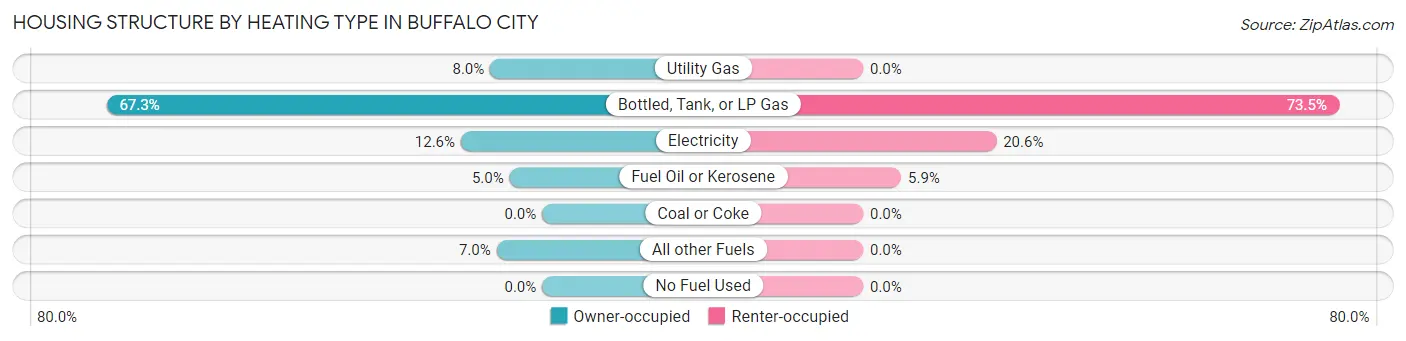
| Heating Type | Owner-occupied | Renter-occupied |
| Utility Gas | 32 (8.0%) | 0 (0.0%) |
| Bottled, Tank, or LP Gas | 268 (67.3%) | 25 (73.5%) |
| Electricity | 50 (12.6%) | 7 (20.6%) |
| Fuel Oil or Kerosene | 20 (5.0%) | 2 (5.9%) |
| Coal or Coke | 0 (0.0%) | 0 (0.0%) |
| All other Fuels | 28 (7.0%) | 0 (0.0%) |
| No Fuel Used | 0 (0.0%) | 0 (0.0%) |
| Total | 398 (100.0%) | 34 (100.0%) |
Household Vehicle Usage in Buffalo City
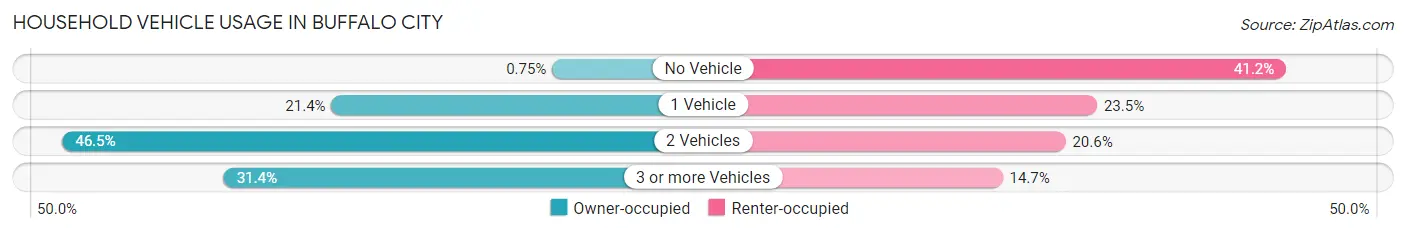
| Vehicles per Household | Owner-occupied | Renter-occupied |
| No Vehicle | 3 (0.7%) | 14 (41.2%) |
| 1 Vehicle | 85 (21.4%) | 8 (23.5%) |
| 2 Vehicles | 185 (46.5%) | 7 (20.6%) |
| 3 or more Vehicles | 125 (31.4%) | 5 (14.7%) |
| Total | 398 (100.0%) | 34 (100.0%) |
Real Estate & Mortgages in Buffalo City
Real Estate and Mortgage Overview in Buffalo City
| Characteristic | Without Mortgage | With Mortgage |
| Housing Units | 166 | 232 |
| Median Property Value | $171,600 | $177,700 |
| Median Household Income | $59,286 | $19 |
| Monthly Housing Costs | $496 | $2 |
| Real Estate Taxes | $2,741 | $6 |
Property Value by Mortgage Status in Buffalo City
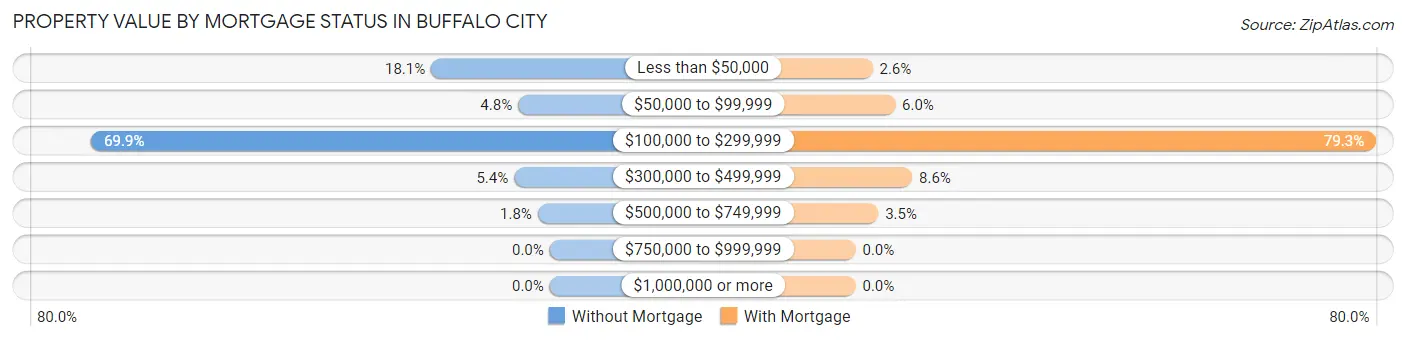
| Property Value | Without Mortgage | With Mortgage |
| Less than $50,000 | 30 (18.1%) | 6 (2.6%) |
| $50,000 to $99,999 | 8 (4.8%) | 14 (6.0%) |
| $100,000 to $299,999 | 116 (69.9%) | 184 (79.3%) |
| $300,000 to $499,999 | 9 (5.4%) | 20 (8.6%) |
| $500,000 to $749,999 | 3 (1.8%) | 8 (3.5%) |
| $750,000 to $999,999 | 0 (0.0%) | 0 (0.0%) |
| $1,000,000 or more | 0 (0.0%) | 0 (0.0%) |
| Total | 166 (100.0%) | 232 (100.0%) |
Household Income by Mortgage Status in Buffalo City
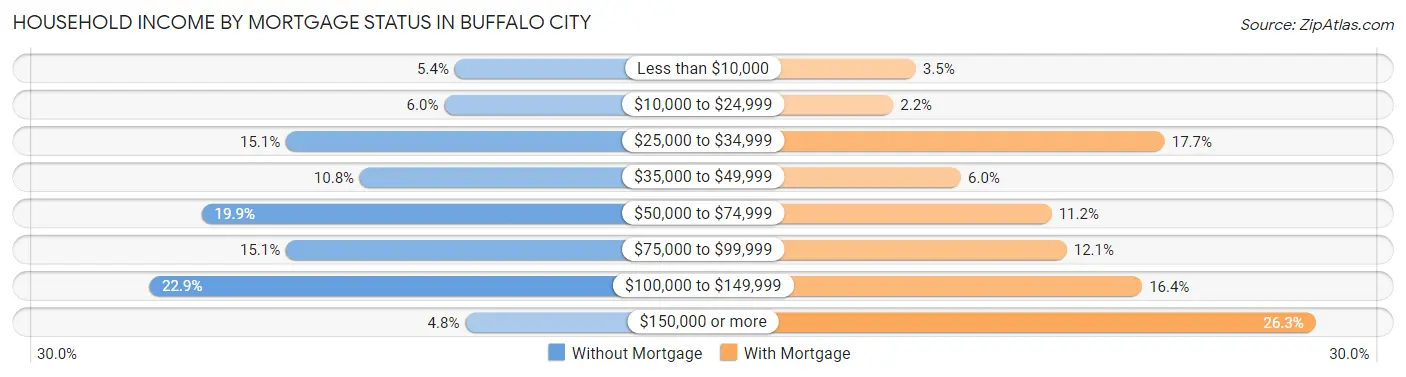
| Household Income | Without Mortgage | With Mortgage |
| Less than $10,000 | 9 (5.4%) | 8 (3.5%) |
| $10,000 to $24,999 | 10 (6.0%) | 5 (2.2%) |
| $25,000 to $34,999 | 25 (15.1%) | 41 (17.7%) |
| $35,000 to $49,999 | 18 (10.8%) | 14 (6.0%) |
| $50,000 to $74,999 | 33 (19.9%) | 26 (11.2%) |
| $75,000 to $99,999 | 25 (15.1%) | 28 (12.1%) |
| $100,000 to $149,999 | 38 (22.9%) | 38 (16.4%) |
| $150,000 or more | 8 (4.8%) | 61 (26.3%) |
| Total | 166 (100.0%) | 232 (100.0%) |
Property Value to Household Income Ratio in Buffalo City
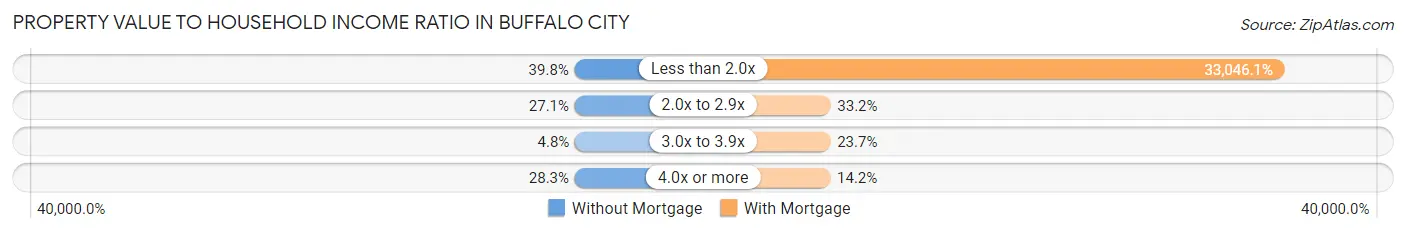
| Value-to-Income Ratio | Without Mortgage | With Mortgage |
| Less than 2.0x | 66 (39.8%) | 76,667 (33,046.1%) |
| 2.0x to 2.9x | 45 (27.1%) | 77 (33.2%) |
| 3.0x to 3.9x | 8 (4.8%) | 55 (23.7%) |
| 4.0x or more | 47 (28.3%) | 33 (14.2%) |
| Total | 166 (100.0%) | 232 (100.0%) |
Real Estate Taxes by Mortgage Status in Buffalo City
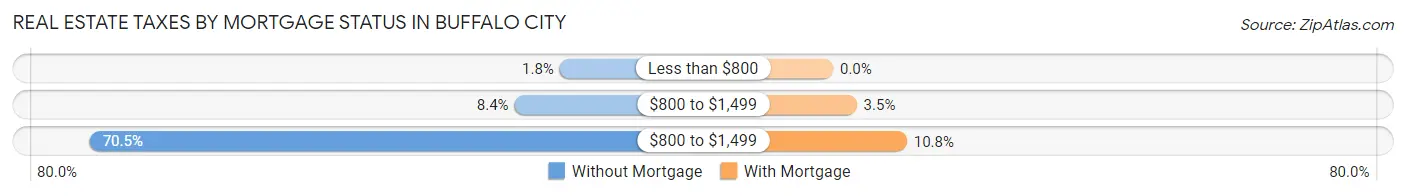
| Property Taxes | Without Mortgage | With Mortgage |
| Less than $800 | 3 (1.8%) | 0 (0.0%) |
| $800 to $1,499 | 14 (8.4%) | 8 (3.5%) |
| $800 to $1,499 | 117 (70.5%) | 25 (10.8%) |
| Total | 166 (100.0%) | 232 (100.0%) |
Health & Disability in Buffalo City
Health Insurance Coverage by Age in Buffalo City
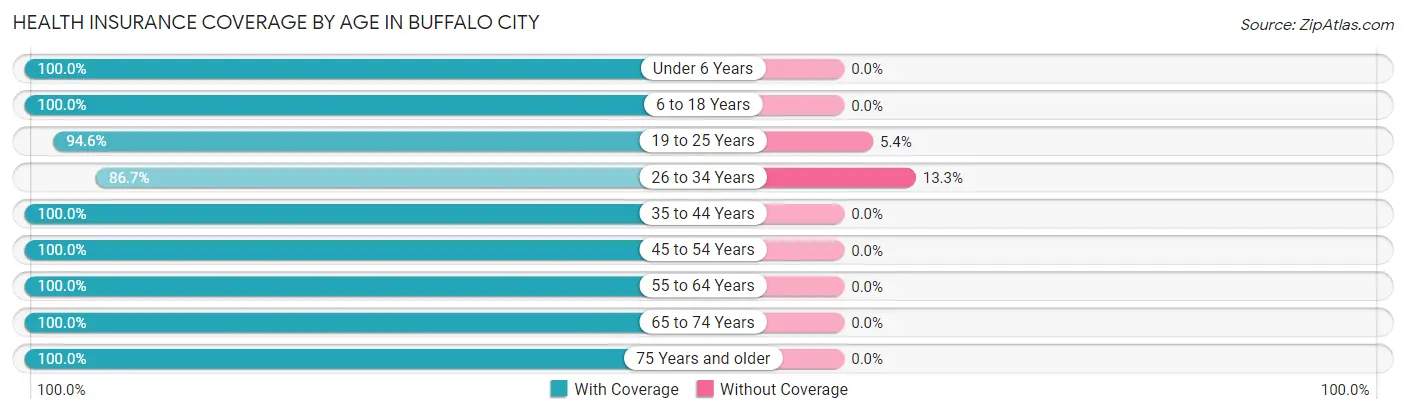
| Age Bracket | With Coverage | Without Coverage |
| Under 6 Years | 34 (100.0%) | 0 (0.0%) |
| 6 to 18 Years | 40 (100.0%) | 0 (0.0%) |
| 19 to 25 Years | 53 (94.6%) | 3 (5.4%) |
| 26 to 34 Years | 104 (86.7%) | 16 (13.3%) |
| 35 to 44 Years | 53 (100.0%) | 0 (0.0%) |
| 45 to 54 Years | 103 (100.0%) | 0 (0.0%) |
| 55 to 64 Years | 188 (100.0%) | 0 (0.0%) |
| 65 to 74 Years | 162 (100.0%) | 0 (0.0%) |
| 75 Years and older | 79 (100.0%) | 0 (0.0%) |
| Total | 816 (97.7%) | 19 (2.3%) |
Health Insurance Coverage by Citizenship Status in Buffalo City

| Citizenship Status | With Coverage | Without Coverage |
| Native Born | 34 (100.0%) | 0 (0.0%) |
| Foreign Born, Citizen | 40 (100.0%) | 0 (0.0%) |
| Foreign Born, not a Citizen | 53 (94.6%) | 3 (5.4%) |
Health Insurance Coverage by Household Income in Buffalo City
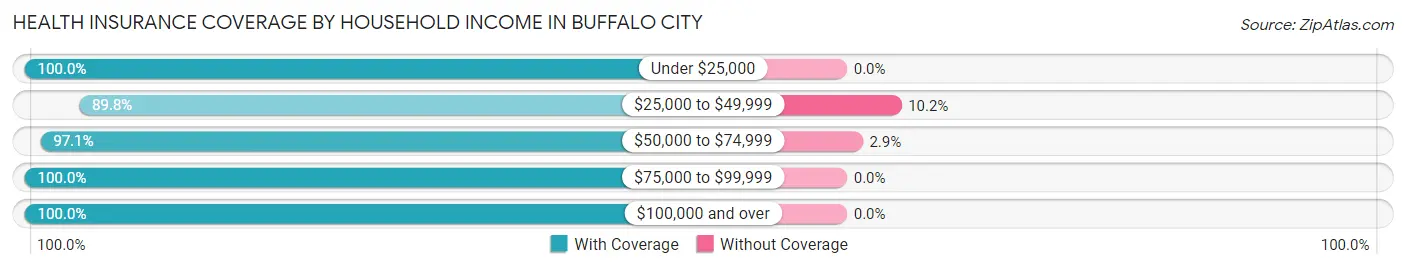
| Household Income | With Coverage | Without Coverage |
| Under $25,000 | 110 (100.0%) | 0 (0.0%) |
| $25,000 to $49,999 | 141 (89.8%) | 16 (10.2%) |
| $50,000 to $74,999 | 99 (97.1%) | 3 (2.9%) |
| $75,000 to $99,999 | 139 (100.0%) | 0 (0.0%) |
| $100,000 and over | 327 (100.0%) | 0 (0.0%) |
Public vs Private Health Insurance Coverage by Age in Buffalo City
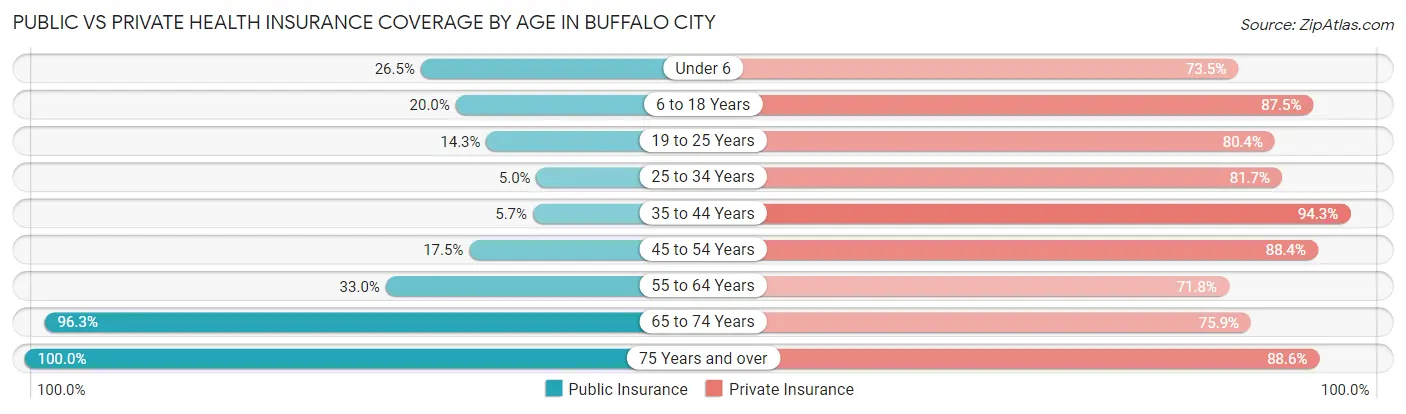
| Age Bracket | Public Insurance | Private Insurance |
| Under 6 | 9 (26.5%) | 25 (73.5%) |
| 6 to 18 Years | 8 (20.0%) | 35 (87.5%) |
| 19 to 25 Years | 8 (14.3%) | 45 (80.4%) |
| 25 to 34 Years | 6 (5.0%) | 98 (81.7%) |
| 35 to 44 Years | 3 (5.7%) | 50 (94.3%) |
| 45 to 54 Years | 18 (17.5%) | 91 (88.3%) |
| 55 to 64 Years | 62 (33.0%) | 135 (71.8%) |
| 65 to 74 Years | 156 (96.3%) | 123 (75.9%) |
| 75 Years and over | 79 (100.0%) | 70 (88.6%) |
| Total | 349 (41.8%) | 672 (80.5%) |
Disability Status by Sex by Age in Buffalo City
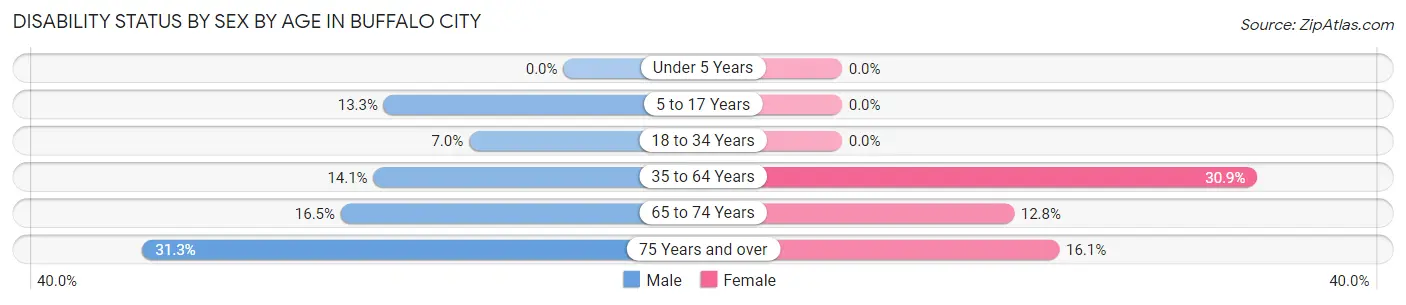
| Age Bracket | Male | Female |
| Under 5 Years | 0 (0.0%) | 0 (0.0%) |
| 5 to 17 Years | 2 (13.3%) | 0 (0.0%) |
| 18 to 34 Years | 7 (7.0%) | 0 (0.0%) |
| 35 to 64 Years | 22 (14.1%) | 58 (30.8%) |
| 65 to 74 Years | 19 (16.5%) | 6 (12.8%) |
| 75 Years and over | 15 (31.2%) | 5 (16.1%) |
Disability Class by Sex by Age in Buffalo City
Disability Class: Hearing Difficulty
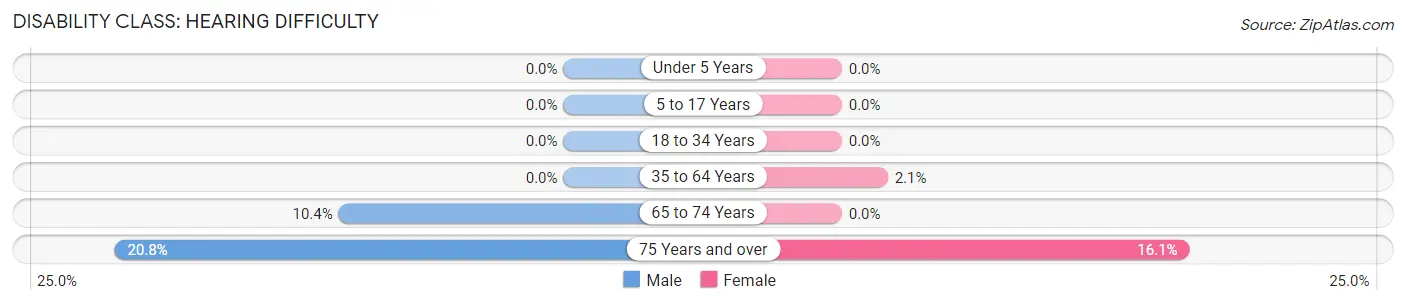
| Age Bracket | Male | Female |
| Under 5 Years | 0 (0.0%) | 0 (0.0%) |
| 5 to 17 Years | 0 (0.0%) | 0 (0.0%) |
| 18 to 34 Years | 0 (0.0%) | 0 (0.0%) |
| 35 to 64 Years | 0 (0.0%) | 4 (2.1%) |
| 65 to 74 Years | 12 (10.4%) | 0 (0.0%) |
| 75 Years and over | 10 (20.8%) | 5 (16.1%) |
Disability Class: Vision Difficulty
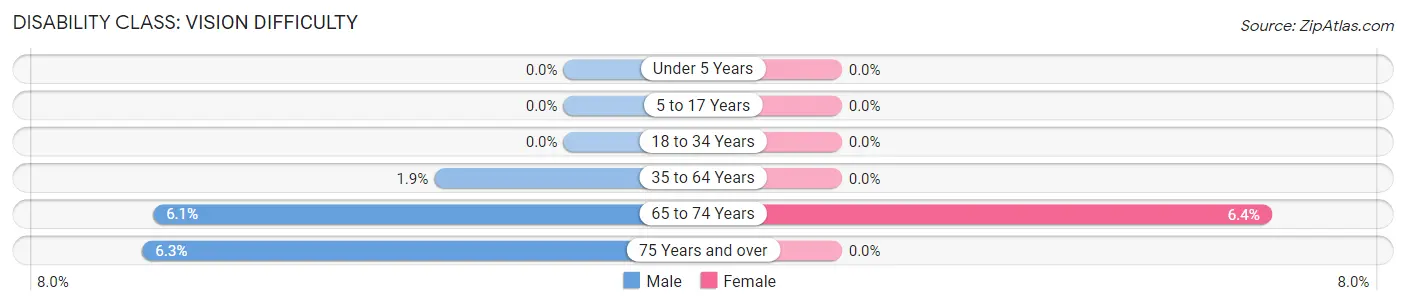
| Age Bracket | Male | Female |
| Under 5 Years | 0 (0.0%) | 0 (0.0%) |
| 5 to 17 Years | 0 (0.0%) | 0 (0.0%) |
| 18 to 34 Years | 0 (0.0%) | 0 (0.0%) |
| 35 to 64 Years | 3 (1.9%) | 0 (0.0%) |
| 65 to 74 Years | 7 (6.1%) | 3 (6.4%) |
| 75 Years and over | 3 (6.2%) | 0 (0.0%) |
Disability Class: Cognitive Difficulty
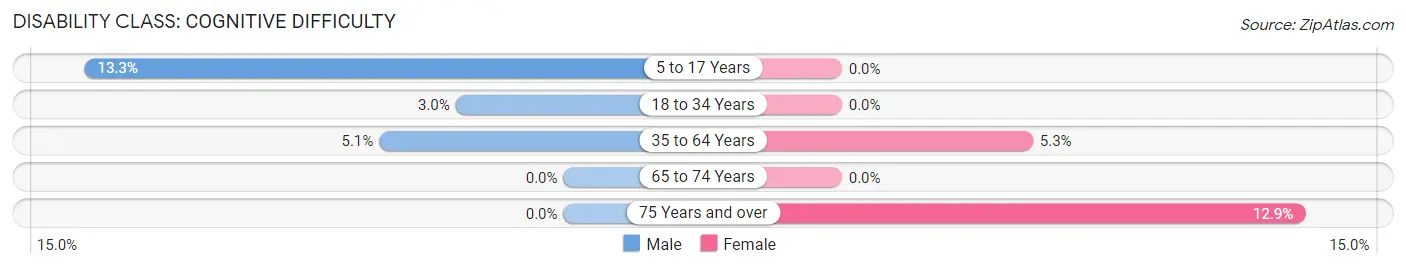
| Age Bracket | Male | Female |
| 5 to 17 Years | 2 (13.3%) | 0 (0.0%) |
| 18 to 34 Years | 3 (3.0%) | 0 (0.0%) |
| 35 to 64 Years | 8 (5.1%) | 10 (5.3%) |
| 65 to 74 Years | 0 (0.0%) | 0 (0.0%) |
| 75 Years and over | 0 (0.0%) | 4 (12.9%) |
Disability Class: Ambulatory Difficulty
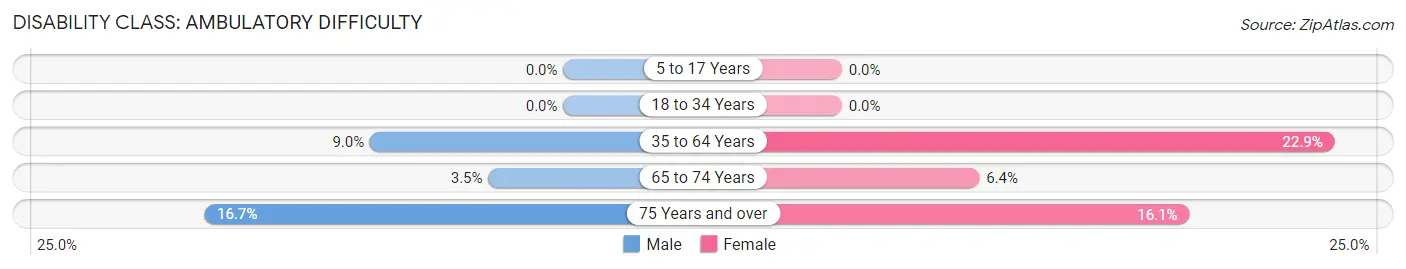
| Age Bracket | Male | Female |
| 5 to 17 Years | 0 (0.0%) | 0 (0.0%) |
| 18 to 34 Years | 0 (0.0%) | 0 (0.0%) |
| 35 to 64 Years | 14 (9.0%) | 43 (22.9%) |
| 65 to 74 Years | 4 (3.5%) | 3 (6.4%) |
| 75 Years and over | 8 (16.7%) | 5 (16.1%) |
Disability Class: Self-Care Difficulty
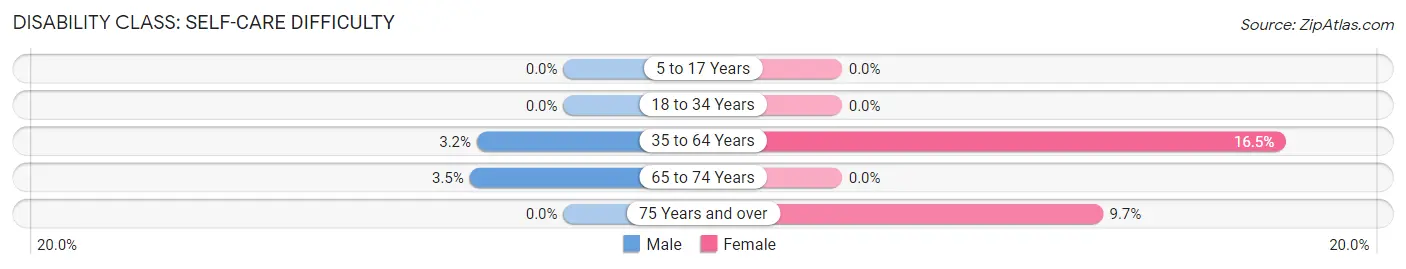
| Age Bracket | Male | Female |
| 5 to 17 Years | 0 (0.0%) | 0 (0.0%) |
| 18 to 34 Years | 0 (0.0%) | 0 (0.0%) |
| 35 to 64 Years | 5 (3.2%) | 31 (16.5%) |
| 65 to 74 Years | 4 (3.5%) | 0 (0.0%) |
| 75 Years and over | 0 (0.0%) | 3 (9.7%) |
Technology Access in Buffalo City
Computing Device Access in Buffalo City
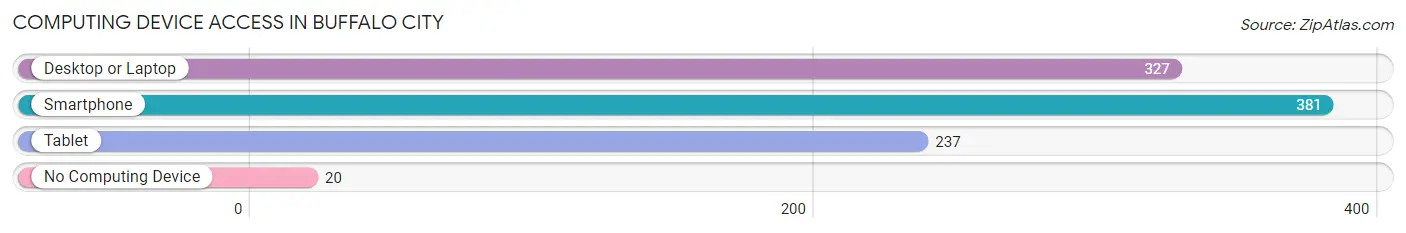
| Device Type | # Households | % Households |
| Desktop or Laptop | 327 | 75.7% |
| Smartphone | 381 | 88.2% |
| Tablet | 237 | 54.9% |
| No Computing Device | 20 | 4.6% |
| Total | 432 | 100.0% |
Internet Access in Buffalo City
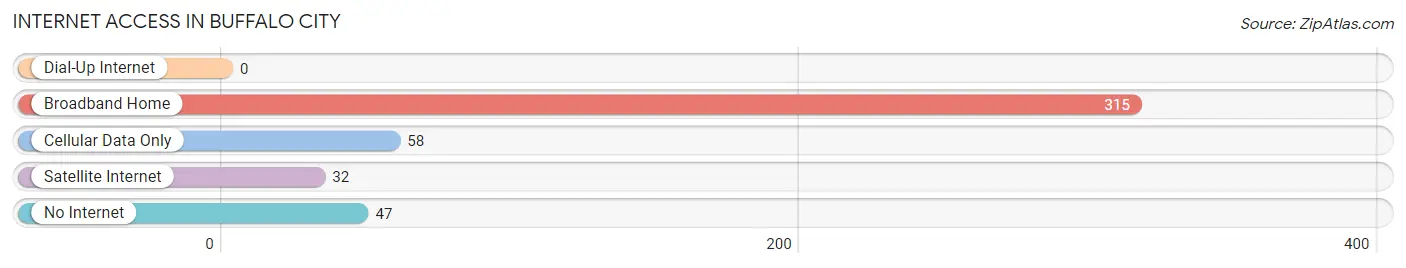
| Internet Type | # Households | % Households |
| Dial-Up Internet | 0 | 0.0% |
| Broadband Home | 315 | 72.9% |
| Cellular Data Only | 58 | 13.4% |
| Satellite Internet | 32 | 7.4% |
| No Internet | 47 | 10.9% |
| Total | 432 | 100.0% |
Buffalo City Summary
Buffalo City is a small city located in Buffalo County, Wisconsin. It is situated on the banks of the Mississippi River, just south of the city of La Crosse. The city has a population of approximately 1,500 people and is the county seat of Buffalo County.
History
Buffalo City was founded in 1854 by a group of settlers from Buffalo, New York. The city was named after the nearby Buffalo River, which was named after the American bison that once roamed the area. The city was incorporated in 1856 and was the first city in Buffalo County.
In the late 19th century, Buffalo City was a thriving river port and a major center for the lumber industry. The city was also home to several manufacturing plants, including a flour mill, a sawmill, and a paper mill.
In the early 20th century, the city experienced a period of decline as the lumber industry moved away and the river port became less important. However, the city was able to rebound in the mid-20th century with the development of tourism and the growth of the local economy.
Geography
Buffalo City is located in the southeastern corner of Buffalo County, Wisconsin. It is situated on the banks of the Mississippi River, just south of the city of La Crosse. The city is surrounded by rolling hills and is located in a region of the state known as the Driftless Area.
The city has a total area of 1.3 square miles, all of which is land. The city is located at an elevation of 645 feet above sea level.
Economy
The economy of Buffalo City is largely based on tourism and the service industry. The city is home to several restaurants, bars, and other businesses that cater to tourists. The city is also home to several manufacturing plants, including a flour mill, a sawmill, and a paper mill.
The city is also home to several educational institutions, including the University of Wisconsin-La Crosse and Western Technical College.
Demographics
As of the 2010 census, the population of Buffalo City was 1,521. The racial makeup of the city was 97.2% White, 0.7% African American, 0.3% Native American, 0.3% Asian, 0.2% from other races, and 1.5% from two or more races. Hispanic or Latino of any race were 1.2% of the population.
The median income for a household in the city was $37,500, and the median income for a family was $45,000. The per capita income for the city was $19,845. About 11.2% of families and 14.2% of the population were below the poverty line, including 18.2% of those under age 18 and 8.3% of those age 65 or over.
Common Questions
What is Per Capita Income in Buffalo City?
Per Capita income in Buffalo City is $41,735.
What is the Median Family Income in Buffalo City?
Median Family Income in Buffalo City is $77,750.
What is the Median Household income in Buffalo City?
Median Household Income in Buffalo City is $67,955.
What is Income or Wage Gap in Buffalo City?
Income or Wage Gap in Buffalo City is 34.1%.
Women in Buffalo City earn 65.9 cents for every dollar earned by a man.
What is Inequality or Gini Index in Buffalo City?
Inequality or Gini Index in Buffalo City is 0.38.
What is the Total Population of Buffalo City?
Total Population of Buffalo City is 835.
What is the Total Male Population of Buffalo City?
Total Male Population of Buffalo City is 449.
What is the Total Female Population of Buffalo City?
Total Female Population of Buffalo City is 386.
What is the Ratio of Males per 100 Females in Buffalo City?
There are 116.32 Males per 100 Females in Buffalo City.
What is the Ratio of Females per 100 Males in Buffalo City?
There are 85.97 Females per 100 Males in Buffalo City.
What is the Median Population Age in Buffalo City?
Median Population Age in Buffalo City is 56.3 Years.
What is the Average Family Size in Buffalo City
Average Family Size in Buffalo City is 2.4 People.
What is the Average Household Size in Buffalo City
Average Household Size in Buffalo City is 1.9 People.
How Large is the Labor Force in Buffalo City?
There are 487 People in the Labor Forcein in Buffalo City.
What is the Percentage of People in the Labor Force in Buffalo City?
63.5% of People are in the Labor Force in Buffalo City.
What is the Unemployment Rate in Buffalo City?
Unemployment Rate in Buffalo City is 2.3%.