Brice Prairie, WI Map & Demographics
Brice Prairie Map
Brice Prairie Overview
$40,942
PER CAPITA INCOME
$108,750
AVG FAMILY INCOME
$89,013
AVG HOUSEHOLD INCOME
30.1%
WAGE / INCOME GAP [ % ]
69.9¢/ $1
WAGE / INCOME GAP [ $ ]
0.34
INEQUALITY / GINI INDEX
1,945
TOTAL POPULATION
969
MALE POPULATION
976
FEMALE POPULATION
99.28
MALES / 100 FEMALES
100.72
FEMALES / 100 MALES
46.0
MEDIAN AGE
3.0
AVG FAMILY SIZE
2.6
AVG HOUSEHOLD SIZE
1,065
LABOR FORCE [ PEOPLE ]
67.5%
PERCENT IN LABOR FORCE
1.6%
UNEMPLOYMENT RATE
Income in Brice Prairie
Income Overview in Brice Prairie
Per Capita Income in Brice Prairie is $40,942, while median incomes of families and households are $108,750 and $89,013 respectively.
| Characteristic | Number | Measure |
| Per Capita Income | 1,945 | $40,942 |
| Median Family Income | 590 | $108,750 |
| Mean Family Income | 590 | $115,272 |
| Median Household Income | 751 | $89,013 |
| Mean Household Income | 751 | $102,175 |
| Income Deficit | 590 | $0 |
| Wage / Income Gap (%) | 1,945 | 30.09% |
| Wage / Income Gap ($) | 1,945 | 69.91¢ per $1 |
| Gini / Inequality Index | 1,945 | 0.34 |
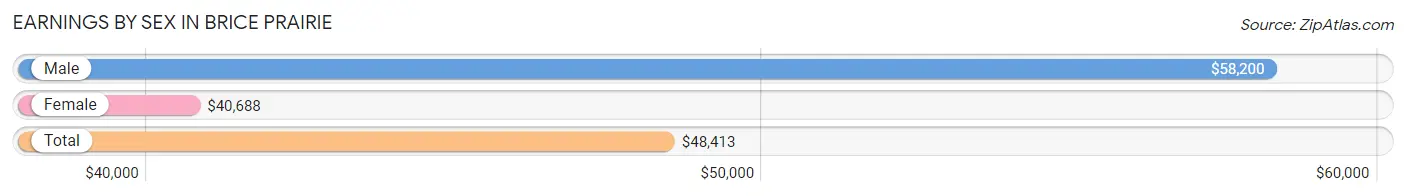
Earnings by Sex in Brice Prairie
Average Earnings in Brice Prairie are $48,413, $58,200 for men and $40,688 for women, a difference of 30.1%.
| Sex | Number | Average Earnings |
| Male | 530 (47.9%) | $58,200 |
| Female | 577 (52.1%) | $40,688 |
| Total | 1,107 (100.0%) | $48,413 |
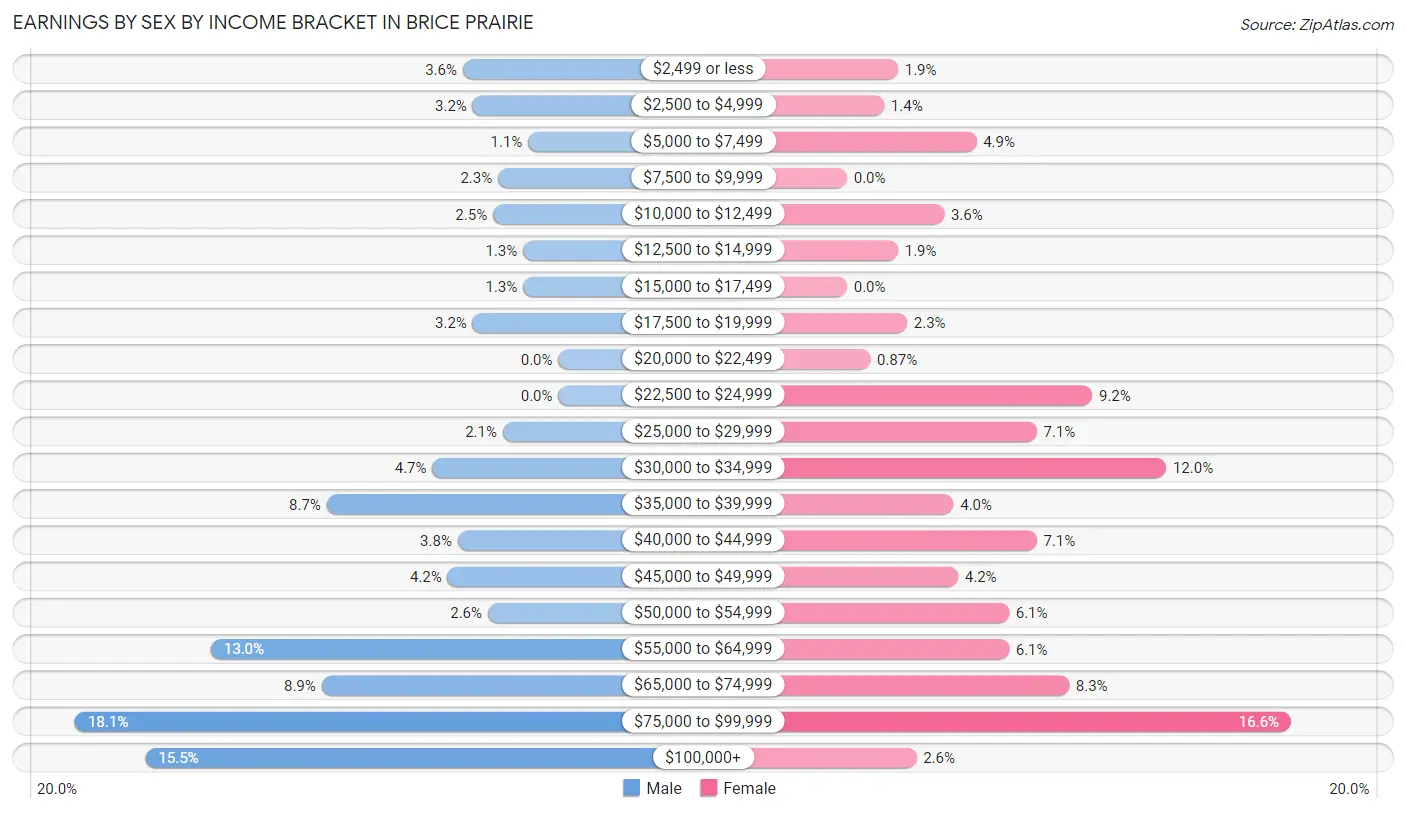
Earnings by Sex by Income Bracket in Brice Prairie
The most common earnings brackets in Brice Prairie are $75,000 to $99,999 for men (96 | 18.1%) and $75,000 to $99,999 for women (96 | 16.6%).
| Income | Male | Female |
| $2,499 or less | 19 (3.6%) | 11 (1.9%) |
| $2,500 to $4,999 | 17 (3.2%) | 8 (1.4%) |
| $5,000 to $7,499 | 6 (1.1%) | 28 (4.9%) |
| $7,500 to $9,999 | 12 (2.3%) | 0 (0.0%) |
| $10,000 to $12,499 | 13 (2.5%) | 21 (3.6%) |
| $12,500 to $14,999 | 7 (1.3%) | 11 (1.9%) |
| $15,000 to $17,499 | 7 (1.3%) | 0 (0.0%) |
| $17,500 to $19,999 | 17 (3.2%) | 13 (2.2%) |
| $20,000 to $22,499 | 0 (0.0%) | 5 (0.9%) |
| $22,500 to $24,999 | 0 (0.0%) | 53 (9.2%) |
| $25,000 to $29,999 | 11 (2.1%) | 41 (7.1%) |
| $30,000 to $34,999 | 25 (4.7%) | 69 (12.0%) |
| $35,000 to $39,999 | 46 (8.7%) | 23 (4.0%) |
| $40,000 to $44,999 | 20 (3.8%) | 41 (7.1%) |
| $45,000 to $49,999 | 22 (4.2%) | 24 (4.2%) |
| $50,000 to $54,999 | 14 (2.6%) | 35 (6.1%) |
| $55,000 to $64,999 | 69 (13.0%) | 35 (6.1%) |
| $65,000 to $74,999 | 47 (8.9%) | 48 (8.3%) |
| $75,000 to $99,999 | 96 (18.1%) | 96 (16.6%) |
| $100,000+ | 82 (15.5%) | 15 (2.6%) |
| Total | 530 (100.0%) | 577 (100.0%) |
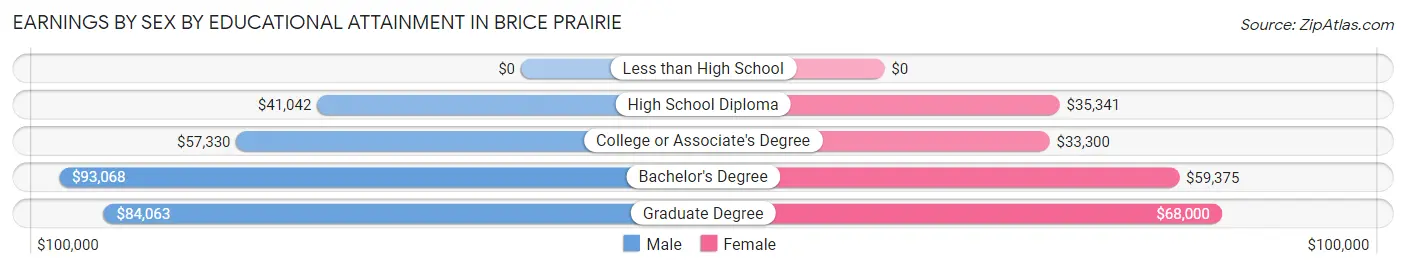
Earnings by Sex by Educational Attainment in Brice Prairie
Average earnings in Brice Prairie are $60,250 for men and $43,929 for women, a difference of 27.1%. Men with an educational attainment of bachelor's degree enjoy the highest average annual earnings of $93,068, while those with high school diploma education earn the least with $41,042. Women with an educational attainment of graduate degree earn the most with the average annual earnings of $68,000, while those with college or associate's degree education have the smallest earnings of $33,300.
| Educational Attainment | Male Income | Female Income |
| Less than High School | - | - |
| High School Diploma | $41,042 | $35,341 |
| College or Associate's Degree | $57,330 | $33,300 |
| Bachelor's Degree | $93,068 | $59,375 |
| Graduate Degree | $84,063 | $68,000 |
| Total | $60,250 | $43,929 |
Family Income in Brice Prairie
Family Income Brackets in Brice Prairie
According to the Brice Prairie family income data, there are 193 families falling into the $100,000 to $149,999 income range, which is the most common income bracket and makes up 32.7% of all families. Conversely, the less than $10,000 income bracket is the least frequent group with only 3 families (0.5%) belonging to this category.
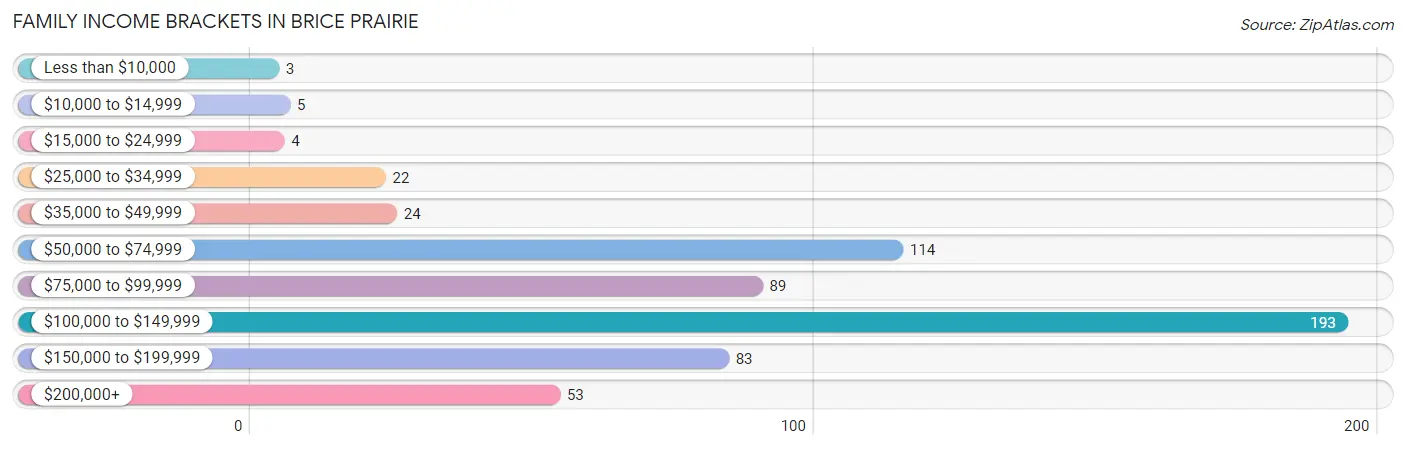
| Income Bracket | # Families | % Families |
| Less than $10,000 | 3 | 0.5% |
| $10,000 to $14,999 | 5 | 0.8% |
| $15,000 to $24,999 | 4 | 0.7% |
| $25,000 to $34,999 | 22 | 3.7% |
| $35,000 to $49,999 | 24 | 4.1% |
| $50,000 to $74,999 | 114 | 19.3% |
| $75,000 to $99,999 | 89 | 15.1% |
| $100,000 to $149,999 | 193 | 32.7% |
| $150,000 to $199,999 | 83 | 14.1% |
| $200,000+ | 53 | 9.0% |
Family Income by Famaliy Size in Brice Prairie
3-person families (105 | 17.8%) account for the highest median family income in Brice Prairie with $139,875 per family, while 3-person families (105 | 17.8%) have the highest median income of $46,625 per family member.
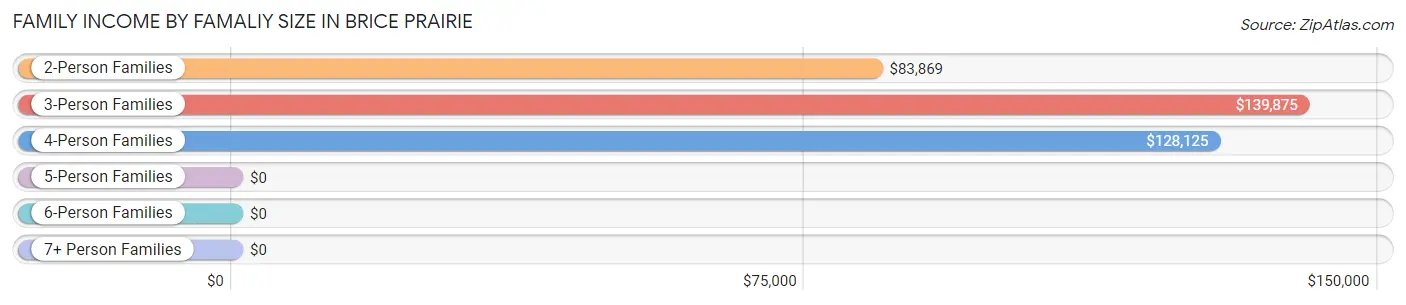
| Income Bracket | # Families | Median Income |
| 2-Person Families | 323 (54.7%) | $83,869 |
| 3-Person Families | 105 (17.8%) | $139,875 |
| 4-Person Families | 141 (23.9%) | $128,125 |
| 5-Person Families | 14 (2.4%) | $0 |
| 6-Person Families | 0 (0.0%) | $0 |
| 7+ Person Families | 7 (1.2%) | $0 |
| Total | 590 (100.0%) | $108,750 |
Family Income by Number of Earners in Brice Prairie
The median family income in Brice Prairie is $108,750, with families comprising 2 earners (305) having the highest median family income of $127,596, while families with 1 earner (103) have the lowest median family income of $65,208, accounting for 51.7% and 17.5% of families, respectively.
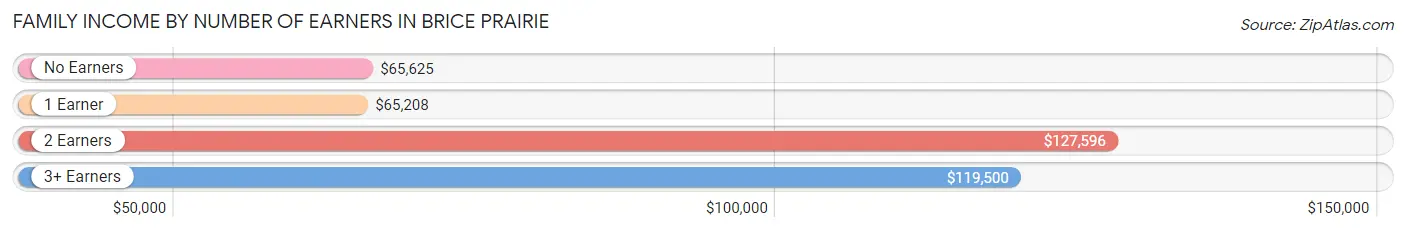
| Number of Earners | # Families | Median Income |
| No Earners | 96 (16.3%) | $65,625 |
| 1 Earner | 103 (17.5%) | $65,208 |
| 2 Earners | 305 (51.7%) | $127,596 |
| 3+ Earners | 86 (14.6%) | $119,500 |
| Total | 590 (100.0%) | $108,750 |
Household Income in Brice Prairie
Household Income Brackets in Brice Prairie
With 203 households falling in the category, the $100,000 to $149,999 income range is the most frequent in Brice Prairie, accounting for 27.0% of all households. In contrast, only 14 households (1.9%) fall into the $15,000 to $24,999 income bracket, making it the least populous group.
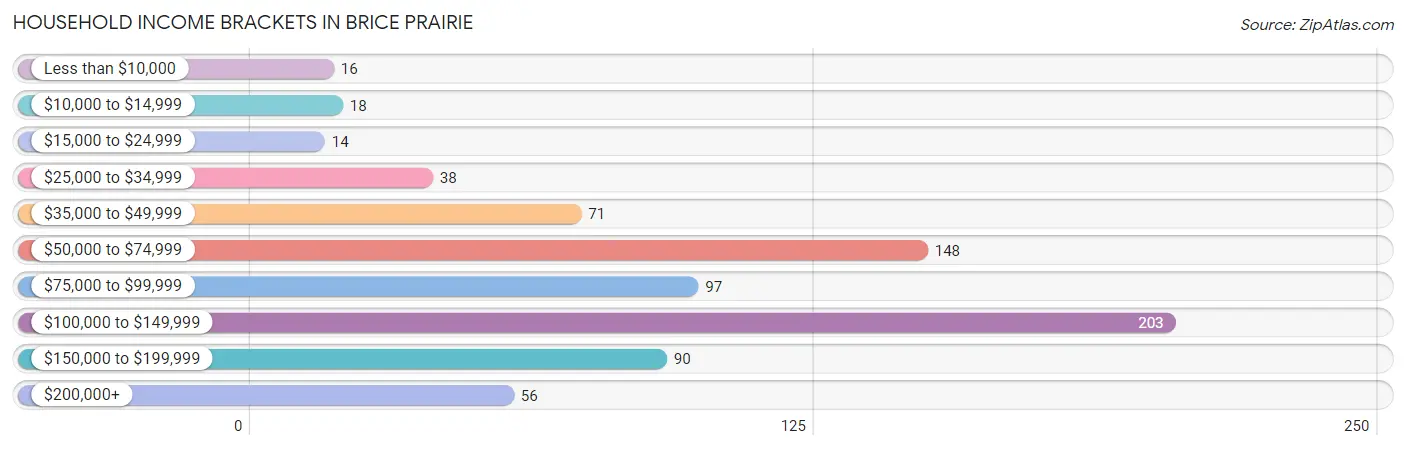
| Income Bracket | # Households | % Households |
| Less than $10,000 | 16 | 2.1% |
| $10,000 to $14,999 | 18 | 2.4% |
| $15,000 to $24,999 | 14 | 1.9% |
| $25,000 to $34,999 | 38 | 5.1% |
| $35,000 to $49,999 | 71 | 9.5% |
| $50,000 to $74,999 | 148 | 19.7% |
| $75,000 to $99,999 | 97 | 12.9% |
| $100,000 to $149,999 | 203 | 27.0% |
| $150,000 to $199,999 | 90 | 12.0% |
| $200,000+ | 56 | 7.5% |
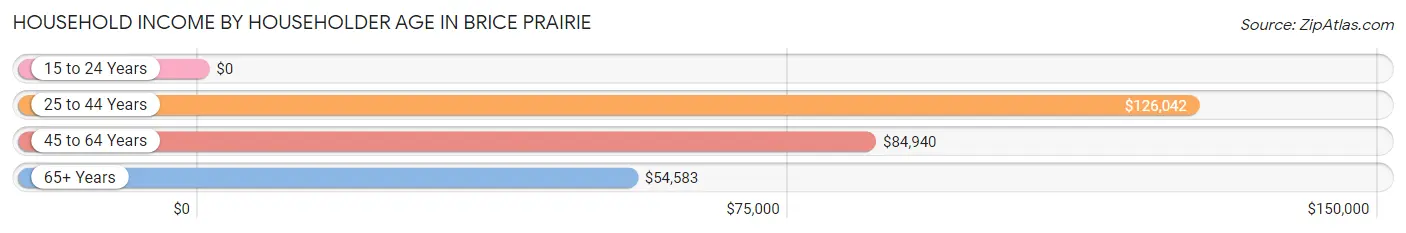
Household Income by Householder Age in Brice Prairie
The median household income in Brice Prairie is $89,013, with the highest median household income of $126,042 found in the 25 to 44 years age bracket for the primary householder. A total of 228 households (30.4%) fall into this category.
| Income Bracket | # Households | Median Income |
| 15 to 24 Years | 0 (0.0%) | $0 |
| 25 to 44 Years | 228 (30.4%) | $126,042 |
| 45 to 64 Years | 343 (45.7%) | $84,940 |
| 65+ Years | 180 (24.0%) | $54,583 |
| Total | 751 (100.0%) | $89,013 |
Poverty in Brice Prairie
Income Below Poverty by Sex and Age in Brice Prairie
With 3.7% poverty level for males and 0.9% for females among the residents of Brice Prairie, 75 year old and over males and 75 year old and over females are the most vulnerable to poverty, with 15 males (34.1%) and 5 females (15.1%) in their respective age groups living below the poverty level.
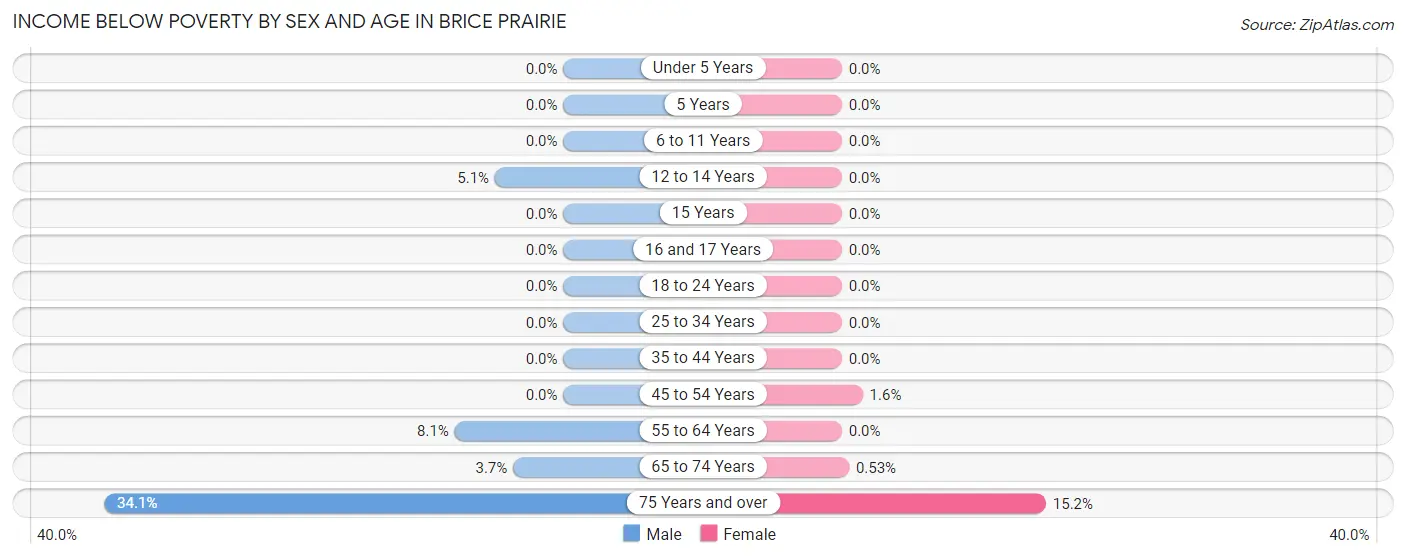
| Age Bracket | Male | Female |
| Under 5 Years | 0 (0.0%) | 0 (0.0%) |
| 5 Years | 0 (0.0%) | 0 (0.0%) |
| 6 to 11 Years | 0 (0.0%) | 0 (0.0%) |
| 12 to 14 Years | 3 (5.1%) | 0 (0.0%) |
| 15 Years | 0 (0.0%) | 0 (0.0%) |
| 16 and 17 Years | 0 (0.0%) | 0 (0.0%) |
| 18 to 24 Years | 0 (0.0%) | 0 (0.0%) |
| 25 to 34 Years | 0 (0.0%) | 0 (0.0%) |
| 35 to 44 Years | 0 (0.0%) | 0 (0.0%) |
| 45 to 54 Years | 0 (0.0%) | 3 (1.5%) |
| 55 to 64 Years | 13 (8.1%) | 0 (0.0%) |
| 65 to 74 Years | 5 (3.7%) | 1 (0.5%) |
| 75 Years and over | 15 (34.1%) | 5 (15.1%) |
| Total | 36 (3.7%) | 9 (0.9%) |
Income Above Poverty by Sex and Age in Brice Prairie
According to the poverty statistics in Brice Prairie, males aged under 5 years and females aged under 5 years are the age groups that are most secure financially, with 100.0% of males and 100.0% of females in these age groups living above the poverty line.
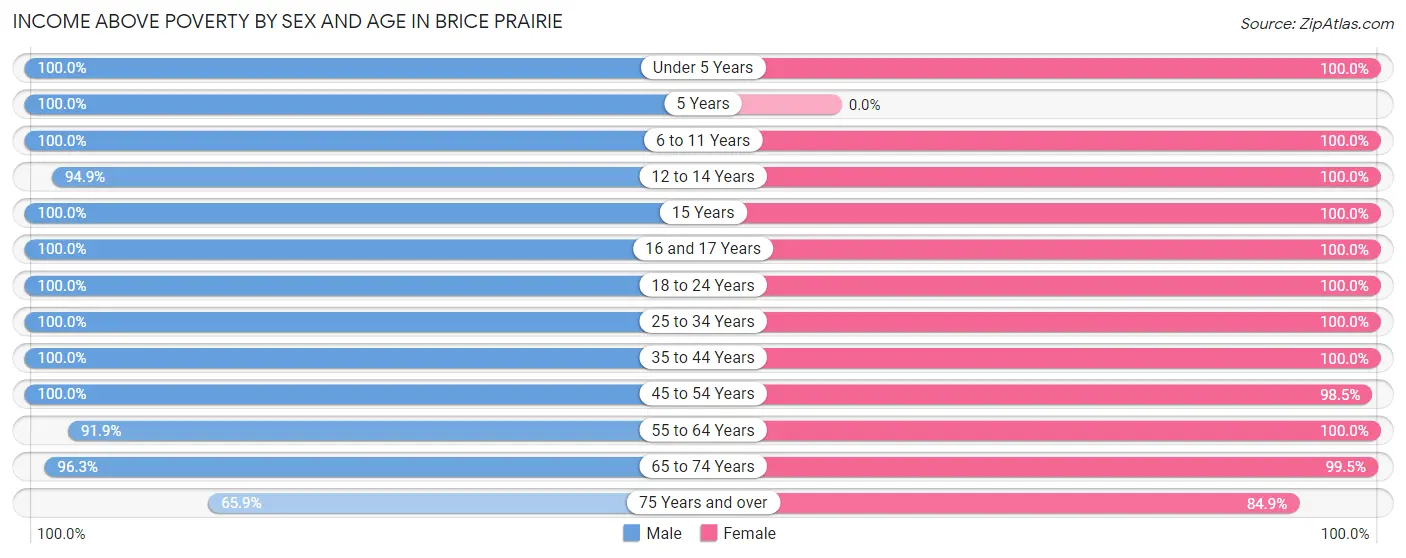
| Age Bracket | Male | Female |
| Under 5 Years | 51 (100.0%) | 29 (100.0%) |
| 5 Years | 23 (100.0%) | 0 (0.0%) |
| 6 to 11 Years | 68 (100.0%) | 104 (100.0%) |
| 12 to 14 Years | 56 (94.9%) | 15 (100.0%) |
| 15 Years | 4 (100.0%) | 14 (100.0%) |
| 16 and 17 Years | 8 (100.0%) | 19 (100.0%) |
| 18 to 24 Years | 39 (100.0%) | 45 (100.0%) |
| 25 to 34 Years | 69 (100.0%) | 74 (100.0%) |
| 35 to 44 Years | 157 (100.0%) | 137 (100.0%) |
| 45 to 54 Years | 152 (100.0%) | 190 (98.5%) |
| 55 to 64 Years | 148 (91.9%) | 125 (100.0%) |
| 65 to 74 Years | 129 (96.3%) | 187 (99.5%) |
| 75 Years and over | 29 (65.9%) | 28 (84.9%) |
| Total | 933 (96.3%) | 967 (99.1%) |
Income Below Poverty Among Married-Couple Families in Brice Prairie
The poverty statistics for married-couple families in Brice Prairie show that 0.9% or 5 of the total 544 families live below the poverty line. Families with no children have the highest poverty rate of 1.5%, comprising of 5 families. On the other hand, families with 1 or 2 children have the lowest poverty rate of 0.0%, which includes 0 families.
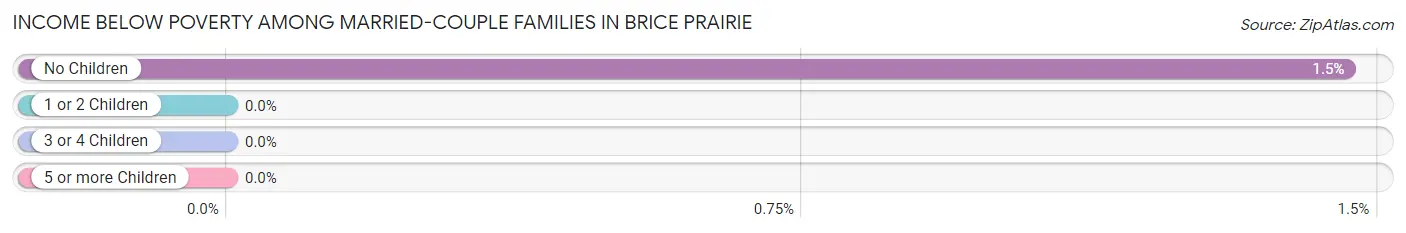
| Children | Above Poverty | Below Poverty |
| No Children | 338 (98.5%) | 5 (1.5%) |
| 1 or 2 Children | 186 (100.0%) | 0 (0.0%) |
| 3 or 4 Children | 15 (100.0%) | 0 (0.0%) |
| 5 or more Children | 0 (0.0%) | 0 (0.0%) |
| Total | 539 (99.1%) | 5 (0.9%) |
Income Below Poverty Among Single-Parent Households in Brice Prairie
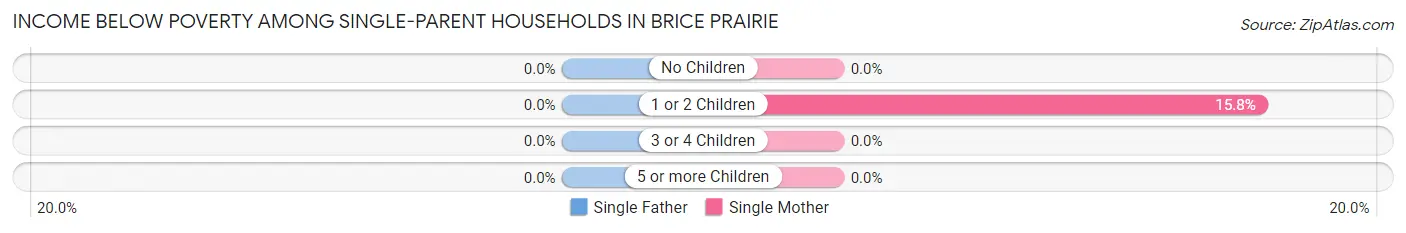
| Children | Single Father | Single Mother |
| No Children | 0 (0.0%) | 0 (0.0%) |
| 1 or 2 Children | 0 (0.0%) | 3 (15.8%) |
| 3 or 4 Children | 0 (0.0%) | 0 (0.0%) |
| 5 or more Children | 0 (0.0%) | 0 (0.0%) |
| Total | 0 (0.0%) | 3 (10.0%) |
Income Below Poverty Among Married-Couple vs Single-Parent Households in Brice Prairie
The poverty data for Brice Prairie shows that 5 of the married-couple family households (0.9%) and 3 of the single-parent households (6.5%) are living below the poverty level. Within the married-couple family households, those with no children have the highest poverty rate, with 5 households (1.5%) falling below the poverty line. Among the single-parent households, those with 1 or 2 children have the highest poverty rate, with 3 household (10.7%) living below poverty.
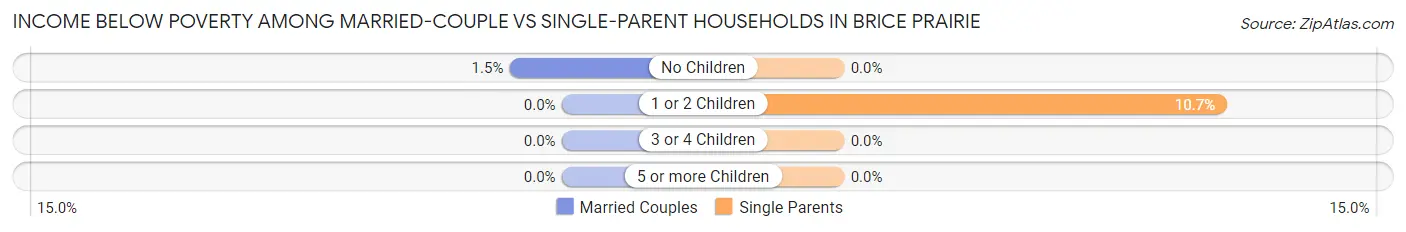
| Children | Married-Couple Families | Single-Parent Households |
| No Children | 5 (1.5%) | 0 (0.0%) |
| 1 or 2 Children | 0 (0.0%) | 3 (10.7%) |
| 3 or 4 Children | 0 (0.0%) | 0 (0.0%) |
| 5 or more Children | 0 (0.0%) | 0 (0.0%) |
| Total | 5 (0.9%) | 3 (6.5%) |
Race in Brice Prairie
The most populous races in Brice Prairie are White / Caucasian (1,859 | 95.6%), Hispanic or Latino (50 | 2.6%), and Some other Race (45 | 2.3%).
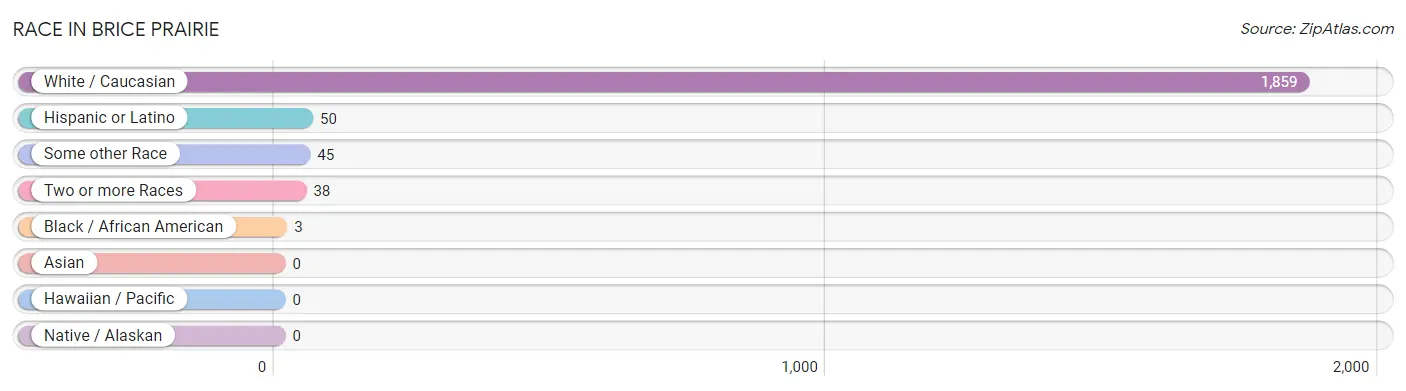
| Race | # Population | % Population |
| Asian | 0 | 0.0% |
| Black / African American | 3 | 0.2% |
| Hawaiian / Pacific | 0 | 0.0% |
| Hispanic or Latino | 50 | 2.6% |
| Native / Alaskan | 0 | 0.0% |
| White / Caucasian | 1,859 | 95.6% |
| Two or more Races | 38 | 1.9% |
| Some other Race | 45 | 2.3% |
| Total | 1,945 | 100.0% |
Ancestry in Brice Prairie
The most populous ancestries reported in Brice Prairie are German (848 | 43.6%), Norwegian (367 | 18.9%), Irish (348 | 17.9%), American (136 | 7.0%), and Polish (98 | 5.0%), together accounting for 92.4% of all Brice Prairie residents.
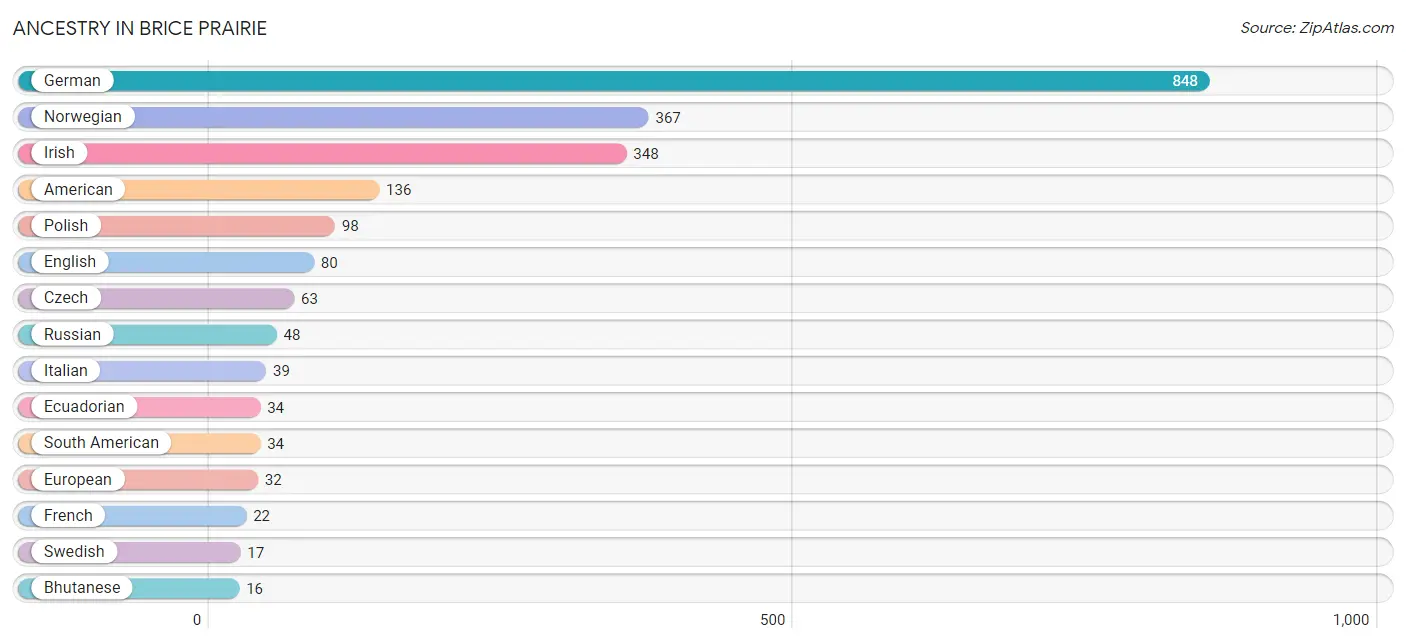
| Ancestry | # Population | % Population |
| American | 136 | 7.0% |
| Arab | 10 | 0.5% |
| Austrian | 13 | 0.7% |
| Bhutanese | 16 | 0.8% |
| British | 10 | 0.5% |
| Central American | 15 | 0.8% |
| Czech | 63 | 3.2% |
| Danish | 13 | 0.7% |
| Ecuadorian | 34 | 1.8% |
| English | 80 | 4.1% |
| European | 32 | 1.7% |
| Finnish | 2 | 0.1% |
| French | 22 | 1.1% |
| German | 848 | 43.6% |
| Irish | 348 | 17.9% |
| Italian | 39 | 2.0% |
| Lebanese | 10 | 0.5% |
| Mexican | 1 | 0.1% |
| Northern European | 8 | 0.4% |
| Norwegian | 367 | 18.9% |
| Panamanian | 15 | 0.8% |
| Polish | 98 | 5.0% |
| Russian | 48 | 2.5% |
| Scandinavian | 14 | 0.7% |
| Scotch-Irish | 7 | 0.4% |
| Scottish | 14 | 0.7% |
| South American | 34 | 1.8% |
| Swedish | 17 | 0.9% |
| Swiss | 1 | 0.1% |
| West Indian | 7 | 0.4% | View All 30 Rows |
Immigrants in Brice Prairie
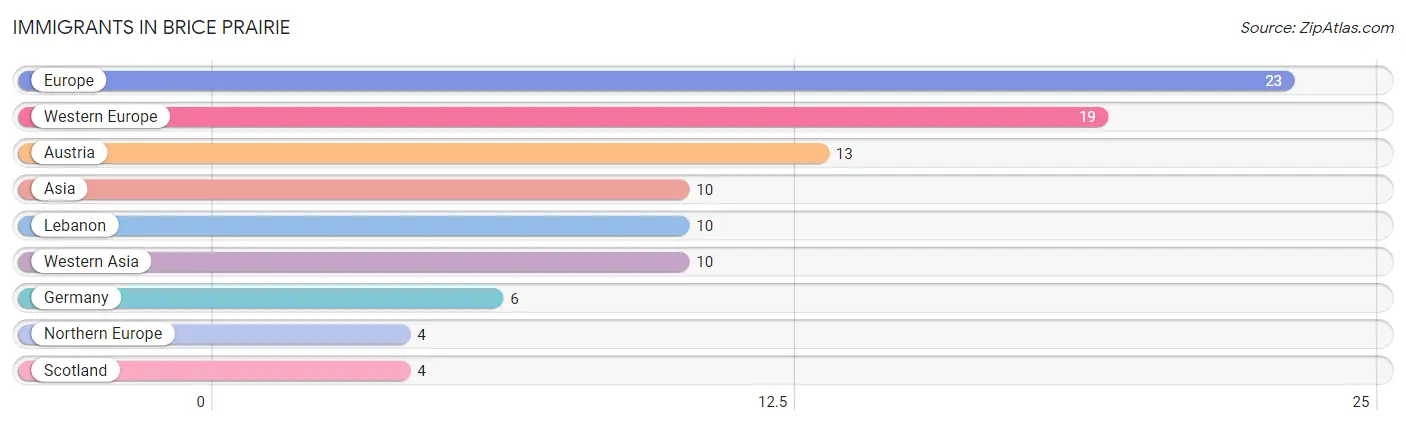
The most numerous immigrant groups reported in Brice Prairie came from Europe (23 | 1.2%), Western Europe (19 | 1.0%), Austria (13 | 0.7%), Asia (10 | 0.5%), and Lebanon (10 | 0.5%), together accounting for 3.8% of all Brice Prairie residents.
| Immigration Origin | # Population | % Population |
| Asia | 10 | 0.5% |
| Austria | 13 | 0.7% |
| Europe | 23 | 1.2% |
| Germany | 6 | 0.3% |
| Lebanon | 10 | 0.5% |
| Northern Europe | 4 | 0.2% |
| Scotland | 4 | 0.2% |
| Western Asia | 10 | 0.5% |
| Western Europe | 19 | 1.0% | View All 9 Rows |
Sex and Age in Brice Prairie
Sex and Age in Brice Prairie
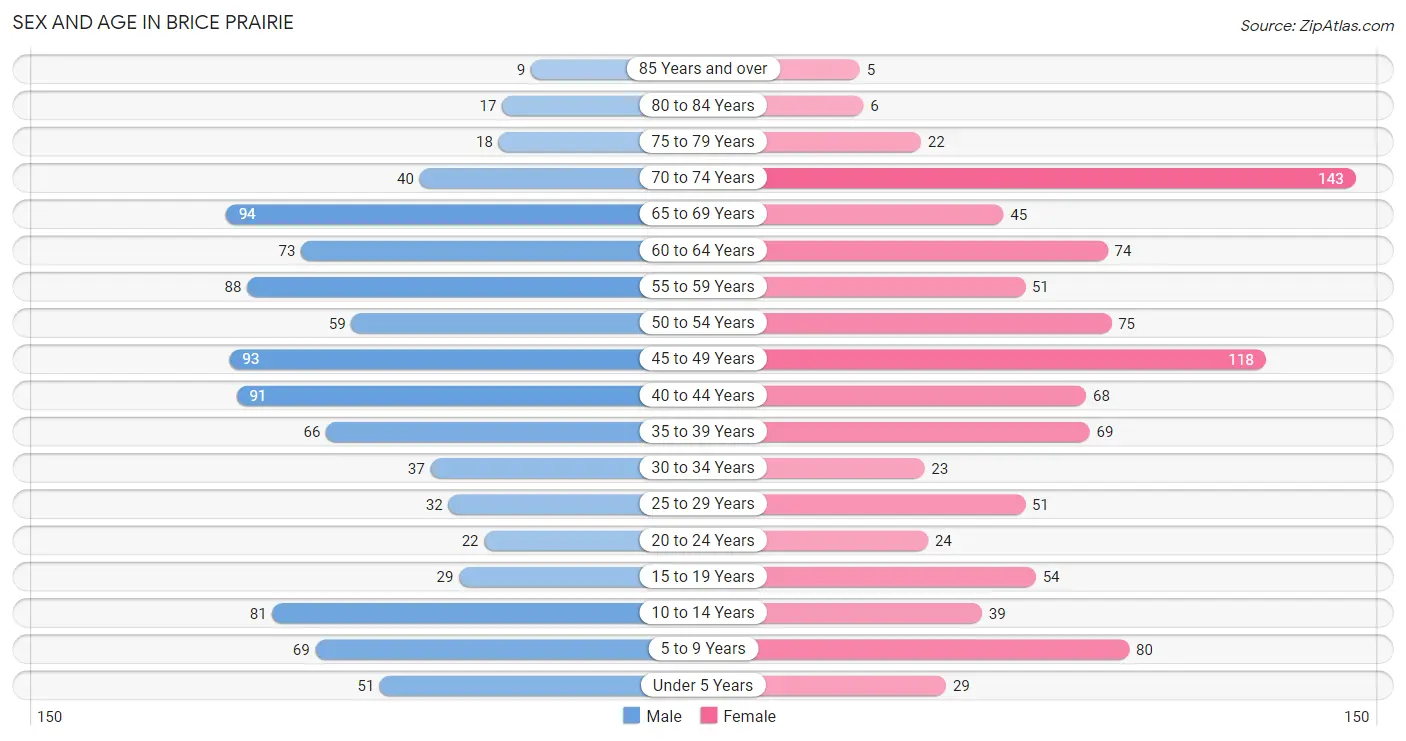
The most populous age groups in Brice Prairie are 65 to 69 Years (94 | 9.7%) for men and 70 to 74 Years (143 | 14.6%) for women.
| Age Bracket | Male | Female |
| Under 5 Years | 51 (5.3%) | 29 (3.0%) |
| 5 to 9 Years | 69 (7.1%) | 80 (8.2%) |
| 10 to 14 Years | 81 (8.4%) | 39 (4.0%) |
| 15 to 19 Years | 29 (3.0%) | 54 (5.5%) |
| 20 to 24 Years | 22 (2.3%) | 24 (2.5%) |
| 25 to 29 Years | 32 (3.3%) | 51 (5.2%) |
| 30 to 34 Years | 37 (3.8%) | 23 (2.4%) |
| 35 to 39 Years | 66 (6.8%) | 69 (7.1%) |
| 40 to 44 Years | 91 (9.4%) | 68 (7.0%) |
| 45 to 49 Years | 93 (9.6%) | 118 (12.1%) |
| 50 to 54 Years | 59 (6.1%) | 75 (7.7%) |
| 55 to 59 Years | 88 (9.1%) | 51 (5.2%) |
| 60 to 64 Years | 73 (7.5%) | 74 (7.6%) |
| 65 to 69 Years | 94 (9.7%) | 45 (4.6%) |
| 70 to 74 Years | 40 (4.1%) | 143 (14.6%) |
| 75 to 79 Years | 18 (1.9%) | 22 (2.2%) |
| 80 to 84 Years | 17 (1.8%) | 6 (0.6%) |
| 85 Years and over | 9 (0.9%) | 5 (0.5%) |
| Total | 969 (100.0%) | 976 (100.0%) |
Families and Households in Brice Prairie
Median Family Size in Brice Prairie
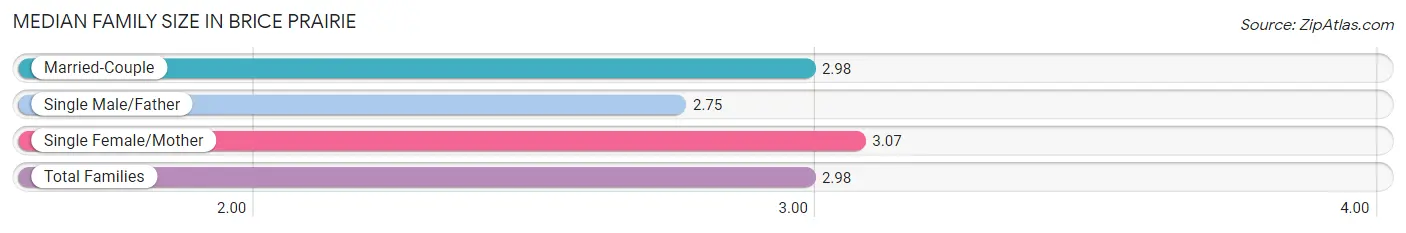
The median family size in Brice Prairie is 2.98 persons per family, with single female/mother families (30 | 5.1%) accounting for the largest median family size of 3.07 persons per family. On the other hand, single male/father families (16 | 2.7%) represent the smallest median family size with 2.75 persons per family.
| Family Type | # Families | Family Size |
| Married-Couple | 544 (92.2%) | 2.98 |
| Single Male/Father | 16 (2.7%) | 2.75 |
| Single Female/Mother | 30 (5.1%) | 3.07 |
| Total Families | 590 (100.0%) | 2.98 |
Median Household Size in Brice Prairie
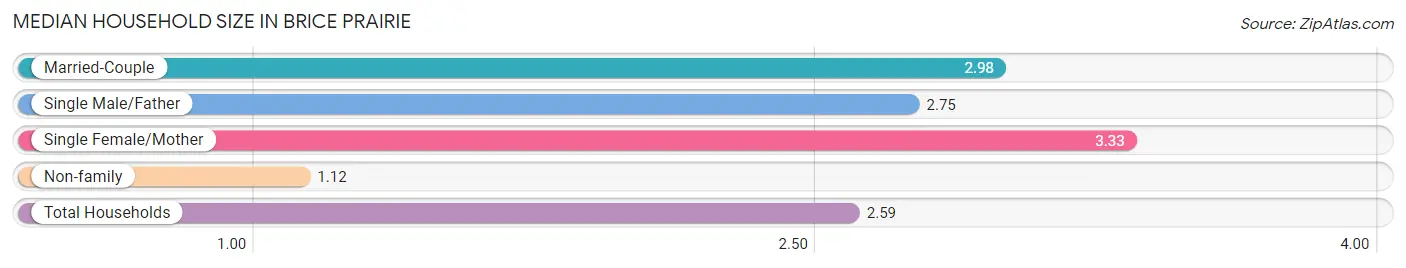
The median household size in Brice Prairie is 2.59 persons per household, with single female/mother households (30 | 4.0%) accounting for the largest median household size of 3.33 persons per household. non-family households (161 | 21.4%) represent the smallest median household size with 1.12 persons per household.
| Household Type | # Households | Household Size |
| Married-Couple | 544 (72.4%) | 2.98 |
| Single Male/Father | 16 (2.1%) | 2.75 |
| Single Female/Mother | 30 (4.0%) | 3.33 |
| Non-family | 161 (21.4%) | 1.12 |
| Total Households | 751 (100.0%) | 2.59 |
Household Size by Marriage Status in Brice Prairie
Out of a total of 751 households in Brice Prairie, 590 (78.6%) are family households, while 161 (21.4%) are nonfamily households. The most numerous type of family households are 2-person households, comprising 320, and the most common type of nonfamily households are 1-person households, comprising 140.
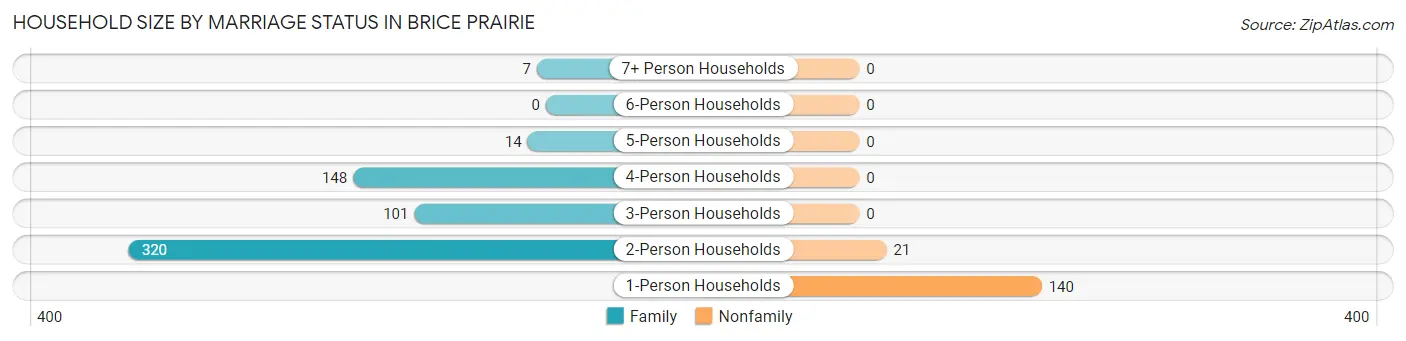
| Household Size | Family Households | Nonfamily Households |
| 1-Person Households | - | 140 (18.6%) |
| 2-Person Households | 320 (42.6%) | 21 (2.8%) |
| 3-Person Households | 101 (13.5%) | 0 (0.0%) |
| 4-Person Households | 148 (19.7%) | 0 (0.0%) |
| 5-Person Households | 14 (1.9%) | 0 (0.0%) |
| 6-Person Households | 0 (0.0%) | 0 (0.0%) |
| 7+ Person Households | 7 (0.9%) | 0 (0.0%) |
| Total | 590 (78.6%) | 161 (21.4%) |
Female Fertility in Brice Prairie
Fertility by Age in Brice Prairie
Average fertility rate in Brice Prairie is 31.0 births per 1,000 women. Women in the age bracket of 20 to 34 years have the highest fertility rate with 133.0 births per 1,000 women. Women in the age bracket of 20 to 34 years acount for 100.0% of all women with births.
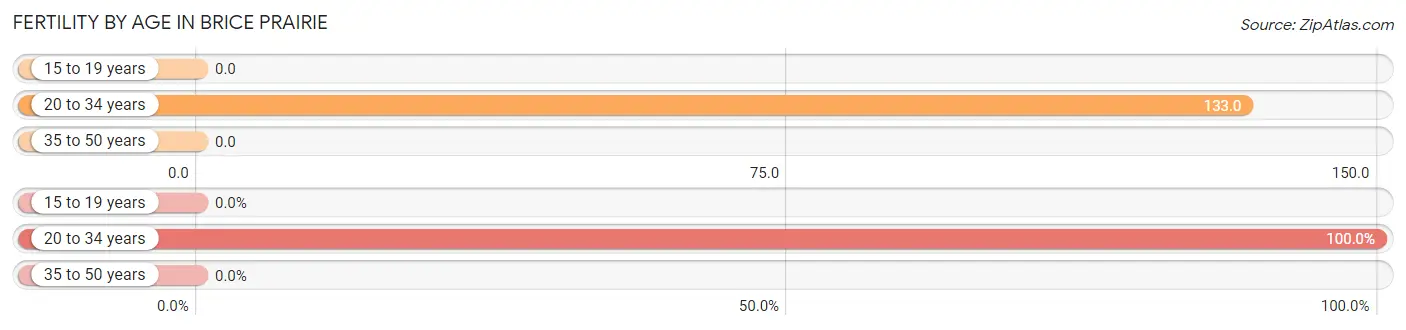
| Age Bracket | Women with Births | Births / 1,000 Women |
| 15 to 19 years | 0 (0.0%) | 0.0 |
| 20 to 34 years | 13 (100.0%) | 133.0 |
| 35 to 50 years | 0 (0.0%) | 0.0 |
| Total | 13 (100.0%) | 31.0 |
Fertility by Age by Marriage Status in Brice Prairie
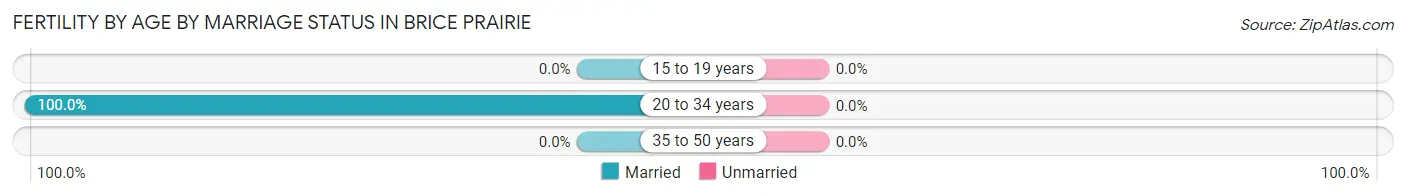
| Age Bracket | Married | Unmarried |
| 15 to 19 years | 0 (0.0%) | 0 (0.0%) |
| 20 to 34 years | 13 (100.0%) | 0 (0.0%) |
| 35 to 50 years | 0 (0.0%) | 0 (0.0%) |
| Total | 13 (100.0%) | 0 (0.0%) |
Fertility by Education in Brice Prairie
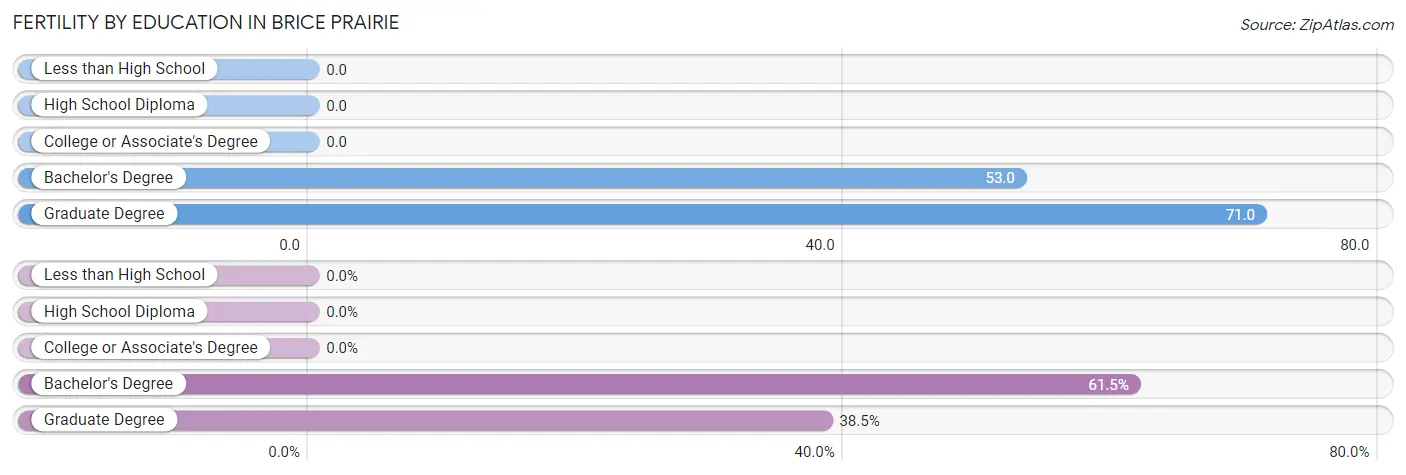
| Educational Attainment | Women with Births | Births / 1,000 Women |
| Less than High School | 0 (0.0%) | 0.0 |
| High School Diploma | 0 (0.0%) | 0.0 |
| College or Associate's Degree | 0 (0.0%) | 0.0 |
| Bachelor's Degree | 8 (61.5%) | 53.0 |
| Graduate Degree | 5 (38.5%) | 71.0 |
| Total | 13 (100.0%) | 31.0 |
Fertility by Education by Marriage Status in Brice Prairie
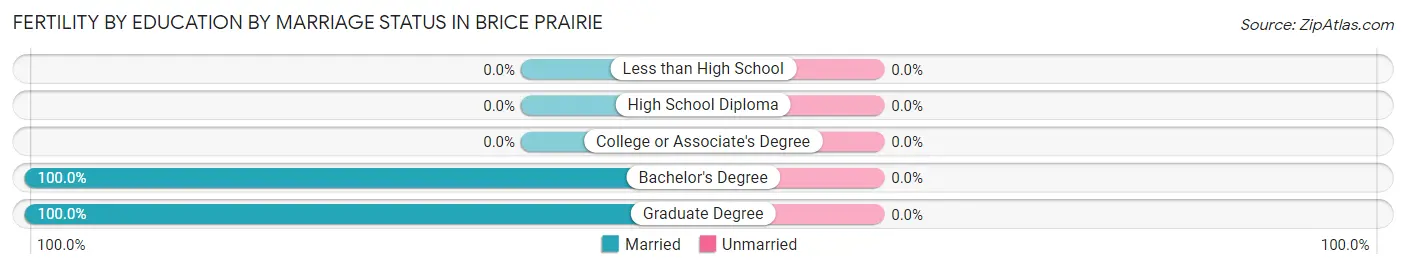
| Educational Attainment | Married | Unmarried |
| Less than High School | 0 (0.0%) | 0 (0.0%) |
| High School Diploma | 0 (0.0%) | 0 (0.0%) |
| College or Associate's Degree | 0 (0.0%) | 0 (0.0%) |
| Bachelor's Degree | 8 (100.0%) | 0 (0.0%) |
| Graduate Degree | 5 (100.0%) | 0 (0.0%) |
| Total | 13 (100.0%) | 0 (0.0%) |
Employment Characteristics in Brice Prairie
Employment by Class of Employer in Brice Prairie
Among the 1,042 employed individuals in Brice Prairie, private company employees (677 | 65.0%), not-for-profit organizations (132 | 12.7%), and local government employees (116 | 11.1%) make up the most common classes of employment.
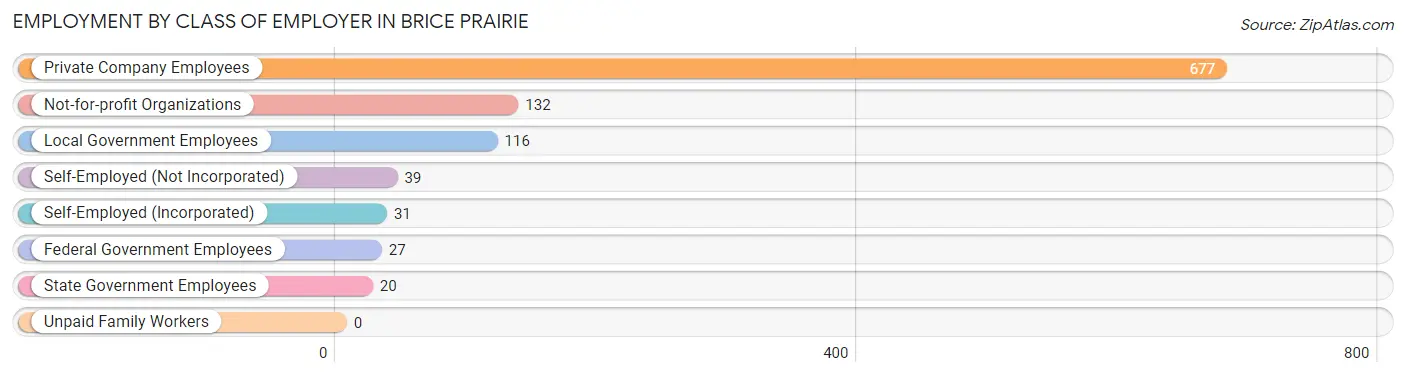
| Employer Class | # Employees | % Employees |
| Private Company Employees | 677 | 65.0% |
| Self-Employed (Incorporated) | 31 | 3.0% |
| Self-Employed (Not Incorporated) | 39 | 3.7% |
| Not-for-profit Organizations | 132 | 12.7% |
| Local Government Employees | 116 | 11.1% |
| State Government Employees | 20 | 1.9% |
| Federal Government Employees | 27 | 2.6% |
| Unpaid Family Workers | 0 | 0.0% |
| Total | 1,042 | 100.0% |
Employment Status by Age in Brice Prairie
According to the labor force statistics for Brice Prairie, out of the total population over 16 years of age (1,578), 67.5% or 1,065 individuals are in the labor force, with 1.6% or 17 of them unemployed. The age group with the highest labor force participation rate is 20 to 24 years, with 100.0% or 46 individuals in the labor force. Within the labor force, the 65 to 74 years age range has the highest percentage of unemployed individuals, with 11.1% or 5 of them being unemployed.
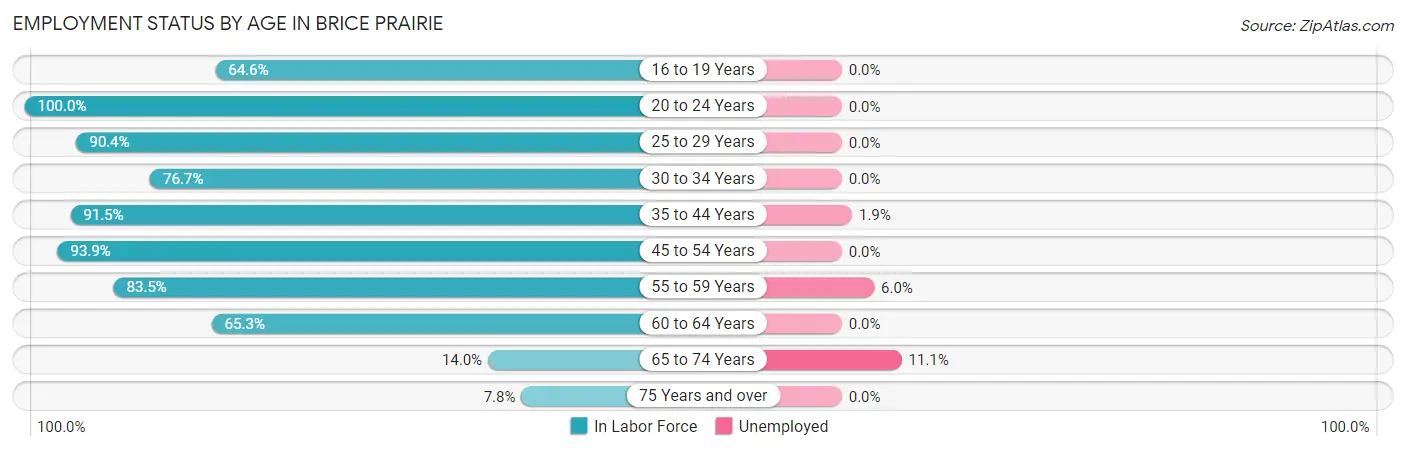
| Age Bracket | In Labor Force | Unemployed |
| 16 to 19 Years | 42 (64.6%) | 0 (0.0%) |
| 20 to 24 Years | 46 (100.0%) | 0 (0.0%) |
| 25 to 29 Years | 75 (90.4%) | 0 (0.0%) |
| 30 to 34 Years | 46 (76.7%) | 0 (0.0%) |
| 35 to 44 Years | 269 (91.5%) | 5 (1.9%) |
| 45 to 54 Years | 324 (93.9%) | 0 (0.0%) |
| 55 to 59 Years | 116 (83.5%) | 7 (6.0%) |
| 60 to 64 Years | 96 (65.3%) | 0 (0.0%) |
| 65 to 74 Years | 45 (14.0%) | 5 (11.1%) |
| 75 Years and over | 6 (7.8%) | 0 (0.0%) |
| Total | 1,065 (67.5%) | 17 (1.6%) |
Employment Status by Educational Attainment in Brice Prairie
According to labor force statistics for Brice Prairie, 86.7% of individuals (926) out of the total population between 25 and 64 years of age (1,068) are in the labor force, with 1.3% or 12 of them being unemployed. The group with the highest labor force participation rate are those with the educational attainment of bachelor's degree or higher, with 90.2% or 395 individuals in the labor force. Within the labor force, individuals with high school diploma education have the highest percentage of unemployment, with 2.3% or 5 of them being unemployed.
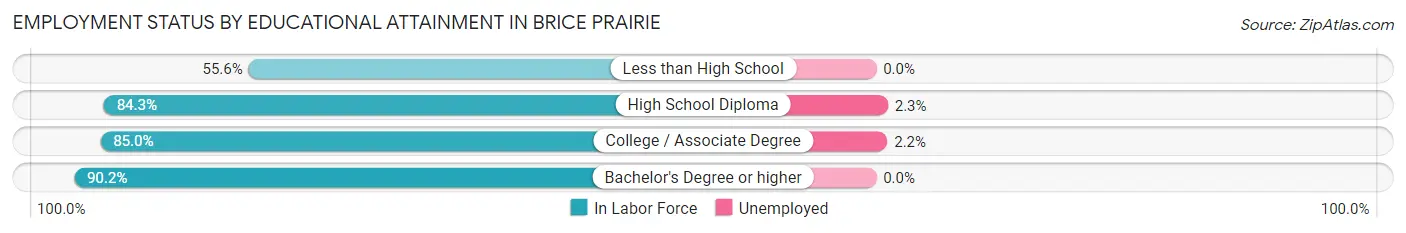
| Educational Attainment | In Labor Force | Unemployed |
| Less than High School | 5 (55.6%) | 0 (0.0%) |
| High School Diploma | 214 (84.3%) | 6 (2.3%) |
| College / Associate Degree | 312 (85.0%) | 8 (2.2%) |
| Bachelor's Degree or higher | 395 (90.2%) | 0 (0.0%) |
| Total | 926 (86.7%) | 14 (1.3%) |
Employment Occupations by Sex in Brice Prairie
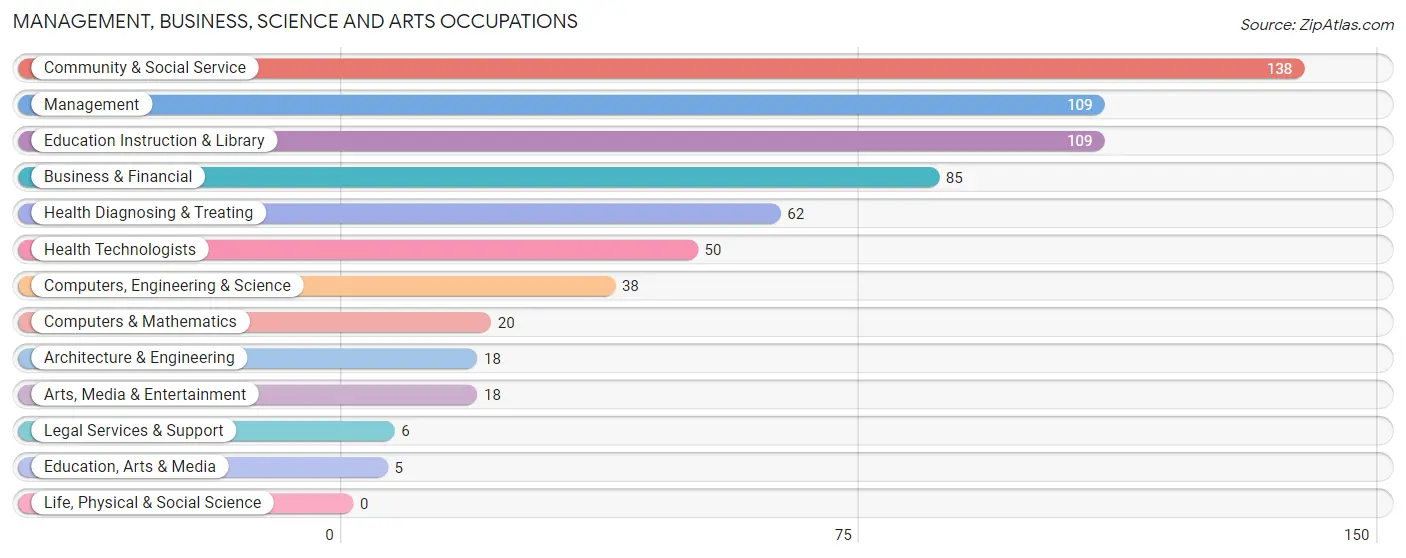
Management, Business, Science and Arts Occupations
The most common Management, Business, Science and Arts occupations in Brice Prairie are Community & Social Service (138 | 13.2%), Management (109 | 10.4%), Education Instruction & Library (109 | 10.4%), Business & Financial (85 | 8.1%), and Health Diagnosing & Treating (62 | 5.9%).
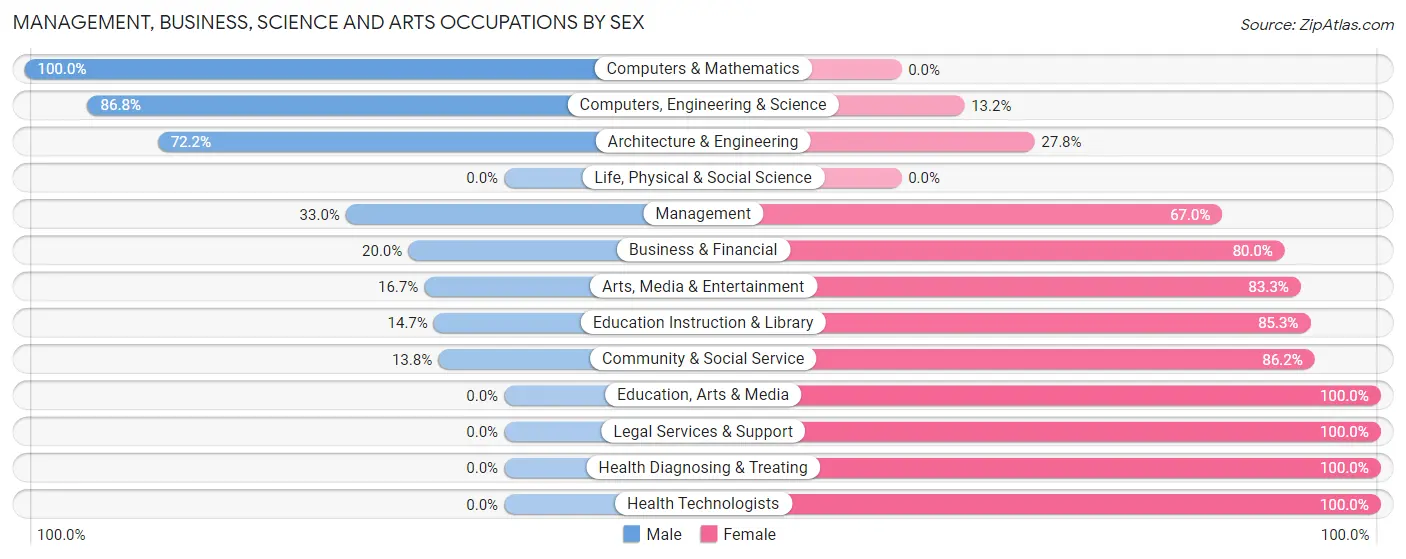
Management, Business, Science and Arts Occupations by Sex
Within the Management, Business, Science and Arts occupations in Brice Prairie, the most male-oriented occupations are Computers & Mathematics (100.0%), Computers, Engineering & Science (86.8%), and Architecture & Engineering (72.2%), while the most female-oriented occupations are Education, Arts & Media (100.0%), Legal Services & Support (100.0%), and Health Diagnosing & Treating (100.0%).
| Occupation | Male | Female |
| Management | 36 (33.0%) | 73 (67.0%) |
| Business & Financial | 17 (20.0%) | 68 (80.0%) |
| Computers, Engineering & Science | 33 (86.8%) | 5 (13.2%) |
| Computers & Mathematics | 20 (100.0%) | 0 (0.0%) |
| Architecture & Engineering | 13 (72.2%) | 5 (27.8%) |
| Life, Physical & Social Science | 0 (0.0%) | 0 (0.0%) |
| Community & Social Service | 19 (13.8%) | 119 (86.2%) |
| Education, Arts & Media | 0 (0.0%) | 5 (100.0%) |
| Legal Services & Support | 0 (0.0%) | 6 (100.0%) |
| Education Instruction & Library | 16 (14.7%) | 93 (85.3%) |
| Arts, Media & Entertainment | 3 (16.7%) | 15 (83.3%) |
| Health Diagnosing & Treating | 0 (0.0%) | 62 (100.0%) |
| Health Technologists | 0 (0.0%) | 50 (100.0%) |
| Total (Category) | 105 (24.3%) | 327 (75.7%) |
| Total (Overall) | 491 (46.9%) | 557 (53.1%) |
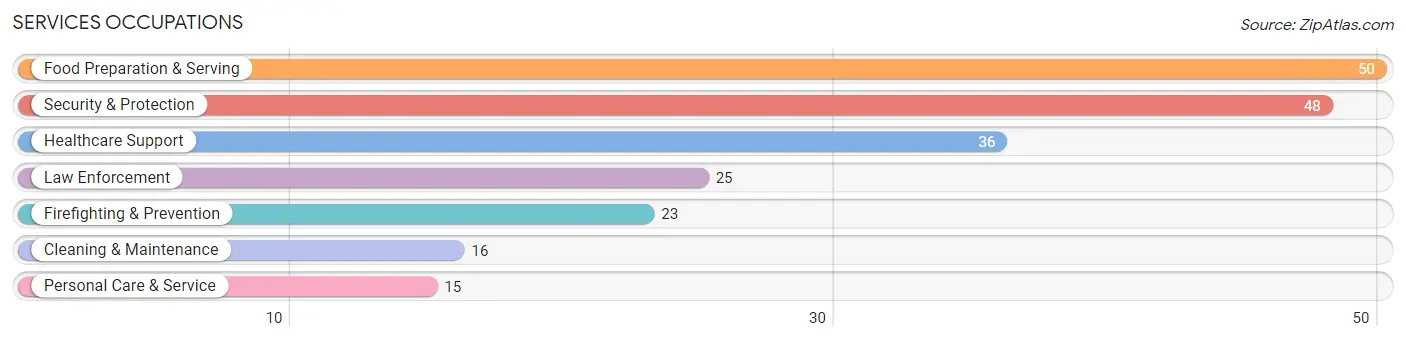
Services Occupations
The most common Services occupations in Brice Prairie are Food Preparation & Serving (50 | 4.8%), Security & Protection (48 | 4.6%), Healthcare Support (36 | 3.4%), Law Enforcement (25 | 2.4%), and Firefighting & Prevention (23 | 2.2%).
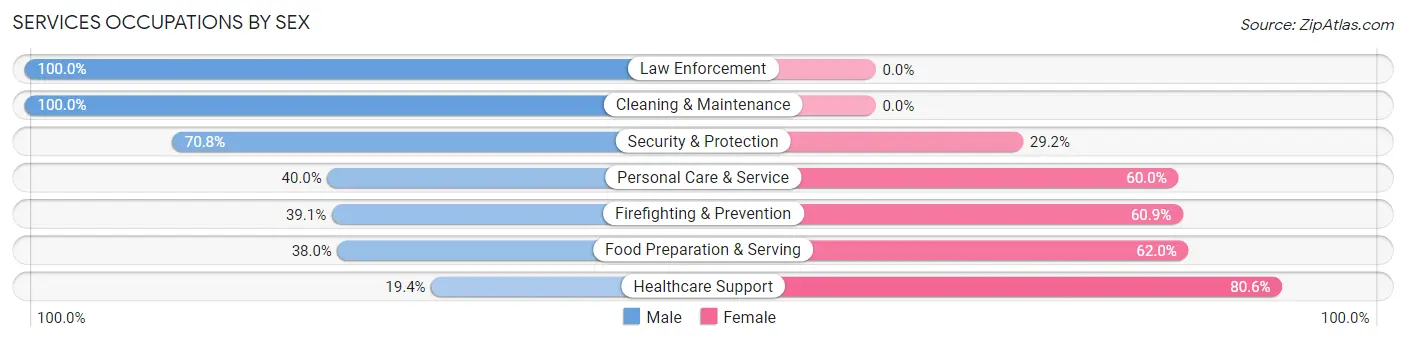
Services Occupations by Sex
Within the Services occupations in Brice Prairie, the most male-oriented occupations are Law Enforcement (100.0%), Cleaning & Maintenance (100.0%), and Security & Protection (70.8%), while the most female-oriented occupations are Healthcare Support (80.6%), Food Preparation & Serving (62.0%), and Firefighting & Prevention (60.9%).
| Occupation | Male | Female |
| Healthcare Support | 7 (19.4%) | 29 (80.6%) |
| Security & Protection | 34 (70.8%) | 14 (29.2%) |
| Firefighting & Prevention | 9 (39.1%) | 14 (60.9%) |
| Law Enforcement | 25 (100.0%) | 0 (0.0%) |
| Food Preparation & Serving | 19 (38.0%) | 31 (62.0%) |
| Cleaning & Maintenance | 16 (100.0%) | 0 (0.0%) |
| Personal Care & Service | 6 (40.0%) | 9 (60.0%) |
| Total (Category) | 82 (49.7%) | 83 (50.3%) |
| Total (Overall) | 491 (46.9%) | 557 (53.1%) |
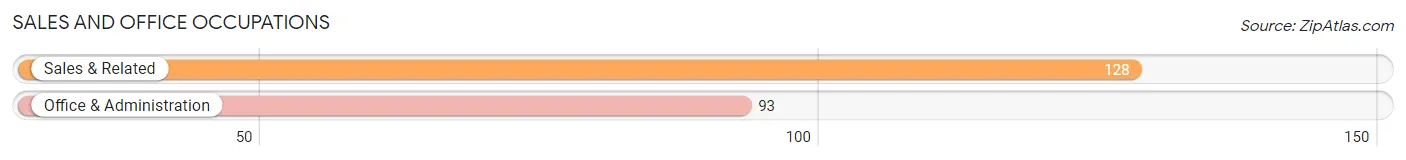
Sales and Office Occupations
The most common Sales and Office occupations in Brice Prairie are Sales & Related (128 | 12.2%), and Office & Administration (93 | 8.9%).
Sales and Office Occupations by Sex
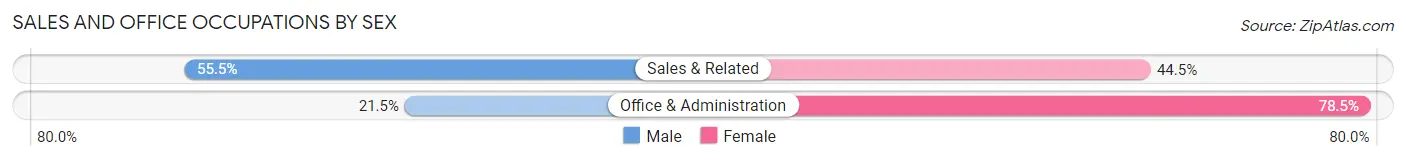
| Occupation | Male | Female |
| Sales & Related | 71 (55.5%) | 57 (44.5%) |
| Office & Administration | 20 (21.5%) | 73 (78.5%) |
| Total (Category) | 91 (41.2%) | 130 (58.8%) |
| Total (Overall) | 491 (46.9%) | 557 (53.1%) |
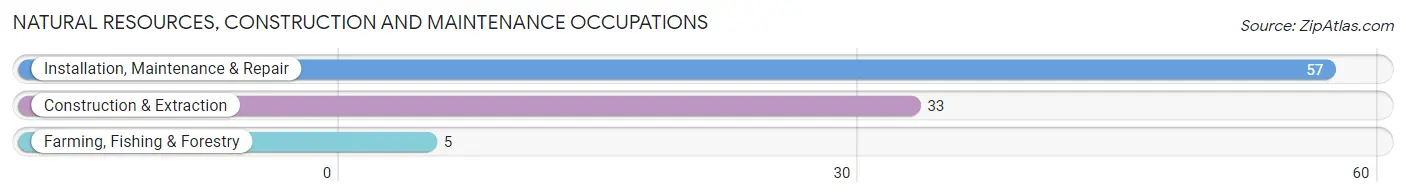
Natural Resources, Construction and Maintenance Occupations
The most common Natural Resources, Construction and Maintenance occupations in Brice Prairie are Installation, Maintenance & Repair (57 | 5.4%), Construction & Extraction (33 | 3.2%), and Farming, Fishing & Forestry (5 | 0.5%).
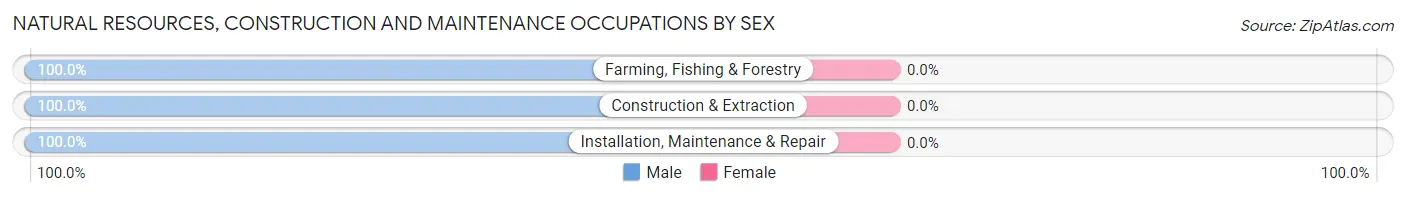
Natural Resources, Construction and Maintenance Occupations by Sex
| Occupation | Male | Female |
| Farming, Fishing & Forestry | 5 (100.0%) | 0 (0.0%) |
| Construction & Extraction | 33 (100.0%) | 0 (0.0%) |
| Installation, Maintenance & Repair | 57 (100.0%) | 0 (0.0%) |
| Total (Category) | 95 (100.0%) | 0 (0.0%) |
| Total (Overall) | 491 (46.9%) | 557 (53.1%) |
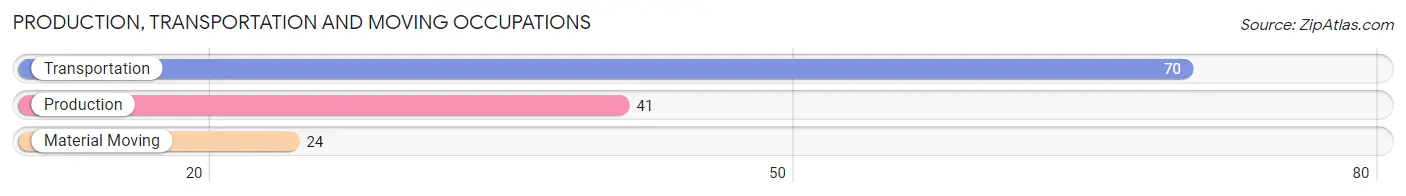
Production, Transportation and Moving Occupations
The most common Production, Transportation and Moving occupations in Brice Prairie are Transportation (70 | 6.7%), Production (41 | 3.9%), and Material Moving (24 | 2.3%).
Production, Transportation and Moving Occupations by Sex
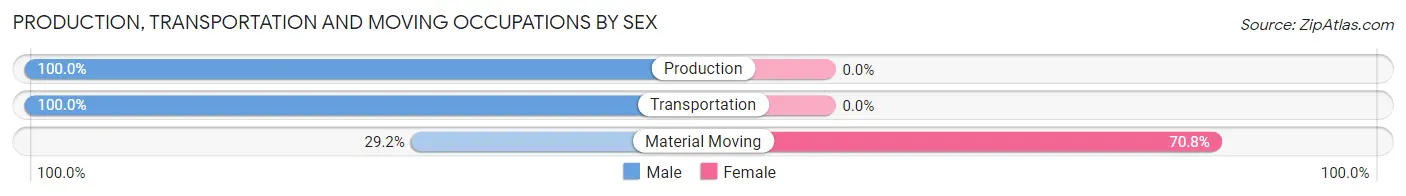
| Occupation | Male | Female |
| Production | 41 (100.0%) | 0 (0.0%) |
| Transportation | 70 (100.0%) | 0 (0.0%) |
| Material Moving | 7 (29.2%) | 17 (70.8%) |
| Total (Category) | 118 (87.4%) | 17 (12.6%) |
| Total (Overall) | 491 (46.9%) | 557 (53.1%) |
Employment Industries by Sex in Brice Prairie
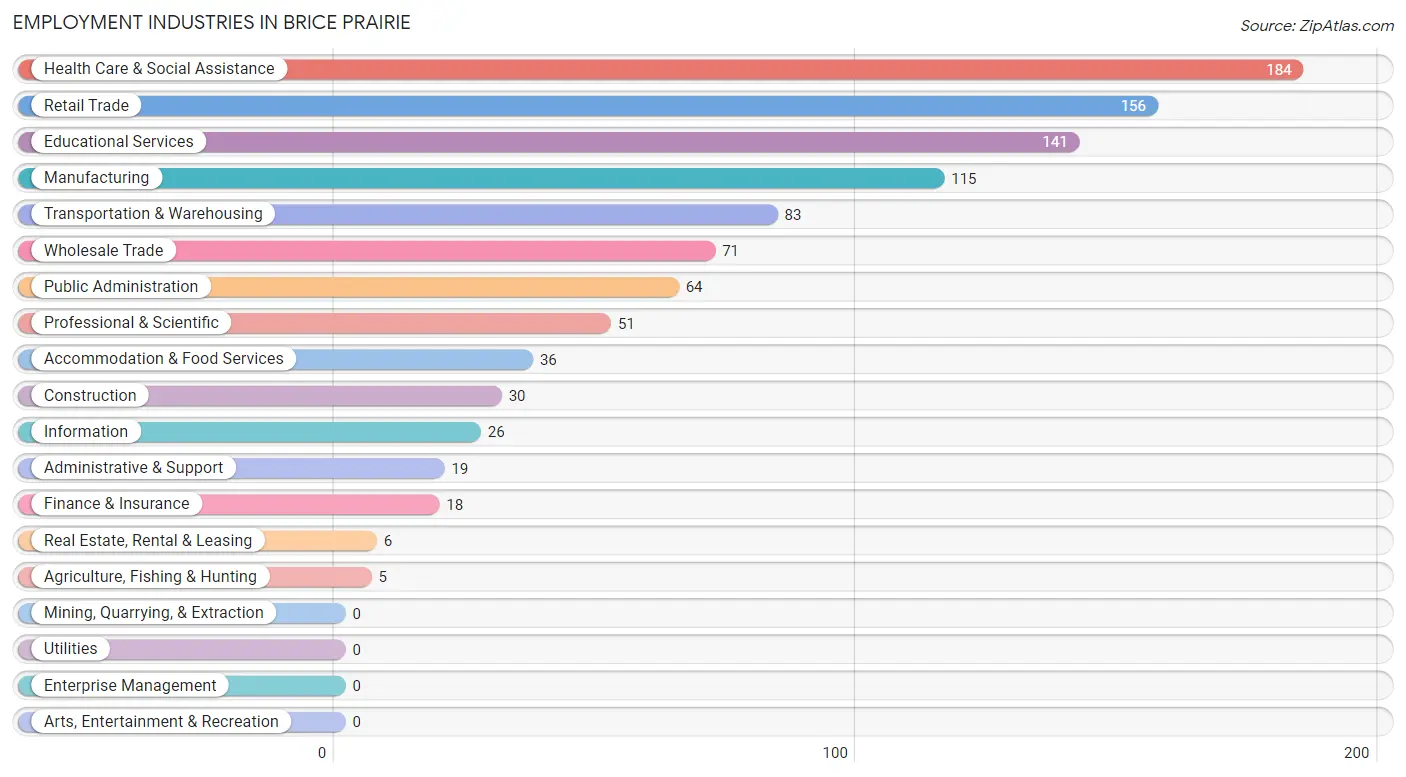
Employment Industries in Brice Prairie
The major employment industries in Brice Prairie include Health Care & Social Assistance (184 | 17.6%), Retail Trade (156 | 14.9%), Educational Services (141 | 13.5%), Manufacturing (115 | 11.0%), and Transportation & Warehousing (83 | 7.9%).
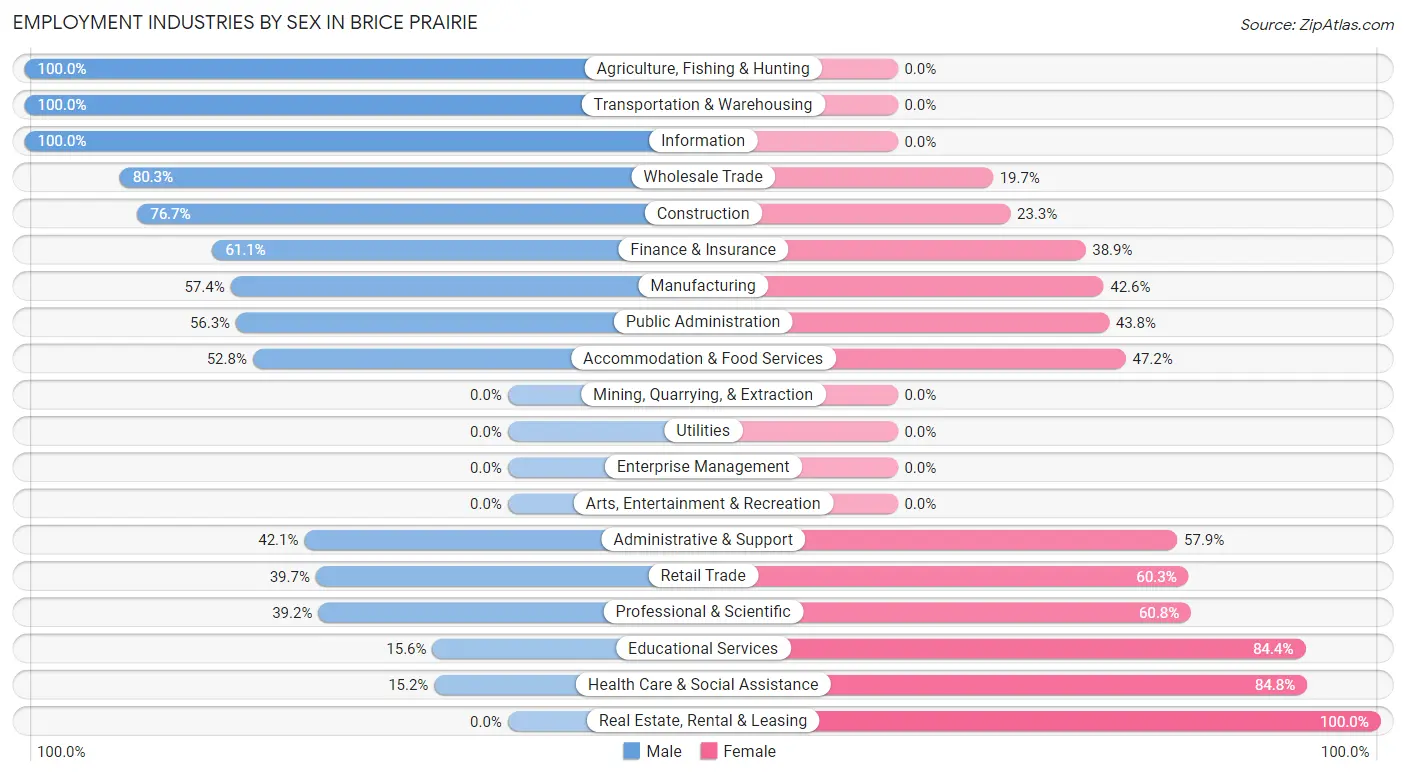
Employment Industries by Sex in Brice Prairie
The Brice Prairie industries that see more men than women are Agriculture, Fishing & Hunting (100.0%), Transportation & Warehousing (100.0%), and Information (100.0%), whereas the industries that tend to have a higher number of women are Real Estate, Rental & Leasing (100.0%), Health Care & Social Assistance (84.8%), and Educational Services (84.4%).
| Industry | Male | Female |
| Agriculture, Fishing & Hunting | 5 (100.0%) | 0 (0.0%) |
| Mining, Quarrying, & Extraction | 0 (0.0%) | 0 (0.0%) |
| Construction | 23 (76.7%) | 7 (23.3%) |
| Manufacturing | 66 (57.4%) | 49 (42.6%) |
| Wholesale Trade | 57 (80.3%) | 14 (19.7%) |
| Retail Trade | 62 (39.7%) | 94 (60.3%) |
| Transportation & Warehousing | 83 (100.0%) | 0 (0.0%) |
| Utilities | 0 (0.0%) | 0 (0.0%) |
| Information | 26 (100.0%) | 0 (0.0%) |
| Finance & Insurance | 11 (61.1%) | 7 (38.9%) |
| Real Estate, Rental & Leasing | 0 (0.0%) | 6 (100.0%) |
| Professional & Scientific | 20 (39.2%) | 31 (60.8%) |
| Enterprise Management | 0 (0.0%) | 0 (0.0%) |
| Administrative & Support | 8 (42.1%) | 11 (57.9%) |
| Educational Services | 22 (15.6%) | 119 (84.4%) |
| Health Care & Social Assistance | 28 (15.2%) | 156 (84.8%) |
| Arts, Entertainment & Recreation | 0 (0.0%) | 0 (0.0%) |
| Accommodation & Food Services | 19 (52.8%) | 17 (47.2%) |
| Public Administration | 36 (56.2%) | 28 (43.8%) |
| Total | 491 (46.9%) | 557 (53.1%) |
Education in Brice Prairie
School Enrollment in Brice Prairie
The most common levels of schooling among the 389 students in Brice Prairie are elementary school (113 | 29.0%), middle school (102 | 26.2%), and high school (76 | 19.5%).
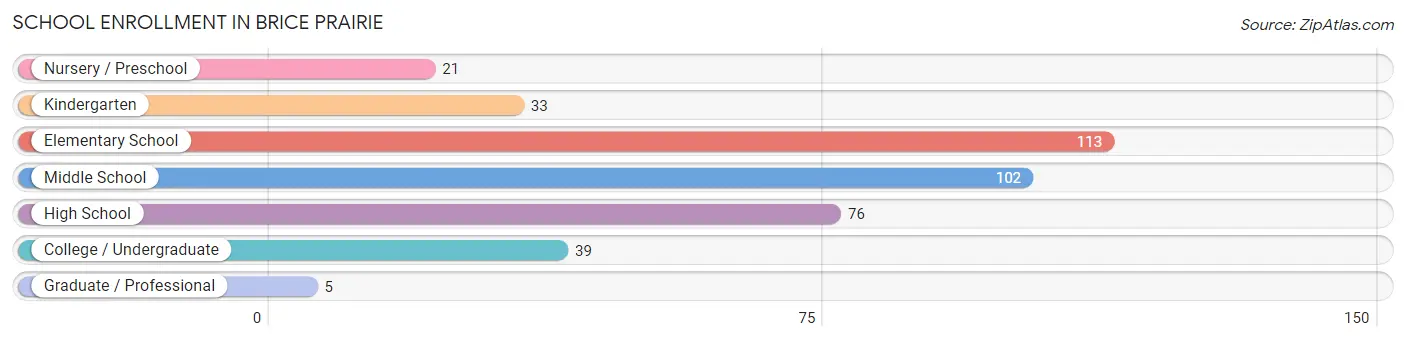
| School Level | # Students | % Students |
| Nursery / Preschool | 21 | 5.4% |
| Kindergarten | 33 | 8.5% |
| Elementary School | 113 | 29.0% |
| Middle School | 102 | 26.2% |
| High School | 76 | 19.5% |
| College / Undergraduate | 39 | 10.0% |
| Graduate / Professional | 5 | 1.3% |
| Total | 389 | 100.0% |
School Enrollment by Age by Funding Source in Brice Prairie
Out of a total of 389 students who are enrolled in schools in Brice Prairie, 58 (14.9%) attend a private institution, while the remaining 331 (85.1%) are enrolled in public schools. The age group of 3 to 4 year olds has the highest likelihood of being enrolled in private schools, with 8 (100.0% in the age bracket) enrolled. Conversely, the age group of 25 to 34 year olds has the lowest likelihood of being enrolled in a private school, with 11 (100.0% in the age bracket) attending a public institution.
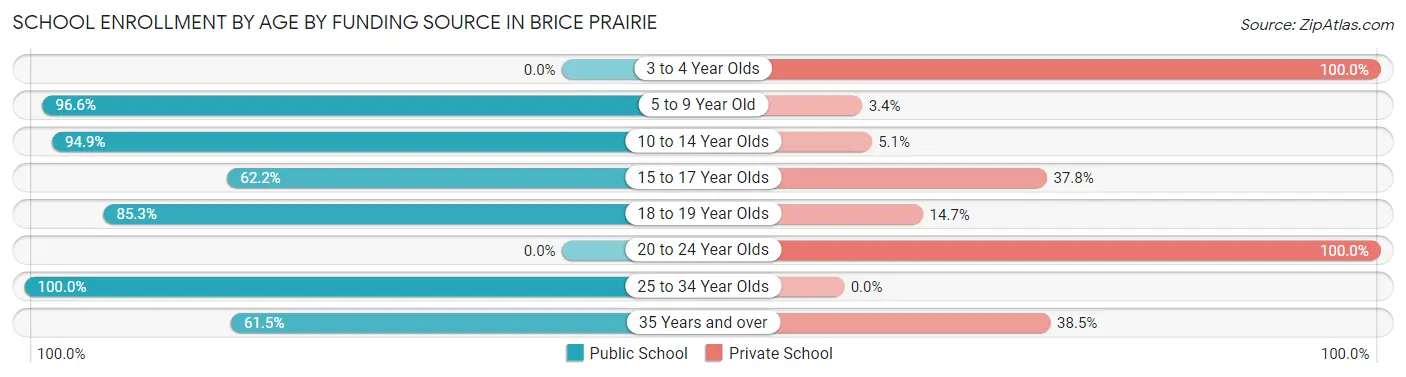
| Age Bracket | Public School | Private School |
| 3 to 4 Year Olds | 0 (0.0%) | 8 (100.0%) |
| 5 to 9 Year Old | 144 (96.6%) | 5 (3.4%) |
| 10 to 14 Year Olds | 111 (94.9%) | 6 (5.1%) |
| 15 to 17 Year Olds | 28 (62.2%) | 17 (37.8%) |
| 18 to 19 Year Olds | 29 (85.3%) | 5 (14.7%) |
| 20 to 24 Year Olds | 0 (0.0%) | 12 (100.0%) |
| 25 to 34 Year Olds | 11 (100.0%) | 0 (0.0%) |
| 35 Years and over | 8 (61.5%) | 5 (38.5%) |
| Total | 331 (85.1%) | 58 (14.9%) |
Educational Attainment by Field of Study in Brice Prairie
Science & technology (140 | 24.2%), business (128 | 22.1%), education (67 | 11.6%), bio, nature & agricultural (59 | 10.2%), and social sciences (54 | 9.3%) are the most common fields of study among 579 individuals in Brice Prairie who have obtained a bachelor's degree or higher.
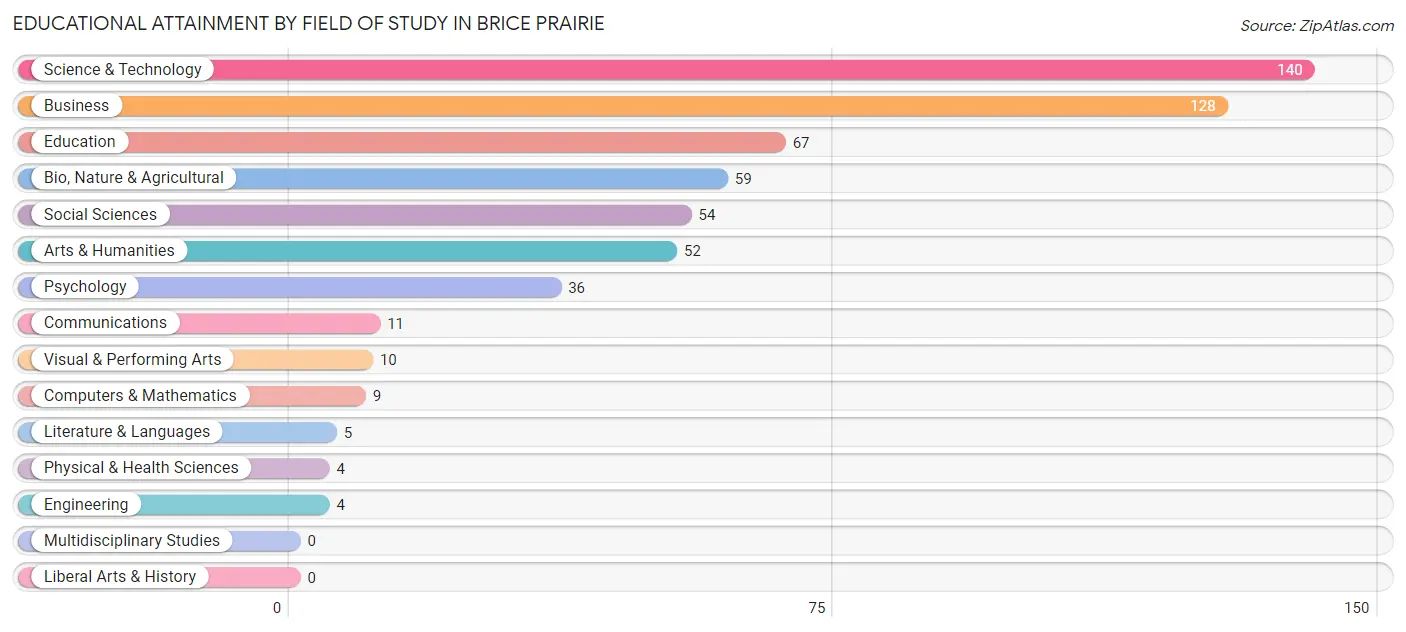
| Field of Study | # Graduates | % Graduates |
| Computers & Mathematics | 9 | 1.5% |
| Bio, Nature & Agricultural | 59 | 10.2% |
| Physical & Health Sciences | 4 | 0.7% |
| Psychology | 36 | 6.2% |
| Social Sciences | 54 | 9.3% |
| Engineering | 4 | 0.7% |
| Multidisciplinary Studies | 0 | 0.0% |
| Science & Technology | 140 | 24.2% |
| Business | 128 | 22.1% |
| Education | 67 | 11.6% |
| Literature & Languages | 5 | 0.9% |
| Liberal Arts & History | 0 | 0.0% |
| Visual & Performing Arts | 10 | 1.7% |
| Communications | 11 | 1.9% |
| Arts & Humanities | 52 | 9.0% |
| Total | 579 | 100.0% |
Transportation & Commute in Brice Prairie
Vehicle Availability by Sex in Brice Prairie
The most prevalent vehicle ownership categories in Brice Prairie are males with 2 vehicles (286, accounting for 58.3%) and females with 2 vehicles (345, making up 51.9%).
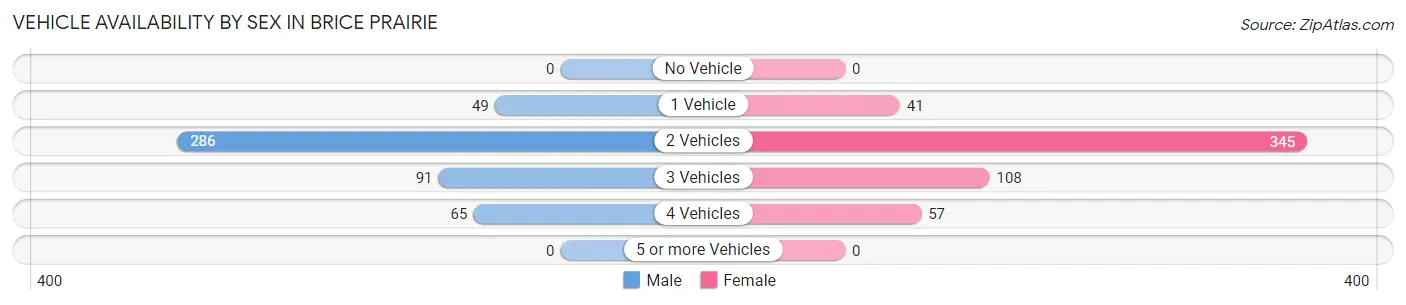
| Vehicles Available | Male | Female |
| No Vehicle | 0 (0.0%) | 0 (0.0%) |
| 1 Vehicle | 49 (10.0%) | 41 (7.4%) |
| 2 Vehicles | 286 (58.3%) | 345 (62.6%) |
| 3 Vehicles | 91 (18.5%) | 108 (19.6%) |
| 4 Vehicles | 65 (13.2%) | 57 (10.3%) |
| 5 or more Vehicles | 0 (0.0%) | 0 (0.0%) |
| Total | 491 (100.0%) | 551 (100.0%) |
Commute Time in Brice Prairie
The most frequently occuring commute durations in Brice Prairie are 20 to 24 minutes (218 commuters, 22.3%), 15 to 19 minutes (162 commuters, 16.6%), and 10 to 14 minutes (153 commuters, 15.7%).
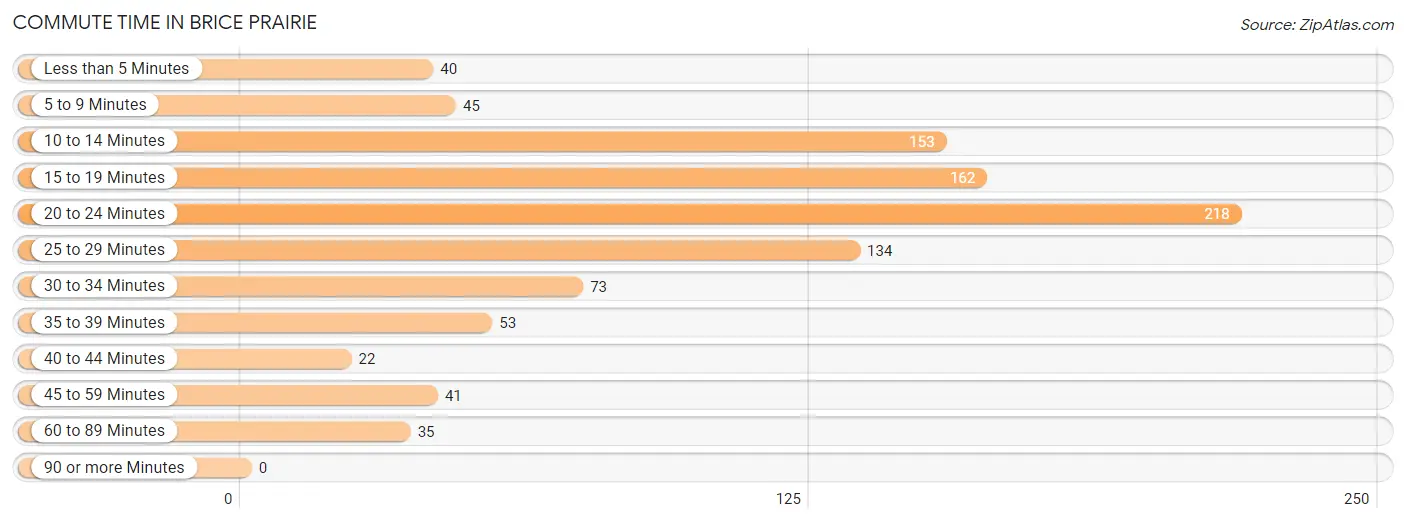
| Commute Time | # Commuters | % Commuters |
| Less than 5 Minutes | 40 | 4.1% |
| 5 to 9 Minutes | 45 | 4.6% |
| 10 to 14 Minutes | 153 | 15.7% |
| 15 to 19 Minutes | 162 | 16.6% |
| 20 to 24 Minutes | 218 | 22.3% |
| 25 to 29 Minutes | 134 | 13.7% |
| 30 to 34 Minutes | 73 | 7.5% |
| 35 to 39 Minutes | 53 | 5.4% |
| 40 to 44 Minutes | 22 | 2.2% |
| 45 to 59 Minutes | 41 | 4.2% |
| 60 to 89 Minutes | 35 | 3.6% |
| 90 or more Minutes | 0 | 0.0% |
Commute Time by Sex in Brice Prairie
The most common commute times in Brice Prairie are 20 to 24 minutes (120 commuters, 25.8%) for males and 10 to 14 minutes (103 commuters, 20.2%) for females.
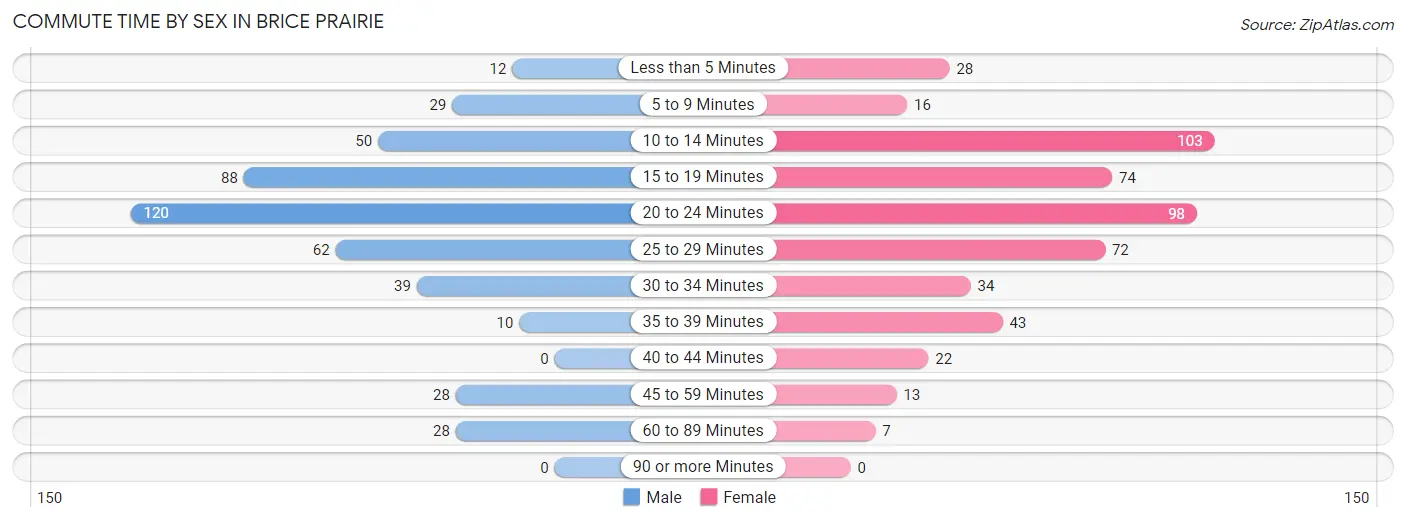
| Commute Time | Male | Female |
| Less than 5 Minutes | 12 (2.6%) | 28 (5.5%) |
| 5 to 9 Minutes | 29 (6.2%) | 16 (3.1%) |
| 10 to 14 Minutes | 50 (10.7%) | 103 (20.2%) |
| 15 to 19 Minutes | 88 (18.9%) | 74 (14.5%) |
| 20 to 24 Minutes | 120 (25.8%) | 98 (19.2%) |
| 25 to 29 Minutes | 62 (13.3%) | 72 (14.1%) |
| 30 to 34 Minutes | 39 (8.4%) | 34 (6.7%) |
| 35 to 39 Minutes | 10 (2.1%) | 43 (8.4%) |
| 40 to 44 Minutes | 0 (0.0%) | 22 (4.3%) |
| 45 to 59 Minutes | 28 (6.0%) | 13 (2.5%) |
| 60 to 89 Minutes | 28 (6.0%) | 7 (1.4%) |
| 90 or more Minutes | 0 (0.0%) | 0 (0.0%) |
Time of Departure to Work by Sex in Brice Prairie
The most frequent times of departure to work in Brice Prairie are 7:00 AM to 7:29 AM (94, 20.2%) for males and 7:00 AM to 7:29 AM (127, 24.9%) for females.
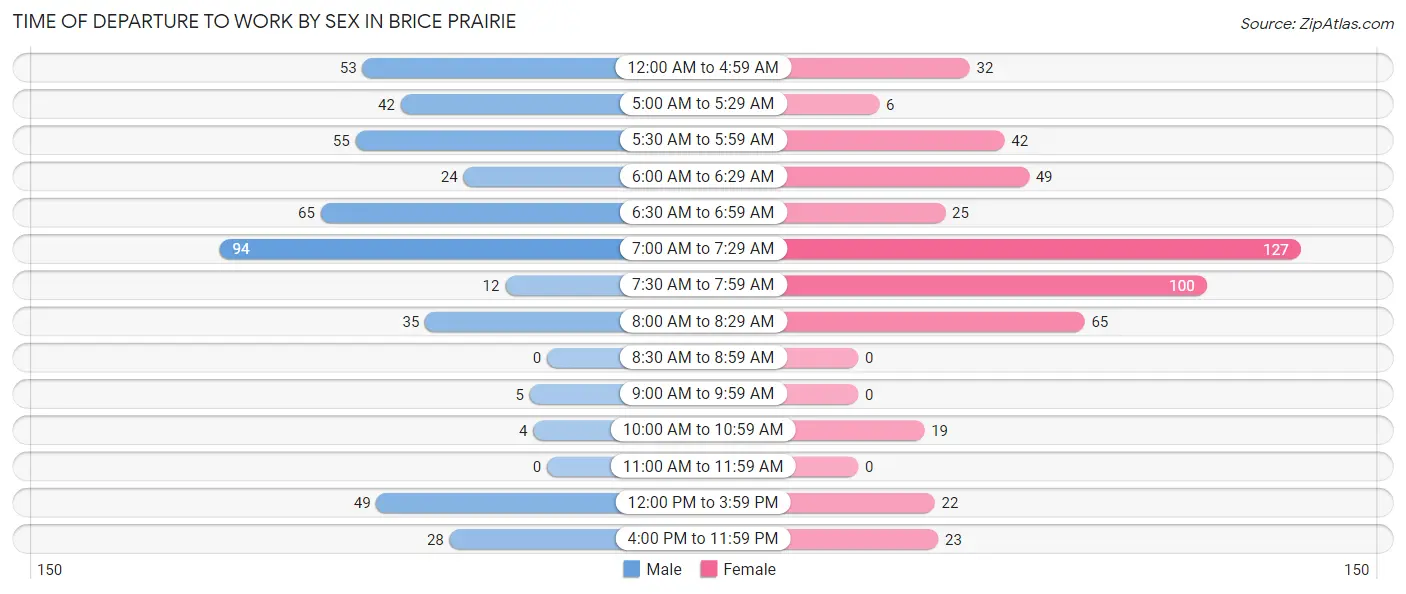
| Time of Departure | Male | Female |
| 12:00 AM to 4:59 AM | 53 (11.4%) | 32 (6.3%) |
| 5:00 AM to 5:29 AM | 42 (9.0%) | 6 (1.2%) |
| 5:30 AM to 5:59 AM | 55 (11.8%) | 42 (8.2%) |
| 6:00 AM to 6:29 AM | 24 (5.1%) | 49 (9.6%) |
| 6:30 AM to 6:59 AM | 65 (14.0%) | 25 (4.9%) |
| 7:00 AM to 7:29 AM | 94 (20.2%) | 127 (24.9%) |
| 7:30 AM to 7:59 AM | 12 (2.6%) | 100 (19.6%) |
| 8:00 AM to 8:29 AM | 35 (7.5%) | 65 (12.8%) |
| 8:30 AM to 8:59 AM | 0 (0.0%) | 0 (0.0%) |
| 9:00 AM to 9:59 AM | 5 (1.1%) | 0 (0.0%) |
| 10:00 AM to 10:59 AM | 4 (0.9%) | 19 (3.7%) |
| 11:00 AM to 11:59 AM | 0 (0.0%) | 0 (0.0%) |
| 12:00 PM to 3:59 PM | 49 (10.5%) | 22 (4.3%) |
| 4:00 PM to 11:59 PM | 28 (6.0%) | 23 (4.5%) |
| Total | 466 (100.0%) | 510 (100.0%) |
Housing Occupancy in Brice Prairie
Occupancy by Ownership in Brice Prairie
Of the total 751 dwellings in Brice Prairie, owner-occupied units account for 696 (92.7%), while renter-occupied units make up 55 (7.3%).
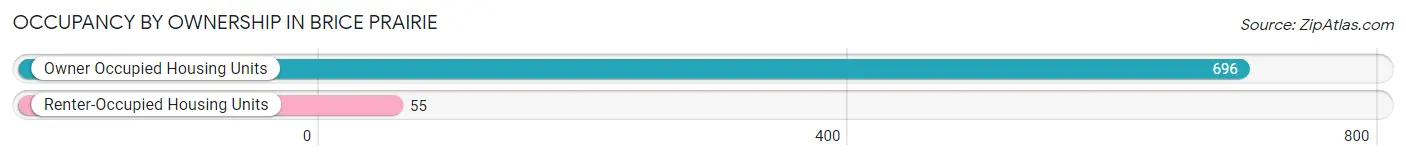
| Occupancy | # Housing Units | % Housing Units |
| Owner Occupied Housing Units | 696 | 92.7% |
| Renter-Occupied Housing Units | 55 | 7.3% |
| Total Occupied Housing Units | 751 | 100.0% |
Occupancy by Household Size in Brice Prairie
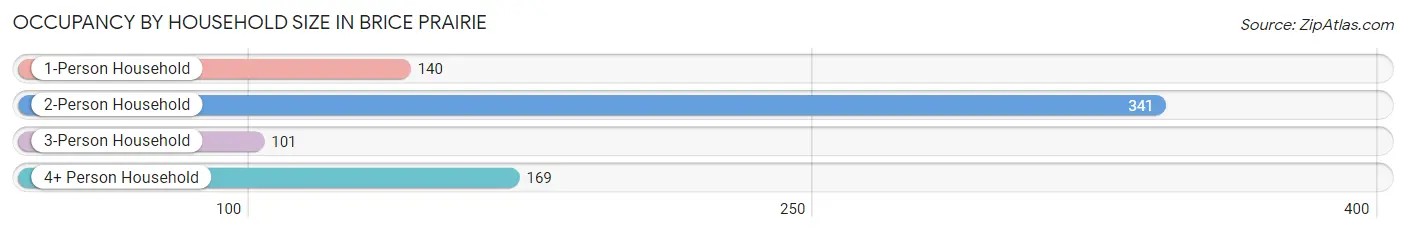
| Household Size | # Housing Units | % Housing Units |
| 1-Person Household | 140 | 18.6% |
| 2-Person Household | 341 | 45.4% |
| 3-Person Household | 101 | 13.5% |
| 4+ Person Household | 169 | 22.5% |
| Total Housing Units | 751 | 100.0% |
Occupancy by Ownership by Household Size in Brice Prairie
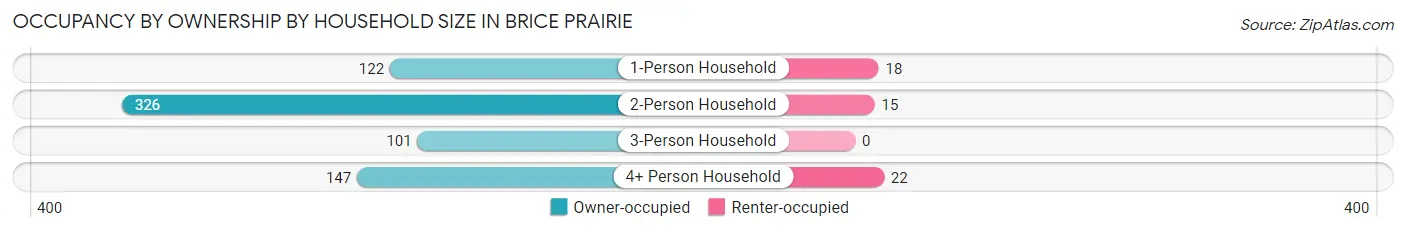
| Household Size | Owner-occupied | Renter-occupied |
| 1-Person Household | 122 (87.1%) | 18 (12.9%) |
| 2-Person Household | 326 (95.6%) | 15 (4.4%) |
| 3-Person Household | 101 (100.0%) | 0 (0.0%) |
| 4+ Person Household | 147 (87.0%) | 22 (13.0%) |
| Total Housing Units | 696 (92.7%) | 55 (7.3%) |
Occupancy by Educational Attainment in Brice Prairie
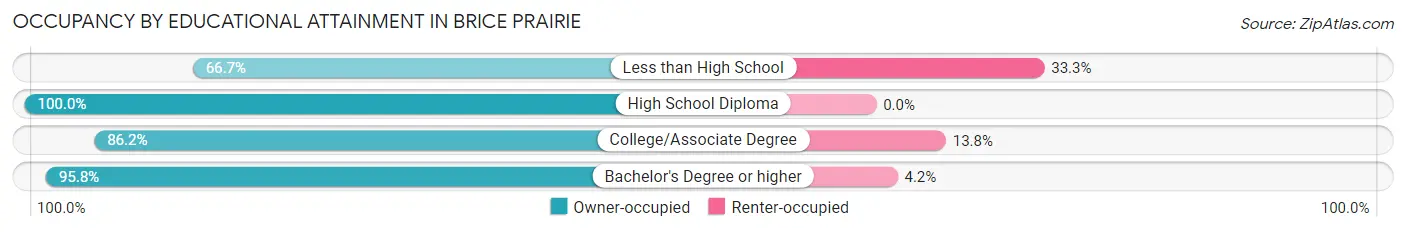
| Household Size | Owner-occupied | Renter-occupied |
| Less than High School | 10 (66.7%) | 5 (33.3%) |
| High School Diploma | 161 (100.0%) | 0 (0.0%) |
| College/Associate Degree | 231 (86.2%) | 37 (13.8%) |
| Bachelor's Degree or higher | 294 (95.8%) | 13 (4.2%) |
Occupancy by Age of Householder in Brice Prairie
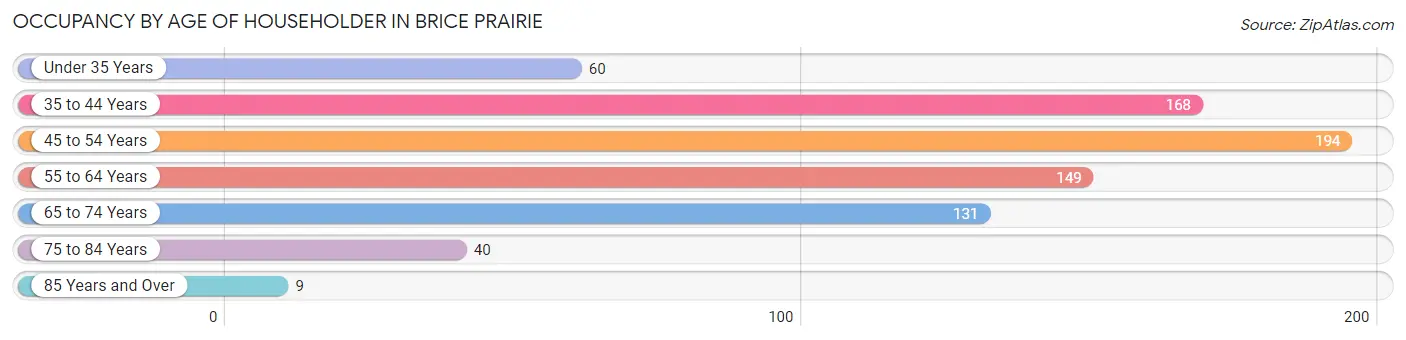
| Age Bracket | # Households | % Households |
| Under 35 Years | 60 | 8.0% |
| 35 to 44 Years | 168 | 22.4% |
| 45 to 54 Years | 194 | 25.8% |
| 55 to 64 Years | 149 | 19.8% |
| 65 to 74 Years | 131 | 17.4% |
| 75 to 84 Years | 40 | 5.3% |
| 85 Years and Over | 9 | 1.2% |
| Total | 751 | 100.0% |
Housing Finances in Brice Prairie
Median Income by Occupancy in Brice Prairie
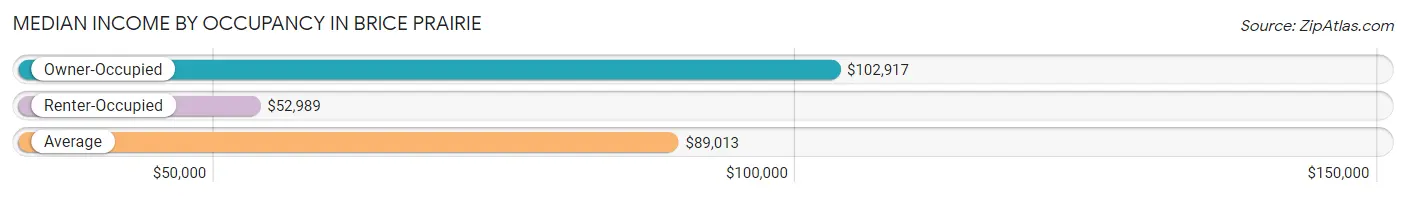
| Occupancy Type | # Households | Median Income |
| Owner-Occupied | 696 (92.7%) | $102,917 |
| Renter-Occupied | 55 (7.3%) | $52,989 |
| Average | 751 (100.0%) | $89,013 |
Occupancy by Householder Income Bracket in Brice Prairie
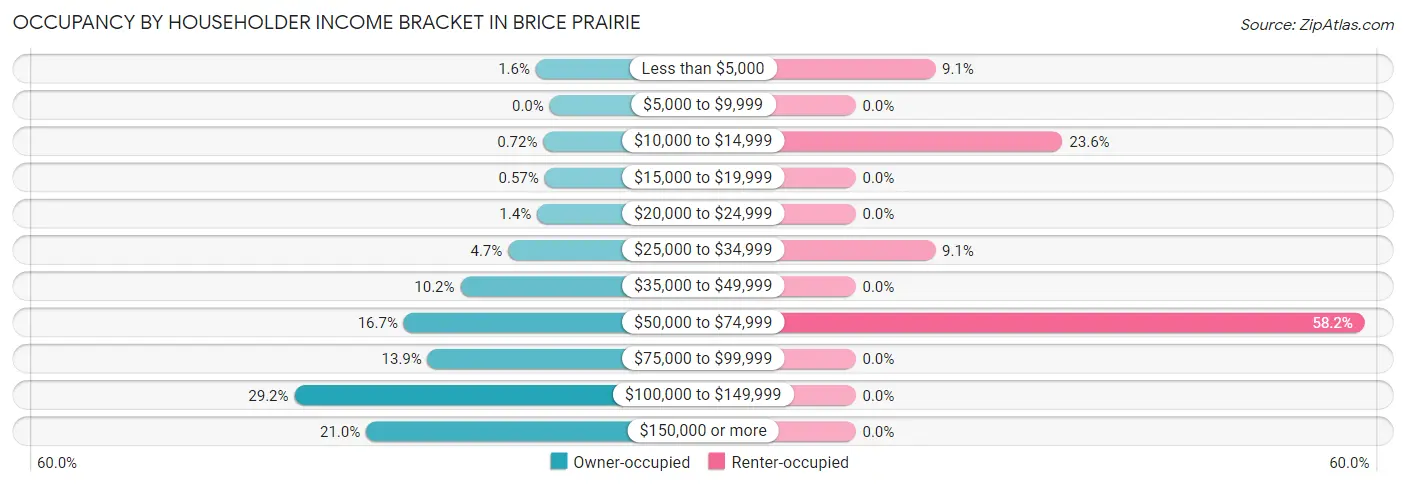
| Income Bracket | Owner-occupied | Renter-occupied |
| Less than $5,000 | 11 (1.6%) | 5 (9.1%) |
| $5,000 to $9,999 | 0 (0.0%) | 0 (0.0%) |
| $10,000 to $14,999 | 5 (0.7%) | 13 (23.6%) |
| $15,000 to $19,999 | 4 (0.6%) | 0 (0.0%) |
| $20,000 to $24,999 | 10 (1.4%) | 0 (0.0%) |
| $25,000 to $34,999 | 33 (4.7%) | 5 (9.1%) |
| $35,000 to $49,999 | 71 (10.2%) | 0 (0.0%) |
| $50,000 to $74,999 | 116 (16.7%) | 32 (58.2%) |
| $75,000 to $99,999 | 97 (13.9%) | 0 (0.0%) |
| $100,000 to $149,999 | 203 (29.2%) | 0 (0.0%) |
| $150,000 or more | 146 (21.0%) | 0 (0.0%) |
| Total | 696 (100.0%) | 55 (100.0%) |
Monthly Housing Cost Tiers in Brice Prairie
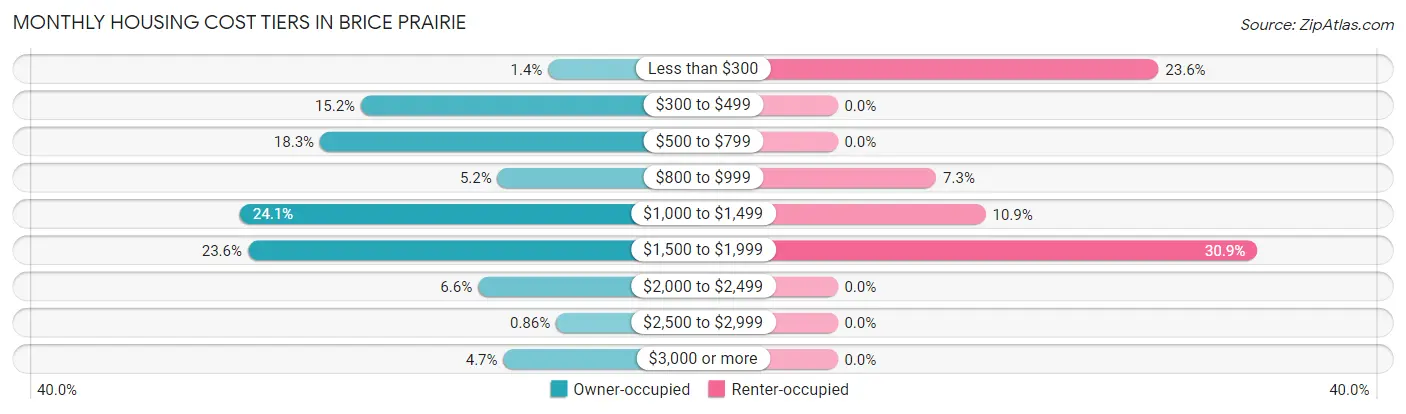
| Monthly Cost | Owner-occupied | Renter-occupied |
| Less than $300 | 10 (1.4%) | 13 (23.6%) |
| $300 to $499 | 106 (15.2%) | 0 (0.0%) |
| $500 to $799 | 127 (18.2%) | 0 (0.0%) |
| $800 to $999 | 36 (5.2%) | 4 (7.3%) |
| $1,000 to $1,499 | 168 (24.1%) | 6 (10.9%) |
| $1,500 to $1,999 | 164 (23.6%) | 17 (30.9%) |
| $2,000 to $2,499 | 46 (6.6%) | 0 (0.0%) |
| $2,500 to $2,999 | 6 (0.9%) | 0 (0.0%) |
| $3,000 or more | 33 (4.7%) | 0 (0.0%) |
| Total | 696 (100.0%) | 55 (100.0%) |
Physical Housing Characteristics in Brice Prairie
Housing Structures in Brice Prairie
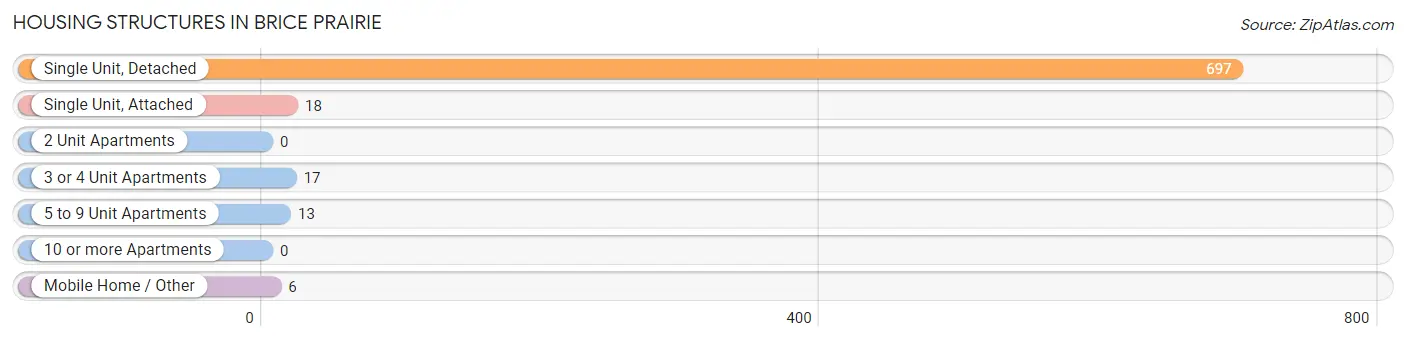
| Structure Type | # Housing Units | % Housing Units |
| Single Unit, Detached | 697 | 92.8% |
| Single Unit, Attached | 18 | 2.4% |
| 2 Unit Apartments | 0 | 0.0% |
| 3 or 4 Unit Apartments | 17 | 2.3% |
| 5 to 9 Unit Apartments | 13 | 1.7% |
| 10 or more Apartments | 0 | 0.0% |
| Mobile Home / Other | 6 | 0.8% |
| Total | 751 | 100.0% |
Housing Structures by Occupancy in Brice Prairie
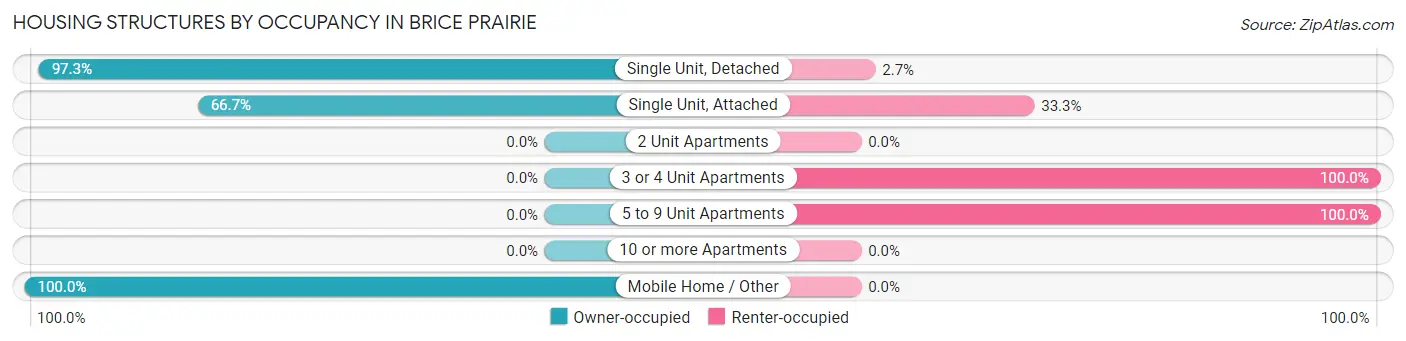
| Structure Type | Owner-occupied | Renter-occupied |
| Single Unit, Detached | 678 (97.3%) | 19 (2.7%) |
| Single Unit, Attached | 12 (66.7%) | 6 (33.3%) |
| 2 Unit Apartments | 0 (0.0%) | 0 (0.0%) |
| 3 or 4 Unit Apartments | 0 (0.0%) | 17 (100.0%) |
| 5 to 9 Unit Apartments | 0 (0.0%) | 13 (100.0%) |
| 10 or more Apartments | 0 (0.0%) | 0 (0.0%) |
| Mobile Home / Other | 6 (100.0%) | 0 (0.0%) |
| Total | 696 (92.7%) | 55 (7.3%) |
Housing Structures by Number of Rooms in Brice Prairie
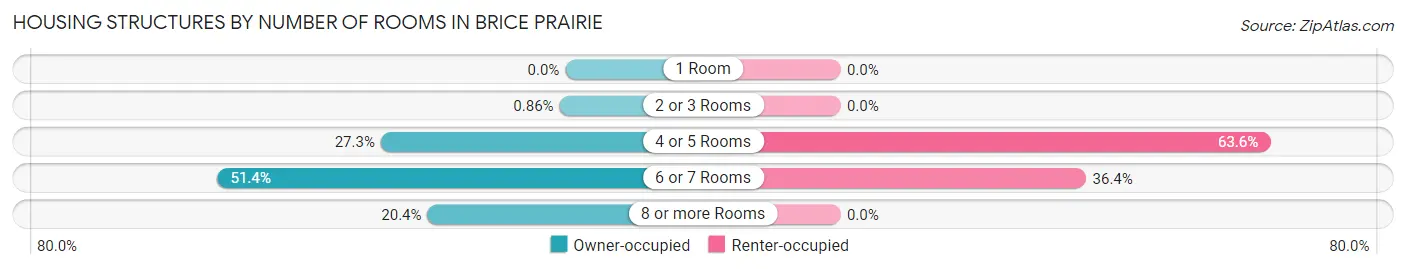
| Number of Rooms | Owner-occupied | Renter-occupied |
| 1 Room | 0 (0.0%) | 0 (0.0%) |
| 2 or 3 Rooms | 6 (0.9%) | 0 (0.0%) |
| 4 or 5 Rooms | 190 (27.3%) | 35 (63.6%) |
| 6 or 7 Rooms | 358 (51.4%) | 20 (36.4%) |
| 8 or more Rooms | 142 (20.4%) | 0 (0.0%) |
| Total | 696 (100.0%) | 55 (100.0%) |
Housing Structure by Heating Type in Brice Prairie
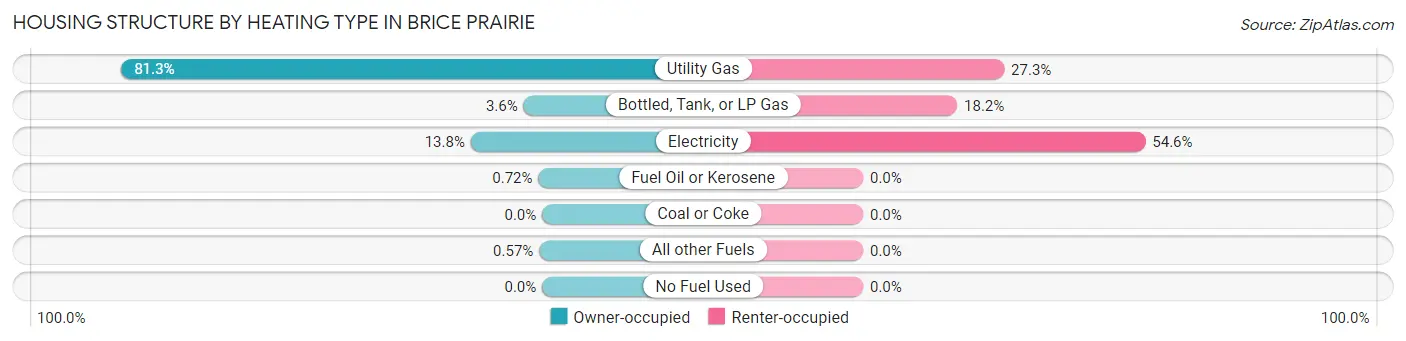
| Heating Type | Owner-occupied | Renter-occupied |
| Utility Gas | 566 (81.3%) | 15 (27.3%) |
| Bottled, Tank, or LP Gas | 25 (3.6%) | 10 (18.2%) |
| Electricity | 96 (13.8%) | 30 (54.5%) |
| Fuel Oil or Kerosene | 5 (0.7%) | 0 (0.0%) |
| Coal or Coke | 0 (0.0%) | 0 (0.0%) |
| All other Fuels | 4 (0.6%) | 0 (0.0%) |
| No Fuel Used | 0 (0.0%) | 0 (0.0%) |
| Total | 696 (100.0%) | 55 (100.0%) |
Household Vehicle Usage in Brice Prairie
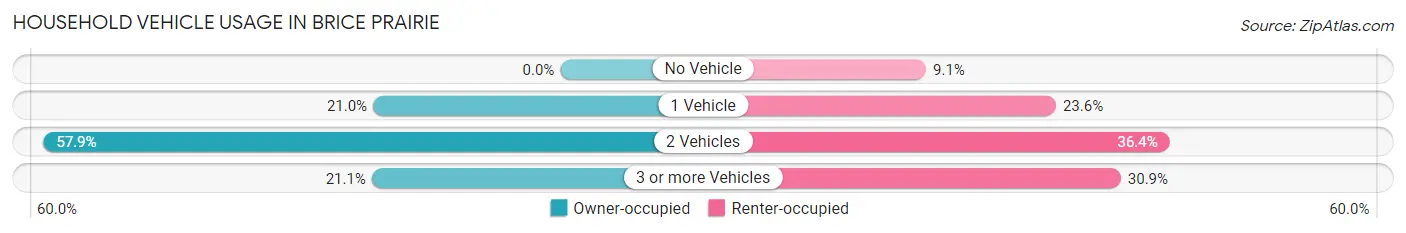
| Vehicles per Household | Owner-occupied | Renter-occupied |
| No Vehicle | 0 (0.0%) | 5 (9.1%) |
| 1 Vehicle | 146 (21.0%) | 13 (23.6%) |
| 2 Vehicles | 403 (57.9%) | 20 (36.4%) |
| 3 or more Vehicles | 147 (21.1%) | 17 (30.9%) |
| Total | 696 (100.0%) | 55 (100.0%) |
Real Estate & Mortgages in Brice Prairie
Real Estate and Mortgage Overview in Brice Prairie
| Characteristic | Without Mortgage | With Mortgage |
| Housing Units | 256 | 440 |
| Median Property Value | $218,400 | $261,100 |
| Median Household Income | $87,083 | $93 |
| Monthly Housing Costs | $521 | $30 |
| Real Estate Taxes | $2,781 | $5 |
Property Value by Mortgage Status in Brice Prairie
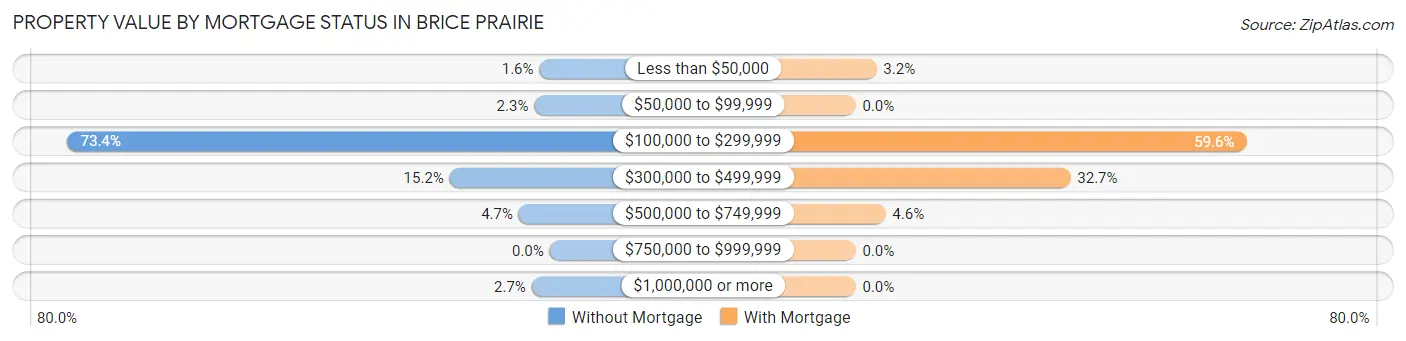
| Property Value | Without Mortgage | With Mortgage |
| Less than $50,000 | 4 (1.6%) | 14 (3.2%) |
| $50,000 to $99,999 | 6 (2.3%) | 0 (0.0%) |
| $100,000 to $299,999 | 188 (73.4%) | 262 (59.6%) |
| $300,000 to $499,999 | 39 (15.2%) | 144 (32.7%) |
| $500,000 to $749,999 | 12 (4.7%) | 20 (4.5%) |
| $750,000 to $999,999 | 0 (0.0%) | 0 (0.0%) |
| $1,000,000 or more | 7 (2.7%) | 0 (0.0%) |
| Total | 256 (100.0%) | 440 (100.0%) |
Household Income by Mortgage Status in Brice Prairie
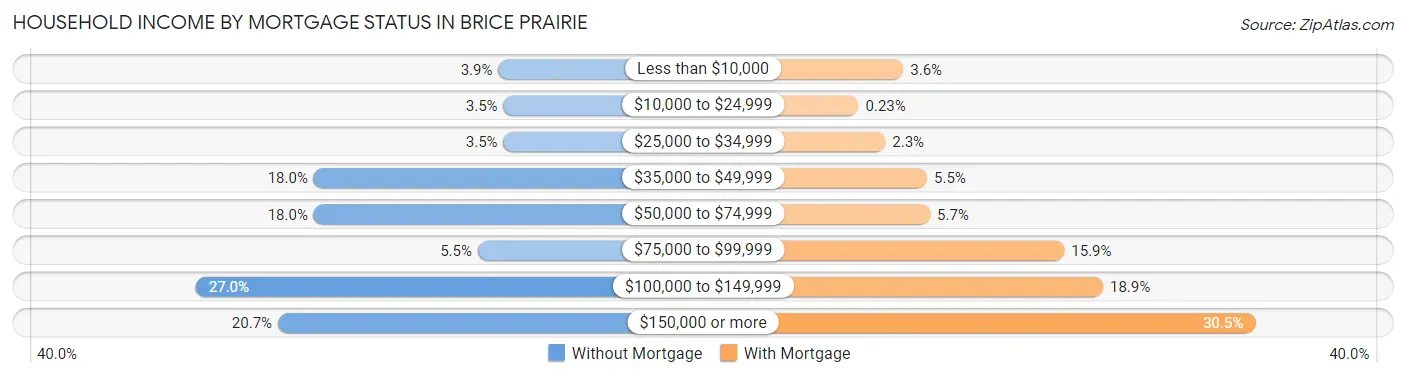
| Household Income | Without Mortgage | With Mortgage |
| Less than $10,000 | 10 (3.9%) | 16 (3.6%) |
| $10,000 to $24,999 | 9 (3.5%) | 1 (0.2%) |
| $25,000 to $34,999 | 9 (3.5%) | 10 (2.3%) |
| $35,000 to $49,999 | 46 (18.0%) | 24 (5.4%) |
| $50,000 to $74,999 | 46 (18.0%) | 25 (5.7%) |
| $75,000 to $99,999 | 14 (5.5%) | 70 (15.9%) |
| $100,000 to $149,999 | 69 (27.0%) | 83 (18.9%) |
| $150,000 or more | 53 (20.7%) | 134 (30.4%) |
| Total | 256 (100.0%) | 440 (100.0%) |
Property Value to Household Income Ratio in Brice Prairie
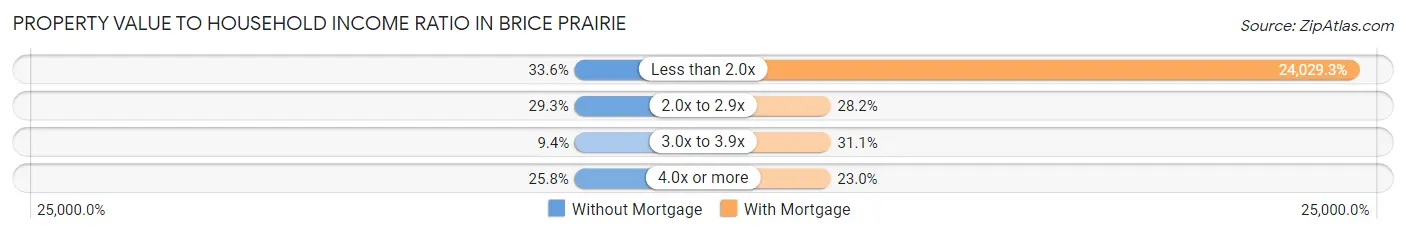
| Value-to-Income Ratio | Without Mortgage | With Mortgage |
| Less than 2.0x | 86 (33.6%) | 105,729 (24,029.3%) |
| 2.0x to 2.9x | 75 (29.3%) | 124 (28.2%) |
| 3.0x to 3.9x | 24 (9.4%) | 137 (31.1%) |
| 4.0x or more | 66 (25.8%) | 101 (23.0%) |
| Total | 256 (100.0%) | 440 (100.0%) |
Real Estate Taxes by Mortgage Status in Brice Prairie
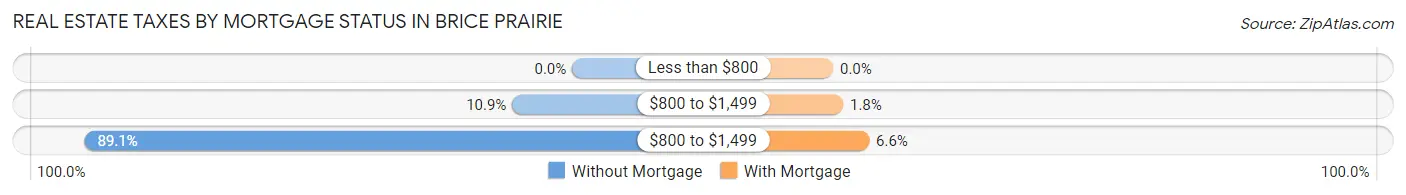
| Property Taxes | Without Mortgage | With Mortgage |
| Less than $800 | 0 (0.0%) | 0 (0.0%) |
| $800 to $1,499 | 28 (10.9%) | 8 (1.8%) |
| $800 to $1,499 | 228 (89.1%) | 29 (6.6%) |
| Total | 256 (100.0%) | 440 (100.0%) |
Health & Disability in Brice Prairie
Health Insurance Coverage by Age in Brice Prairie
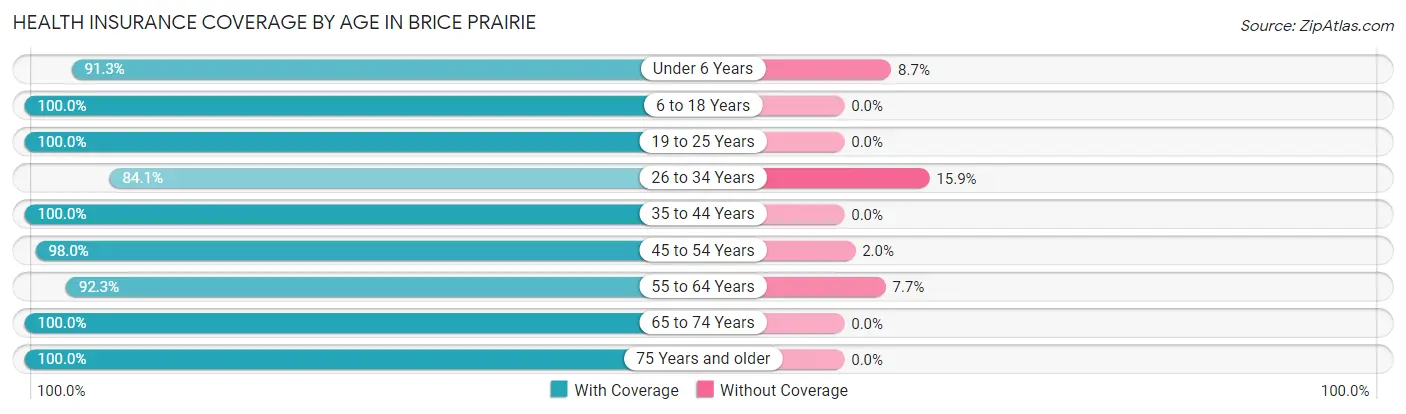
| Age Bracket | With Coverage | Without Coverage |
| Under 6 Years | 94 (91.3%) | 9 (8.7%) |
| 6 to 18 Years | 313 (100.0%) | 0 (0.0%) |
| 19 to 25 Years | 79 (100.0%) | 0 (0.0%) |
| 26 to 34 Years | 106 (84.1%) | 20 (15.9%) |
| 35 to 44 Years | 294 (100.0%) | 0 (0.0%) |
| 45 to 54 Years | 338 (98.0%) | 7 (2.0%) |
| 55 to 64 Years | 264 (92.3%) | 22 (7.7%) |
| 65 to 74 Years | 322 (100.0%) | 0 (0.0%) |
| 75 Years and older | 77 (100.0%) | 0 (0.0%) |
| Total | 1,887 (97.0%) | 58 (3.0%) |
Health Insurance Coverage by Citizenship Status in Brice Prairie
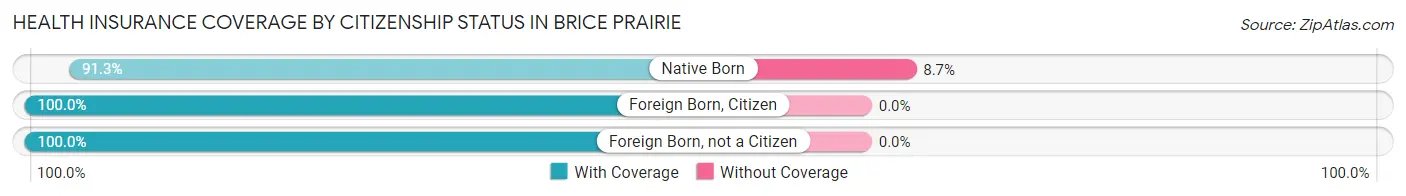
| Citizenship Status | With Coverage | Without Coverage |
| Native Born | 94 (91.3%) | 9 (8.7%) |
| Foreign Born, Citizen | 313 (100.0%) | 0 (0.0%) |
| Foreign Born, not a Citizen | 79 (100.0%) | 0 (0.0%) |
Health Insurance Coverage by Household Income in Brice Prairie
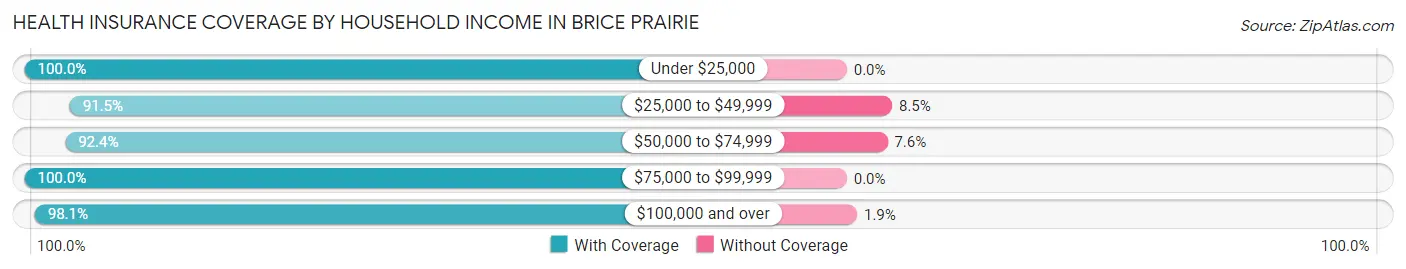
| Household Income | With Coverage | Without Coverage |
| Under $25,000 | 57 (100.0%) | 0 (0.0%) |
| $25,000 to $49,999 | 151 (91.5%) | 14 (8.5%) |
| $50,000 to $74,999 | 291 (92.4%) | 24 (7.6%) |
| $75,000 to $99,999 | 367 (100.0%) | 0 (0.0%) |
| $100,000 and over | 1,021 (98.1%) | 20 (1.9%) |
Public vs Private Health Insurance Coverage by Age in Brice Prairie
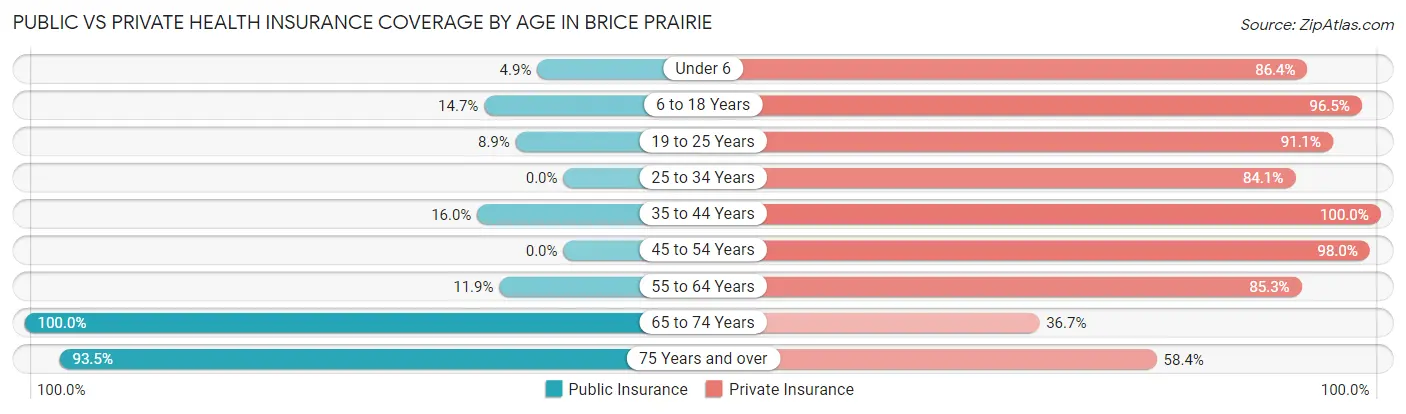
| Age Bracket | Public Insurance | Private Insurance |
| Under 6 | 5 (4.9%) | 89 (86.4%) |
| 6 to 18 Years | 46 (14.7%) | 302 (96.5%) |
| 19 to 25 Years | 7 (8.9%) | 72 (91.1%) |
| 25 to 34 Years | 0 (0.0%) | 106 (84.1%) |
| 35 to 44 Years | 47 (16.0%) | 294 (100.0%) |
| 45 to 54 Years | 0 (0.0%) | 338 (98.0%) |
| 55 to 64 Years | 34 (11.9%) | 244 (85.3%) |
| 65 to 74 Years | 322 (100.0%) | 118 (36.6%) |
| 75 Years and over | 72 (93.5%) | 45 (58.4%) |
| Total | 533 (27.4%) | 1,608 (82.7%) |
Disability Status by Sex by Age in Brice Prairie
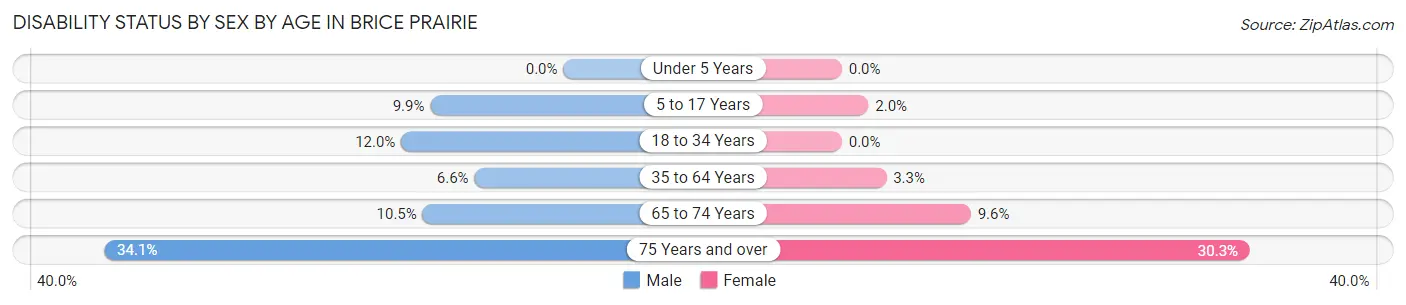
| Age Bracket | Male | Female |
| Under 5 Years | 0 (0.0%) | 0 (0.0%) |
| 5 to 17 Years | 16 (9.9%) | 3 (2.0%) |
| 18 to 34 Years | 13 (12.0%) | 0 (0.0%) |
| 35 to 64 Years | 31 (6.6%) | 15 (3.3%) |
| 65 to 74 Years | 14 (10.4%) | 18 (9.6%) |
| 75 Years and over | 15 (34.1%) | 10 (30.3%) |
Disability Class by Sex by Age in Brice Prairie
Disability Class: Hearing Difficulty
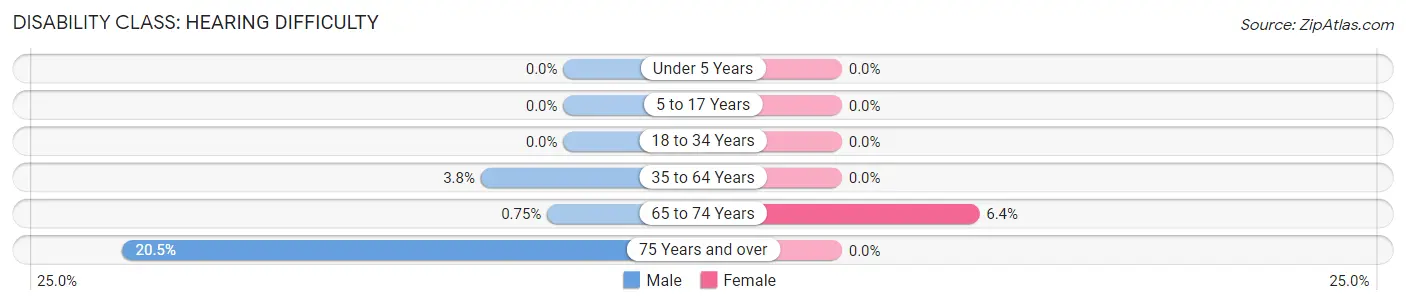
| Age Bracket | Male | Female |
| Under 5 Years | 0 (0.0%) | 0 (0.0%) |
| 5 to 17 Years | 0 (0.0%) | 0 (0.0%) |
| 18 to 34 Years | 0 (0.0%) | 0 (0.0%) |
| 35 to 64 Years | 18 (3.8%) | 0 (0.0%) |
| 65 to 74 Years | 1 (0.7%) | 12 (6.4%) |
| 75 Years and over | 9 (20.4%) | 0 (0.0%) |
Disability Class: Vision Difficulty
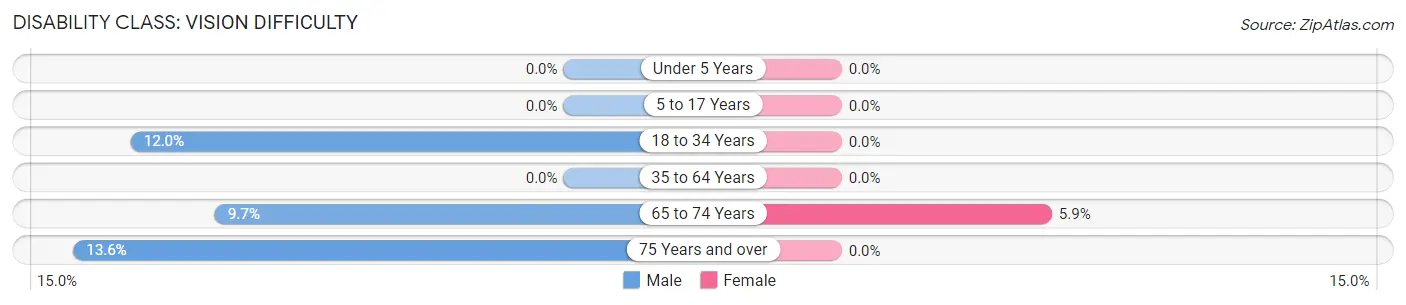
| Age Bracket | Male | Female |
| Under 5 Years | 0 (0.0%) | 0 (0.0%) |
| 5 to 17 Years | 0 (0.0%) | 0 (0.0%) |
| 18 to 34 Years | 13 (12.0%) | 0 (0.0%) |
| 35 to 64 Years | 0 (0.0%) | 0 (0.0%) |
| 65 to 74 Years | 13 (9.7%) | 11 (5.9%) |
| 75 Years and over | 6 (13.6%) | 0 (0.0%) |
Disability Class: Cognitive Difficulty
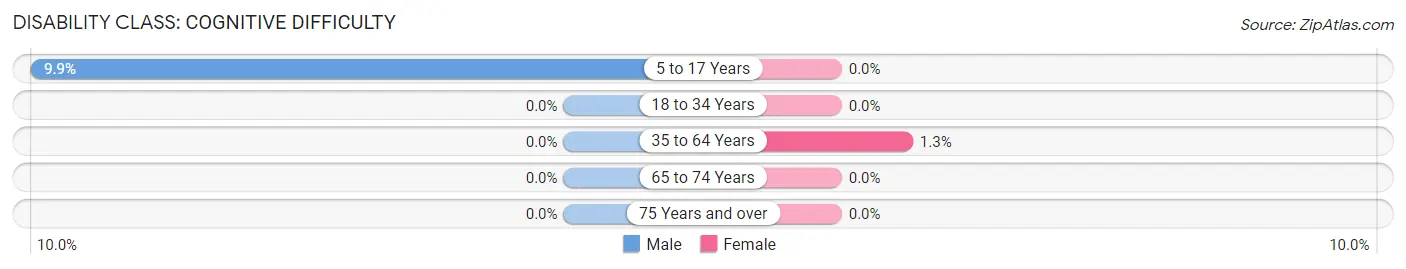
| Age Bracket | Male | Female |
| 5 to 17 Years | 16 (9.9%) | 0 (0.0%) |
| 18 to 34 Years | 0 (0.0%) | 0 (0.0%) |
| 35 to 64 Years | 0 (0.0%) | 6 (1.3%) |
| 65 to 74 Years | 0 (0.0%) | 0 (0.0%) |
| 75 Years and over | 0 (0.0%) | 0 (0.0%) |
Disability Class: Ambulatory Difficulty
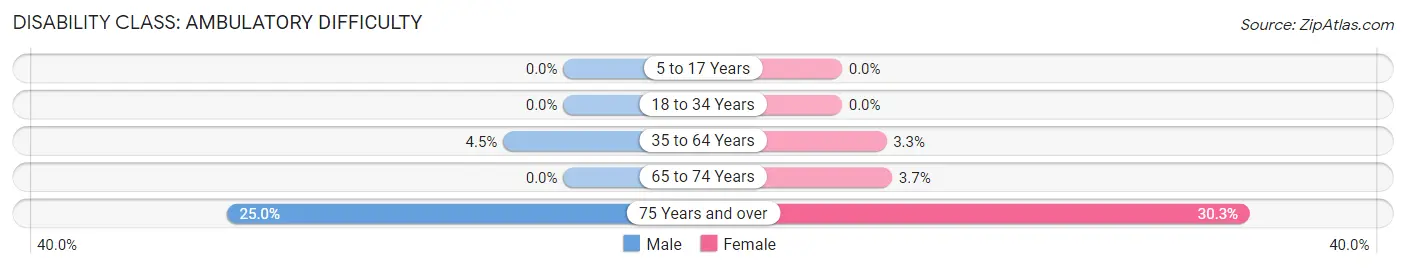
| Age Bracket | Male | Female |
| 5 to 17 Years | 0 (0.0%) | 0 (0.0%) |
| 18 to 34 Years | 0 (0.0%) | 0 (0.0%) |
| 35 to 64 Years | 21 (4.5%) | 15 (3.3%) |
| 65 to 74 Years | 0 (0.0%) | 7 (3.7%) |
| 75 Years and over | 11 (25.0%) | 10 (30.3%) |
Disability Class: Self-Care Difficulty
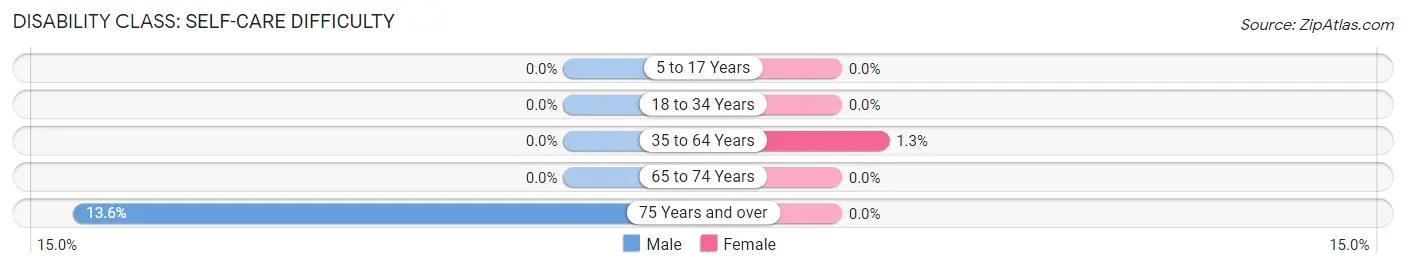
| Age Bracket | Male | Female |
| 5 to 17 Years | 0 (0.0%) | 0 (0.0%) |
| 18 to 34 Years | 0 (0.0%) | 0 (0.0%) |
| 35 to 64 Years | 0 (0.0%) | 6 (1.3%) |
| 65 to 74 Years | 0 (0.0%) | 0 (0.0%) |
| 75 Years and over | 6 (13.6%) | 0 (0.0%) |
Technology Access in Brice Prairie
Computing Device Access in Brice Prairie
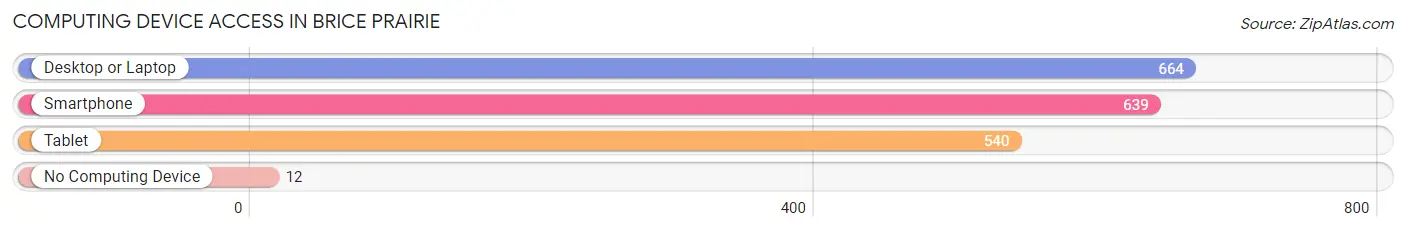
| Device Type | # Households | % Households |
| Desktop or Laptop | 664 | 88.4% |
| Smartphone | 639 | 85.1% |
| Tablet | 540 | 71.9% |
| No Computing Device | 12 | 1.6% |
| Total | 751 | 100.0% |
Internet Access in Brice Prairie
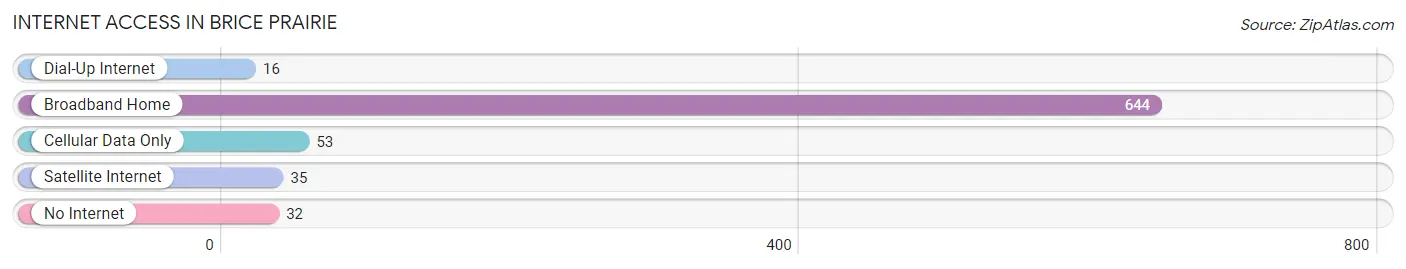
| Internet Type | # Households | % Households |
| Dial-Up Internet | 16 | 2.1% |
| Broadband Home | 644 | 85.8% |
| Cellular Data Only | 53 | 7.1% |
| Satellite Internet | 35 | 4.7% |
| No Internet | 32 | 4.3% |
| Total | 751 | 100.0% |
Brice Prairie Summary
Brice Prairie is a small unincorporated community located in La Crosse County, Wisconsin, United States. It is situated on the banks of the Black River, just south of the city of La Crosse. The community is part of the La Crosse-Onalaska Metropolitan Statistical Area.
History
The area that is now Brice Prairie was first settled in the early 1800s by French-Canadian fur traders. The first permanent settlers arrived in the 1840s, and the community was named after one of the first settlers, John Brice. The area was primarily agricultural, and the main crops were corn, wheat, and oats.
In the late 1800s, the area began to develop as a resort destination. The Black River was a popular spot for fishing and boating, and the area was known for its scenic beauty. The first hotel was built in 1891, and the area soon became a popular destination for tourists.
Geography
Brice Prairie is located in La Crosse County, Wisconsin, United States. It is situated on the banks of the Black River, just south of the city of La Crosse. The community is part of the La Crosse-Onalaska Metropolitan Statistical Area.
The area is mostly flat, with some rolling hills. The terrain is mostly covered in grasslands and woodlands. The Black River runs through the area, and there are several small lakes and ponds in the area.
Economy
The economy of Brice Prairie is largely based on agriculture. The main crops are corn, wheat, and oats. There are also several dairy farms in the area.
In addition to agriculture, the area is also home to several small businesses. These include restaurants, retail stores, and other services.
Demographics
As of the 2010 census, the population of Brice Prairie was 1,845. The racial makeup of the community was 97.3% White, 0.7% African American, 0.3% Native American, 0.3% Asian, 0.2% from other races, and 1.3% from two or more races. Hispanic or Latino of any race were 1.2% of the population.
The median household income in Brice Prairie was $50,938, and the median family income was $60,938. The per capita income was $25,938. About 4.3% of families and 5.7% of the population were below the poverty line, including 8.3% of those under age 18 and 4.3% of those age 65 or over.
Common Questions
What is Per Capita Income in Brice Prairie?
Per Capita income in Brice Prairie is $40,942.
What is the Median Family Income in Brice Prairie?
Median Family Income in Brice Prairie is $108,750.
What is the Median Household income in Brice Prairie?
Median Household Income in Brice Prairie is $89,013.
What is Income or Wage Gap in Brice Prairie?
Income or Wage Gap in Brice Prairie is 30.1%.
Women in Brice Prairie earn 69.9 cents for every dollar earned by a man.
What is Inequality or Gini Index in Brice Prairie?
Inequality or Gini Index in Brice Prairie is 0.34.
What is the Total Population of Brice Prairie?
Total Population of Brice Prairie is 1,945.
What is the Total Male Population of Brice Prairie?
Total Male Population of Brice Prairie is 969.
What is the Total Female Population of Brice Prairie?
Total Female Population of Brice Prairie is 976.
What is the Ratio of Males per 100 Females in Brice Prairie?
There are 99.28 Males per 100 Females in Brice Prairie.
What is the Ratio of Females per 100 Males in Brice Prairie?
There are 100.72 Females per 100 Males in Brice Prairie.
What is the Median Population Age in Brice Prairie?
Median Population Age in Brice Prairie is 46.0 Years.
What is the Average Family Size in Brice Prairie
Average Family Size in Brice Prairie is 3.0 People.
What is the Average Household Size in Brice Prairie
Average Household Size in Brice Prairie is 2.6 People.
How Large is the Labor Force in Brice Prairie?
There are 1,065 People in the Labor Forcein in Brice Prairie.
What is the Percentage of People in the Labor Force in Brice Prairie?
67.5% of People are in the Labor Force in Brice Prairie.
What is the Unemployment Rate in Brice Prairie?
Unemployment Rate in Brice Prairie is 1.6%.