Bellevue, WI Map & Demographics
Bellevue Map
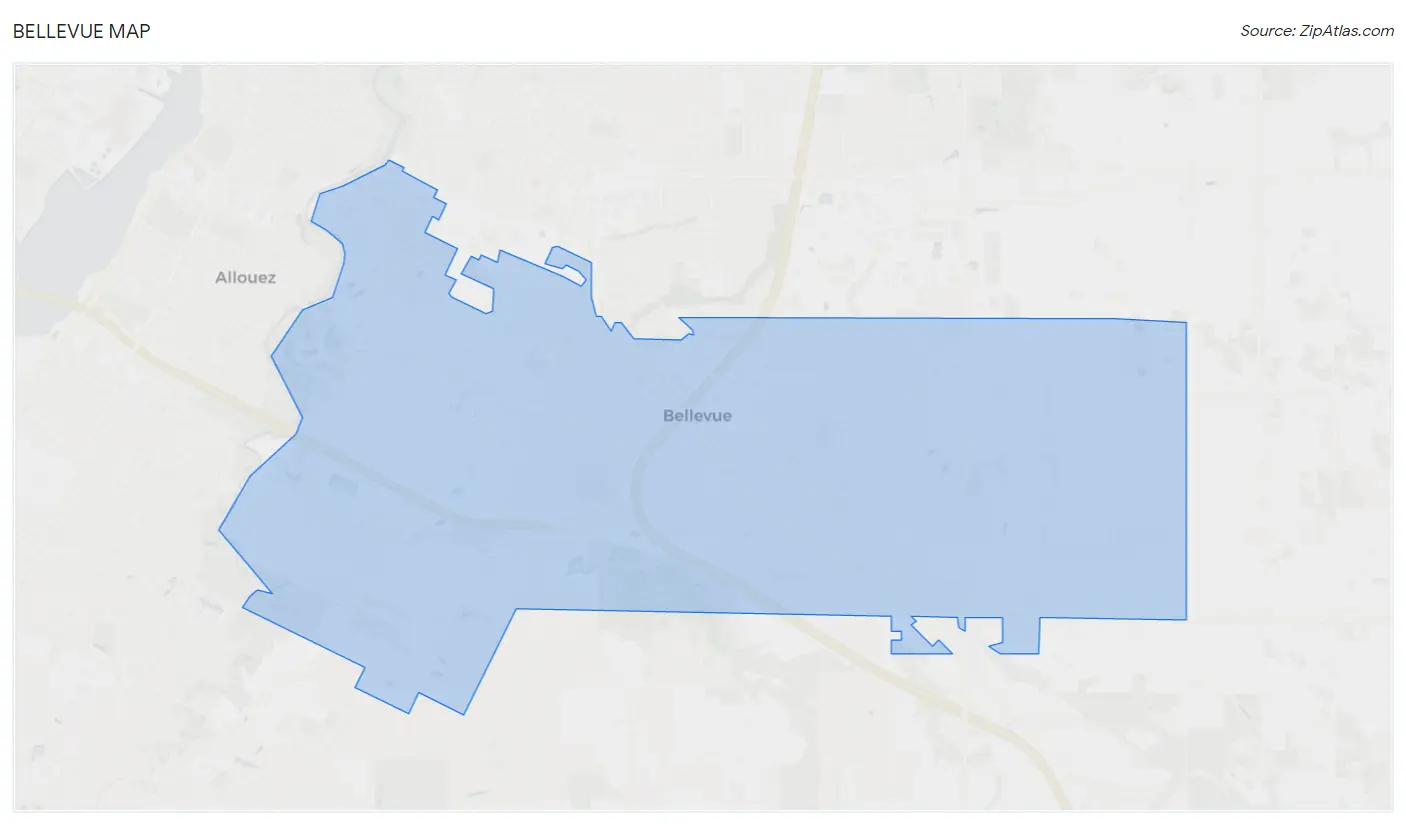
Bellevue Overview
$41,473
PER CAPITA INCOME
$92,379
AVG FAMILY INCOME
$76,152
AVG HOUSEHOLD INCOME
26.2%
WAGE / INCOME GAP [ % ]
73.8¢/ $1
WAGE / INCOME GAP [ $ ]
0.43
INEQUALITY / GINI INDEX
16,086
TOTAL POPULATION
7,995
MALE POPULATION
8,091
FEMALE POPULATION
98.81
MALES / 100 FEMALES
101.20
FEMALES / 100 MALES
40.7
MEDIAN AGE
3.0
AVG FAMILY SIZE
2.4
AVG HOUSEHOLD SIZE
9,017
LABOR FORCE [ PEOPLE ]
69.2%
PERCENT IN LABOR FORCE
3.1%
UNEMPLOYMENT RATE
Bellevue Area Codes
Income in Bellevue
Income Overview in Bellevue
Per Capita Income in Bellevue is $41,473, while median incomes of families and households are $92,379 and $76,152 respectively.
| Characteristic | Number | Measure |
| Per Capita Income | 16,086 | $41,473 |
| Median Family Income | 4,263 | $92,379 |
| Mean Family Income | 4,263 | $119,100 |
| Median Household Income | 6,800 | $76,152 |
| Mean Household Income | 6,800 | $95,702 |
| Income Deficit | 4,263 | $0 |
| Wage / Income Gap (%) | 16,086 | 26.18% |
| Wage / Income Gap ($) | 16,086 | 73.82¢ per $1 |
| Gini / Inequality Index | 16,086 | 0.43 |
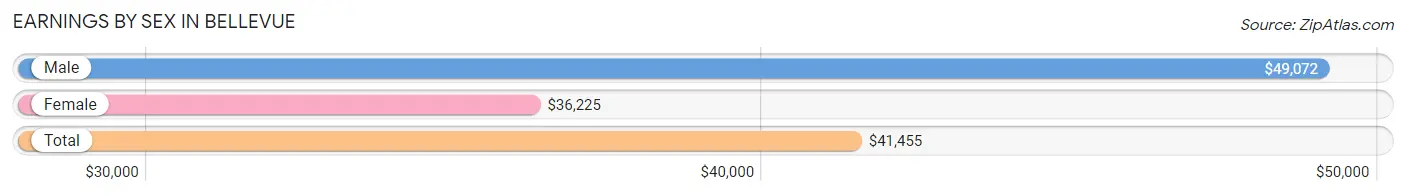
Earnings by Sex in Bellevue
Average Earnings in Bellevue are $41,455, $49,072 for men and $36,225 for women, a difference of 26.2%.
| Sex | Number | Average Earnings |
| Male | 4,947 (52.5%) | $49,072 |
| Female | 4,471 (47.5%) | $36,225 |
| Total | 9,418 (100.0%) | $41,455 |
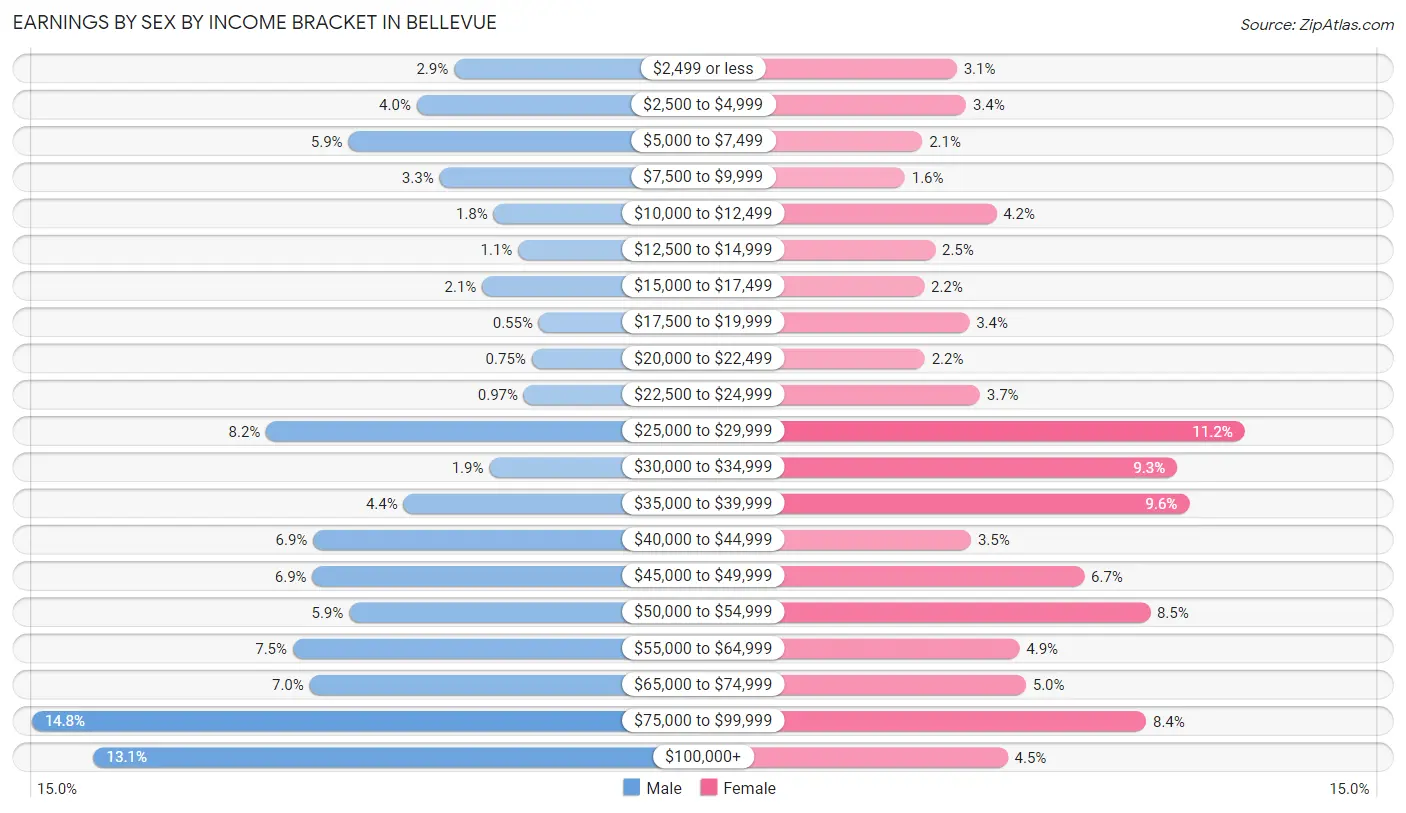
Earnings by Sex by Income Bracket in Bellevue
The most common earnings brackets in Bellevue are $75,000 to $99,999 for men (732 | 14.8%) and $25,000 to $29,999 for women (500 | 11.2%).
| Income | Male | Female |
| $2,499 or less | 145 (2.9%) | 138 (3.1%) |
| $2,500 to $4,999 | 197 (4.0%) | 150 (3.4%) |
| $5,000 to $7,499 | 292 (5.9%) | 95 (2.1%) |
| $7,500 to $9,999 | 165 (3.3%) | 73 (1.6%) |
| $10,000 to $12,499 | 90 (1.8%) | 188 (4.2%) |
| $12,500 to $14,999 | 56 (1.1%) | 111 (2.5%) |
| $15,000 to $17,499 | 106 (2.1%) | 97 (2.2%) |
| $17,500 to $19,999 | 27 (0.5%) | 154 (3.4%) |
| $20,000 to $22,499 | 37 (0.7%) | 98 (2.2%) |
| $22,500 to $24,999 | 48 (1.0%) | 167 (3.7%) |
| $25,000 to $29,999 | 406 (8.2%) | 500 (11.2%) |
| $30,000 to $34,999 | 96 (1.9%) | 415 (9.3%) |
| $35,000 to $39,999 | 215 (4.3%) | 430 (9.6%) |
| $40,000 to $44,999 | 341 (6.9%) | 156 (3.5%) |
| $45,000 to $49,999 | 342 (6.9%) | 298 (6.7%) |
| $50,000 to $54,999 | 291 (5.9%) | 381 (8.5%) |
| $55,000 to $64,999 | 369 (7.5%) | 217 (4.9%) |
| $65,000 to $74,999 | 346 (7.0%) | 225 (5.0%) |
| $75,000 to $99,999 | 732 (14.8%) | 376 (8.4%) |
| $100,000+ | 646 (13.1%) | 202 (4.5%) |
| Total | 4,947 (100.0%) | 4,471 (100.0%) |
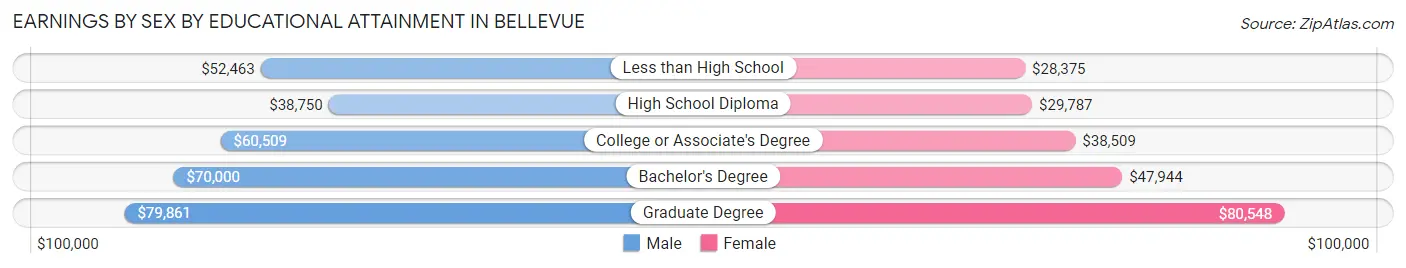
Earnings by Sex by Educational Attainment in Bellevue
Average earnings in Bellevue are $54,660 for men and $38,286 for women, a difference of 30.0%. Men with an educational attainment of graduate degree enjoy the highest average annual earnings of $79,861, while those with high school diploma education earn the least with $38,750. Women with an educational attainment of graduate degree earn the most with the average annual earnings of $80,548, while those with less than high school education have the smallest earnings of $28,375.
| Educational Attainment | Male Income | Female Income |
| Less than High School | $52,463 | $28,375 |
| High School Diploma | $38,750 | $29,787 |
| College or Associate's Degree | $60,509 | $38,509 |
| Bachelor's Degree | $70,000 | $47,944 |
| Graduate Degree | $79,861 | $80,548 |
| Total | $54,660 | $38,286 |
Family Income in Bellevue
Family Income Brackets in Bellevue
According to the Bellevue family income data, there are 1,074 families falling into the $100,000 to $149,999 income range, which is the most common income bracket and makes up 25.2% of all families. Conversely, the $10,000 to $14,999 income bracket is the least frequent group with only 26 families (0.6%) belonging to this category.
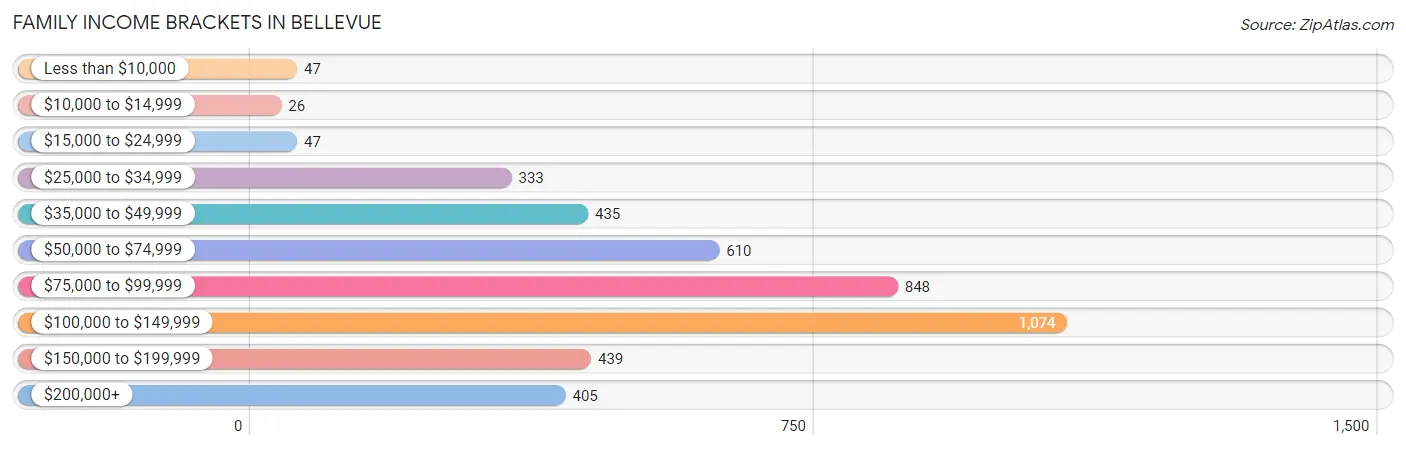
| Income Bracket | # Families | % Families |
| Less than $10,000 | 47 | 1.1% |
| $10,000 to $14,999 | 26 | 0.6% |
| $15,000 to $24,999 | 47 | 1.1% |
| $25,000 to $34,999 | 333 | 7.8% |
| $35,000 to $49,999 | 435 | 10.2% |
| $50,000 to $74,999 | 610 | 14.3% |
| $75,000 to $99,999 | 848 | 19.9% |
| $100,000 to $149,999 | 1,074 | 25.2% |
| $150,000 to $199,999 | 439 | 10.3% |
| $200,000+ | 405 | 9.5% |
Family Income by Famaliy Size in Bellevue
5-person families (273 | 6.4%) account for the highest median family income in Bellevue with $129,135 per family, while 2-person families (1,974 | 46.3%) have the highest median income of $42,184 per family member.
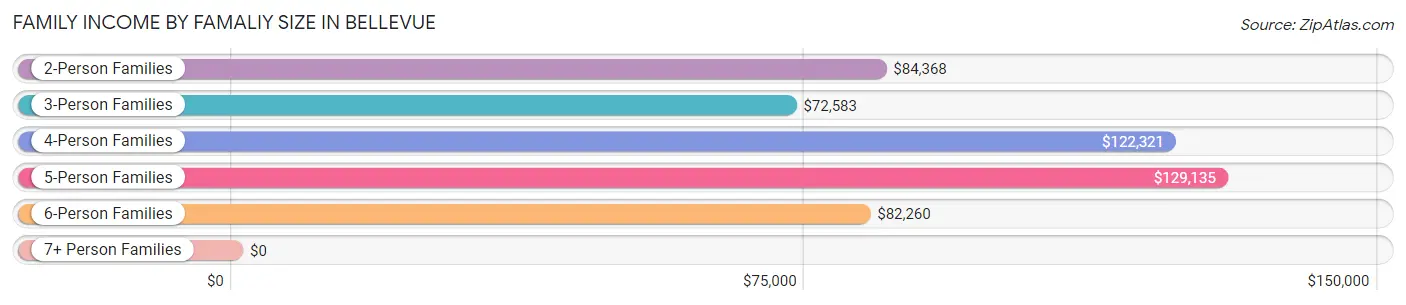
| Income Bracket | # Families | Median Income |
| 2-Person Families | 1,974 (46.3%) | $84,368 |
| 3-Person Families | 1,061 (24.9%) | $72,583 |
| 4-Person Families | 831 (19.5%) | $122,321 |
| 5-Person Families | 273 (6.4%) | $129,135 |
| 6-Person Families | 124 (2.9%) | $82,260 |
| 7+ Person Families | 0 (0.0%) | $0 |
| Total | 4,263 (100.0%) | $92,379 |
Family Income by Number of Earners in Bellevue
The median family income in Bellevue is $92,379, with families comprising 3+ earners (611) having the highest median family income of $143,516, while families with 1 earner (1,218) have the lowest median family income of $54,792, accounting for 14.3% and 28.6% of families, respectively.
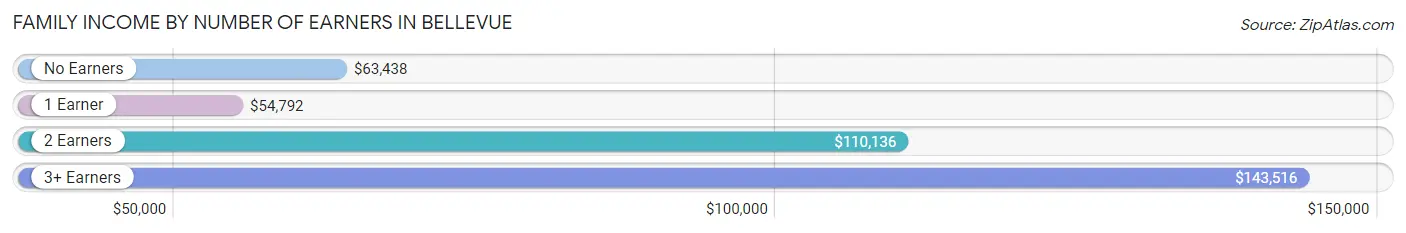
| Number of Earners | # Families | Median Income |
| No Earners | 514 (12.1%) | $63,438 |
| 1 Earner | 1,218 (28.6%) | $54,792 |
| 2 Earners | 1,920 (45.0%) | $110,136 |
| 3+ Earners | 611 (14.3%) | $143,516 |
| Total | 4,263 (100.0%) | $92,379 |
Household Income in Bellevue
Household Income Brackets in Bellevue
With 1,299 households falling in the category, the $100,000 to $149,999 income range is the most frequent in Bellevue, accounting for 19.1% of all households. In contrast, only 184 households (2.7%) fall into the $10,000 to $14,999 income bracket, making it the least populous group.
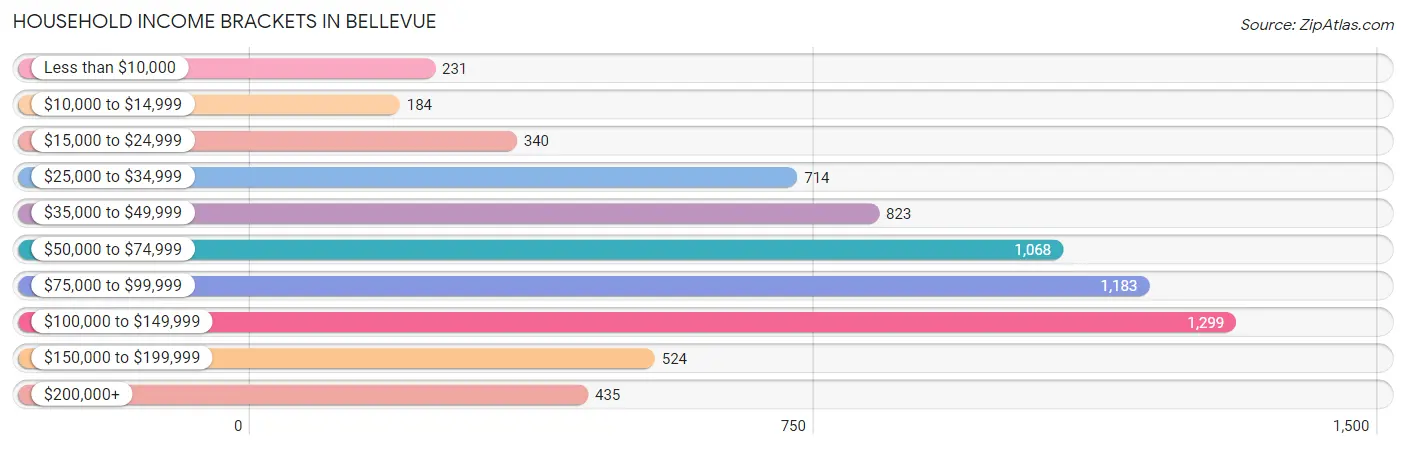
| Income Bracket | # Households | % Households |
| Less than $10,000 | 231 | 3.4% |
| $10,000 to $14,999 | 184 | 2.7% |
| $15,000 to $24,999 | 340 | 5.0% |
| $25,000 to $34,999 | 714 | 10.5% |
| $35,000 to $49,999 | 823 | 12.1% |
| $50,000 to $74,999 | 1,068 | 15.7% |
| $75,000 to $99,999 | 1,183 | 17.4% |
| $100,000 to $149,999 | 1,299 | 19.1% |
| $150,000 to $199,999 | 524 | 7.7% |
| $200,000+ | 435 | 6.4% |
Household Income by Householder Age in Bellevue
The median household income in Bellevue is $76,152, with the highest median household income of $87,002 found in the 25 to 44 years age bracket for the primary householder. A total of 1,933 households (28.4%) fall into this category. Meanwhile, the 15 to 24 years age bracket for the primary householder has the lowest median household income of $0, with 371 households (5.5%) in this group.
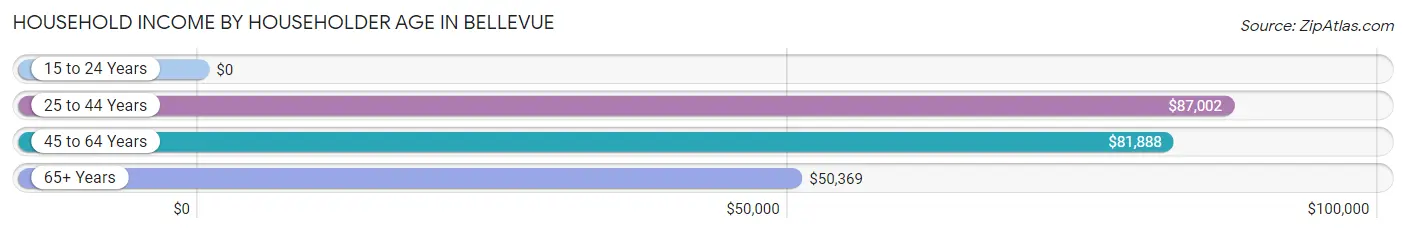
| Income Bracket | # Households | Median Income |
| 15 to 24 Years | 371 (5.5%) | $0 |
| 25 to 44 Years | 1,933 (28.4%) | $87,002 |
| 45 to 64 Years | 2,685 (39.5%) | $81,888 |
| 65+ Years | 1,811 (26.6%) | $50,369 |
| Total | 6,800 (100.0%) | $76,152 |
Poverty in Bellevue
Income Below Poverty by Sex and Age in Bellevue
With 3.5% poverty level for males and 7.0% for females among the residents of Bellevue, under 5 year old males and under 5 year old females are the most vulnerable to poverty, with 28 males (8.3%) and 39 females (16.0%) in their respective age groups living below the poverty level.
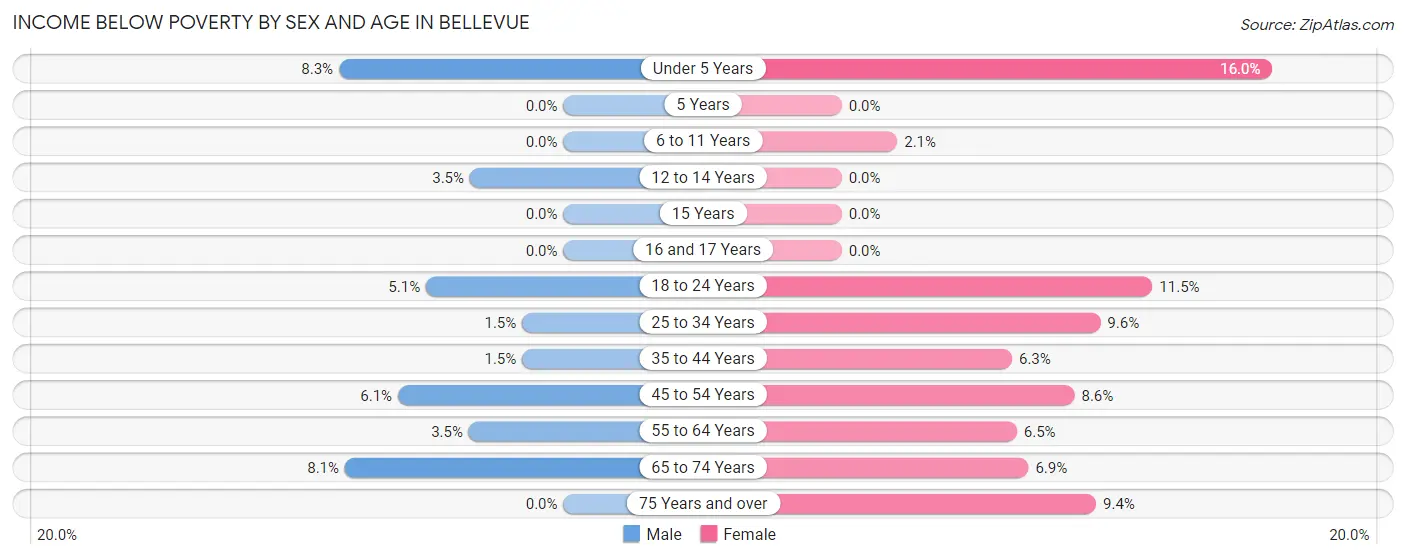
| Age Bracket | Male | Female |
| Under 5 Years | 28 (8.3%) | 39 (16.0%) |
| 5 Years | 0 (0.0%) | 0 (0.0%) |
| 6 to 11 Years | 0 (0.0%) | 21 (2.1%) |
| 12 to 14 Years | 15 (3.5%) | 0 (0.0%) |
| 15 Years | 0 (0.0%) | 0 (0.0%) |
| 16 and 17 Years | 0 (0.0%) | 0 (0.0%) |
| 18 to 24 Years | 36 (5.1%) | 67 (11.5%) |
| 25 to 34 Years | 15 (1.5%) | 95 (9.6%) |
| 35 to 44 Years | 16 (1.5%) | 64 (6.3%) |
| 45 to 54 Years | 68 (6.1%) | 76 (8.6%) |
| 55 to 64 Years | 34 (3.5%) | 90 (6.5%) |
| 65 to 74 Years | 71 (8.1%) | 58 (6.9%) |
| 75 Years and over | 0 (0.0%) | 49 (9.4%) |
| Total | 283 (3.5%) | 559 (7.0%) |
Income Above Poverty by Sex and Age in Bellevue
According to the poverty statistics in Bellevue, males aged 6 to 11 years and females aged 5 years are the age groups that are most secure financially, with 100.0% of males and 100.0% of females in these age groups living above the poverty line.
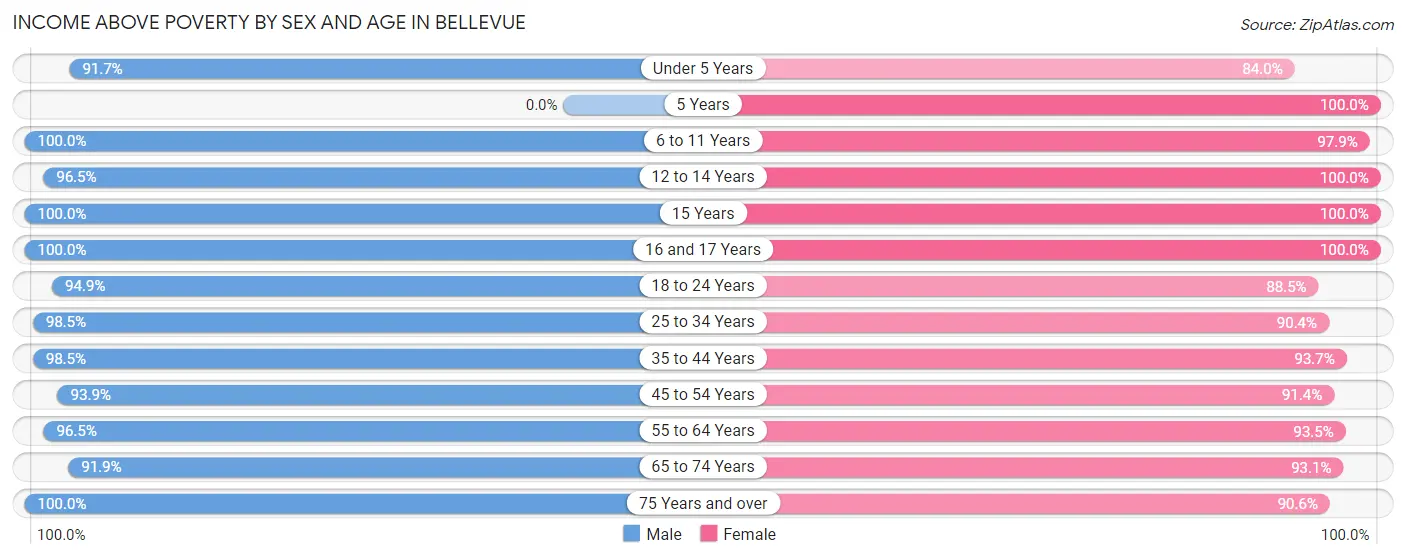
| Age Bracket | Male | Female |
| Under 5 Years | 308 (91.7%) | 205 (84.0%) |
| 5 Years | 0 (0.0%) | 28 (100.0%) |
| 6 to 11 Years | 638 (100.0%) | 1,000 (97.9%) |
| 12 to 14 Years | 417 (96.5%) | 193 (100.0%) |
| 15 Years | 38 (100.0%) | 67 (100.0%) |
| 16 and 17 Years | 405 (100.0%) | 277 (100.0%) |
| 18 to 24 Years | 670 (94.9%) | 514 (88.5%) |
| 25 to 34 Years | 963 (98.5%) | 895 (90.4%) |
| 35 to 44 Years | 1,028 (98.5%) | 948 (93.7%) |
| 45 to 54 Years | 1,039 (93.9%) | 804 (91.4%) |
| 55 to 64 Years | 936 (96.5%) | 1,294 (93.5%) |
| 65 to 74 Years | 805 (91.9%) | 779 (93.1%) |
| 75 Years and over | 465 (100.0%) | 470 (90.6%) |
| Total | 7,712 (96.5%) | 7,474 (93.0%) |
Income Below Poverty Among Married-Couple Families in Bellevue
The poverty statistics for married-couple families in Bellevue show that 0.8% or 27 of the total 3,312 families live below the poverty line. Families with no children have the highest poverty rate of 1.4%, comprising of 27 families. On the other hand, families with 1 or 2 children have the lowest poverty rate of 0.0%, which includes 0 families.
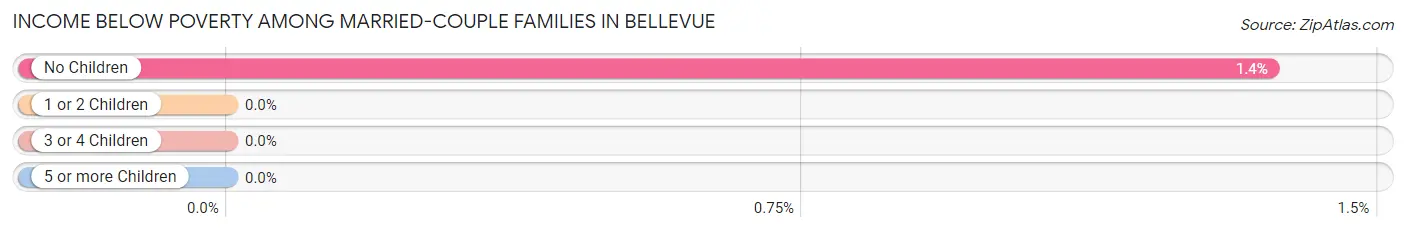
| Children | Above Poverty | Below Poverty |
| No Children | 1,961 (98.6%) | 27 (1.4%) |
| 1 or 2 Children | 1,155 (100.0%) | 0 (0.0%) |
| 3 or 4 Children | 169 (100.0%) | 0 (0.0%) |
| 5 or more Children | 0 (0.0%) | 0 (0.0%) |
| Total | 3,285 (99.2%) | 27 (0.8%) |
Income Below Poverty Among Single-Parent Households in Bellevue
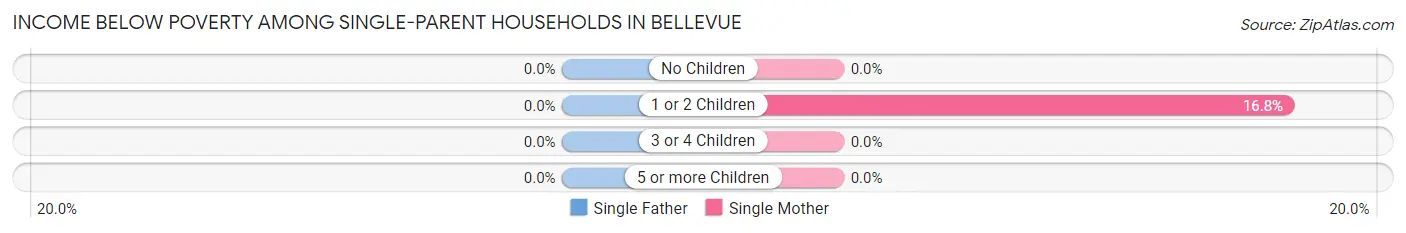
| Children | Single Father | Single Mother |
| No Children | 0 (0.0%) | 0 (0.0%) |
| 1 or 2 Children | 0 (0.0%) | 59 (16.8%) |
| 3 or 4 Children | 0 (0.0%) | 0 (0.0%) |
| 5 or more Children | 0 (0.0%) | 0 (0.0%) |
| Total | 0 (0.0%) | 59 (10.5%) |
Income Below Poverty Among Married-Couple vs Single-Parent Households in Bellevue
The poverty data for Bellevue shows that 27 of the married-couple family households (0.8%) and 59 of the single-parent households (6.2%) are living below the poverty level. Within the married-couple family households, those with no children have the highest poverty rate, with 27 households (1.4%) falling below the poverty line. Among the single-parent households, those with 1 or 2 children have the highest poverty rate, with 59 household (9.2%) living below poverty.
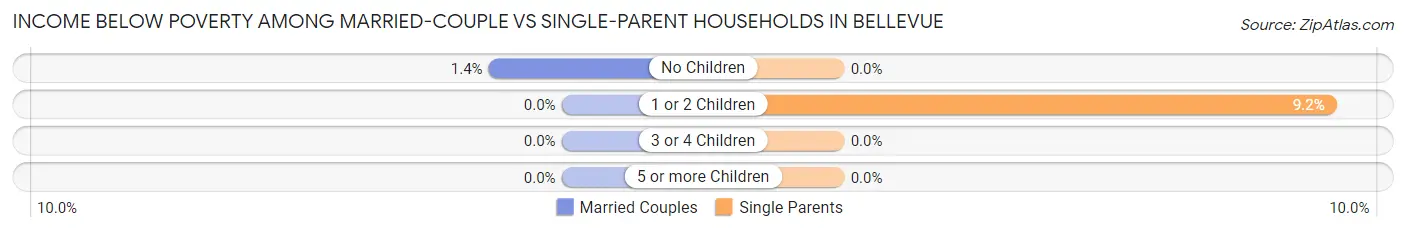
| Children | Married-Couple Families | Single-Parent Households |
| No Children | 27 (1.4%) | 0 (0.0%) |
| 1 or 2 Children | 0 (0.0%) | 59 (9.2%) |
| 3 or 4 Children | 0 (0.0%) | 0 (0.0%) |
| 5 or more Children | 0 (0.0%) | 0 (0.0%) |
| Total | 27 (0.8%) | 59 (6.2%) |
Race in Bellevue
The most populous races in Bellevue are White / Caucasian (13,119 | 81.6%), Hispanic or Latino (1,683 | 10.5%), and Two or more Races (1,376 | 8.6%).
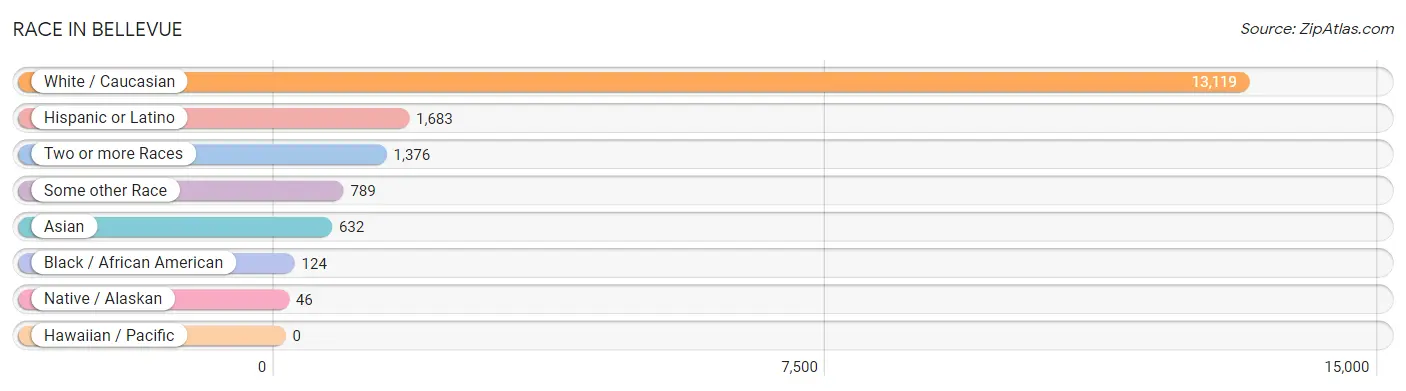
| Race | # Population | % Population |
| Asian | 632 | 3.9% |
| Black / African American | 124 | 0.8% |
| Hawaiian / Pacific | 0 | 0.0% |
| Hispanic or Latino | 1,683 | 10.5% |
| Native / Alaskan | 46 | 0.3% |
| White / Caucasian | 13,119 | 81.6% |
| Two or more Races | 1,376 | 8.6% |
| Some other Race | 789 | 4.9% |
| Total | 16,086 | 100.0% |
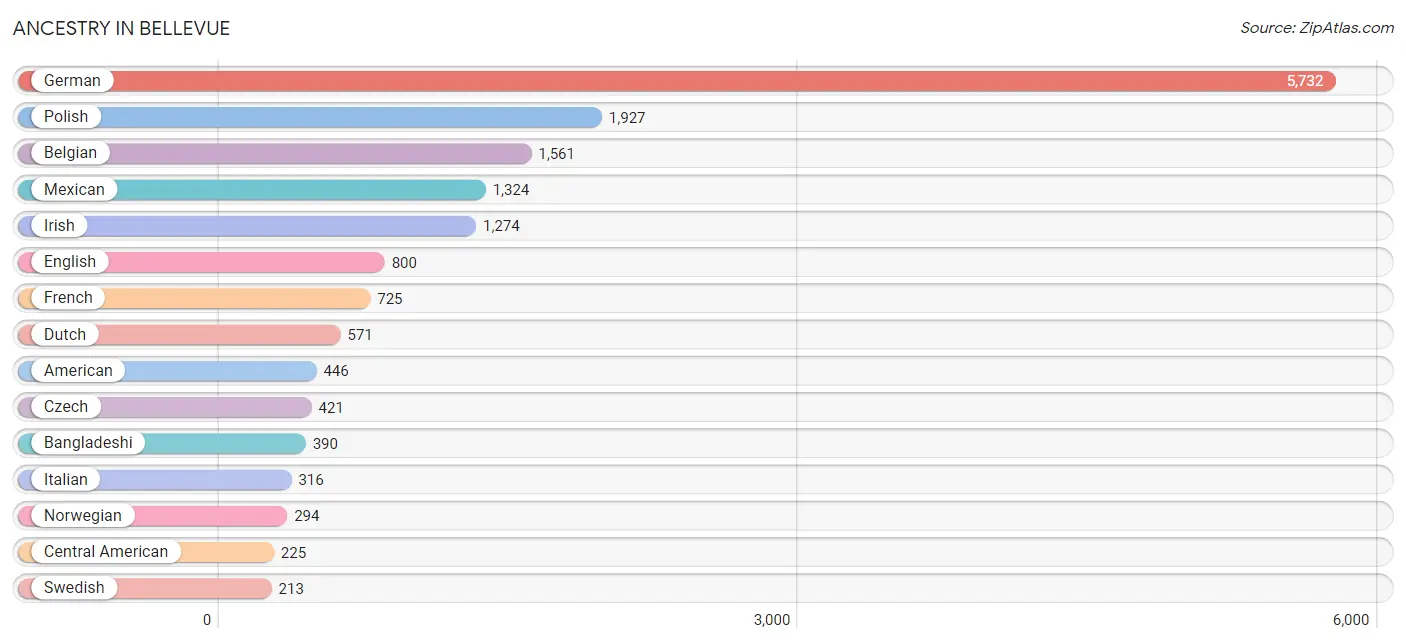
Ancestry in Bellevue
The most populous ancestries reported in Bellevue are German (5,732 | 35.6%), Polish (1,927 | 12.0%), Belgian (1,561 | 9.7%), Mexican (1,324 | 8.2%), and Irish (1,274 | 7.9%), together accounting for 73.5% of all Bellevue residents.
| Ancestry | # Population | % Population |
| Afghan | 17 | 0.1% |
| African | 21 | 0.1% |
| American | 446 | 2.8% |
| Arab | 17 | 0.1% |
| Bangladeshi | 390 | 2.4% |
| Belgian | 1,561 | 9.7% |
| Bhutanese | 41 | 0.3% |
| British | 44 | 0.3% |
| Central American | 225 | 1.4% |
| Cherokee | 6 | 0.0% |
| Chippewa | 53 | 0.3% |
| Croatian | 40 | 0.3% |
| Czech | 421 | 2.6% |
| Czechoslovakian | 101 | 0.6% |
| Danish | 70 | 0.4% |
| Dutch | 571 | 3.5% |
| Eastern European | 49 | 0.3% |
| English | 800 | 5.0% |
| European | 120 | 0.7% |
| Finnish | 138 | 0.9% |
| French | 725 | 4.5% |
| French Canadian | 104 | 0.6% |
| German | 5,732 | 35.6% |
| Greek | 52 | 0.3% |
| Guatemalan | 101 | 0.6% |
| Honduran | 124 | 0.8% |
| Hungarian | 12 | 0.1% |
| Indian (Asian) | 11 | 0.1% |
| Irish | 1,274 | 7.9% |
| Iroquois | 6 | 0.0% |
| Italian | 316 | 2.0% |
| Jordanian | 17 | 0.1% |
| Korean | 67 | 0.4% |
| Lithuanian | 14 | 0.1% |
| Luxembourger | 14 | 0.1% |
| Mexican | 1,324 | 8.2% |
| Northern European | 22 | 0.1% |
| Norwegian | 294 | 1.8% |
| Pakistani | 54 | 0.3% |
| Pennsylvania German | 15 | 0.1% |
| Peruvian | 30 | 0.2% |
| Polish | 1,927 | 12.0% |
| Puerto Rican | 85 | 0.5% |
| Romanian | 15 | 0.1% |
| Russian | 118 | 0.7% |
| Scandinavian | 14 | 0.1% |
| Scotch-Irish | 40 | 0.3% |
| Scottish | 80 | 0.5% |
| Slovak | 64 | 0.4% |
| Slovene | 29 | 0.2% |
| South American | 30 | 0.2% |
| Spanish | 19 | 0.1% |
| Sri Lankan | 98 | 0.6% |
| Subsaharan African | 21 | 0.1% |
| Swedish | 213 | 1.3% |
| Swiss | 12 | 0.1% |
| Thai | 45 | 0.3% | View All 57 Rows |
Immigrants in Bellevue
The most numerous immigrant groups reported in Bellevue came from Central America (465 | 2.9%), Latin America (465 | 2.9%), Asia (375 | 2.3%), South Eastern Asia (375 | 2.3%), and Mexico (333 | 2.1%), together accounting for 12.5% of all Bellevue residents.
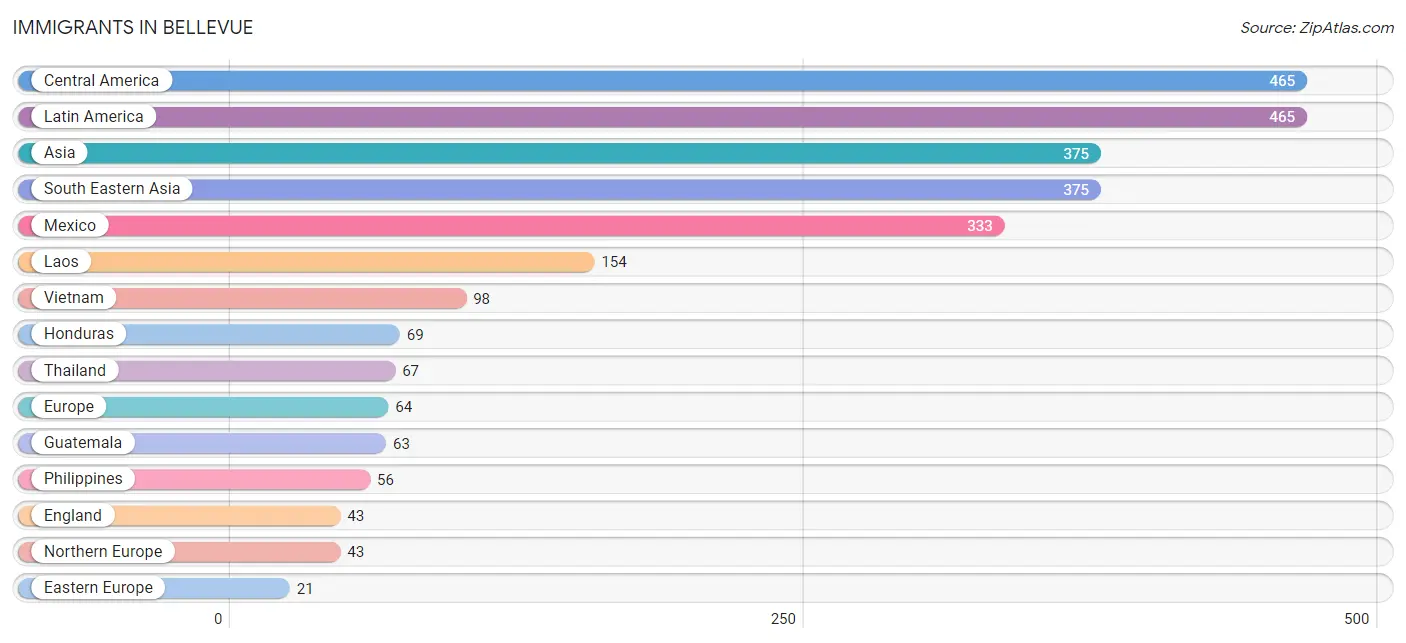
| Immigration Origin | # Population | % Population |
| Asia | 375 | 2.3% |
| Canada | 14 | 0.1% |
| Central America | 465 | 2.9% |
| Eastern Europe | 21 | 0.1% |
| England | 43 | 0.3% |
| Europe | 64 | 0.4% |
| Guatemala | 63 | 0.4% |
| Honduras | 69 | 0.4% |
| Laos | 154 | 1.0% |
| Latin America | 465 | 2.9% |
| Mexico | 333 | 2.1% |
| Northern Europe | 43 | 0.3% |
| Philippines | 56 | 0.4% |
| Russia | 6 | 0.0% |
| South Eastern Asia | 375 | 2.3% |
| Thailand | 67 | 0.4% |
| Ukraine | 15 | 0.1% |
| Vietnam | 98 | 0.6% | View All 18 Rows |
Sex and Age in Bellevue
Sex and Age in Bellevue
The most populous age groups in Bellevue are 45 to 49 Years (702 | 8.8%) for men and 10 to 14 Years (792 | 9.8%) for women.
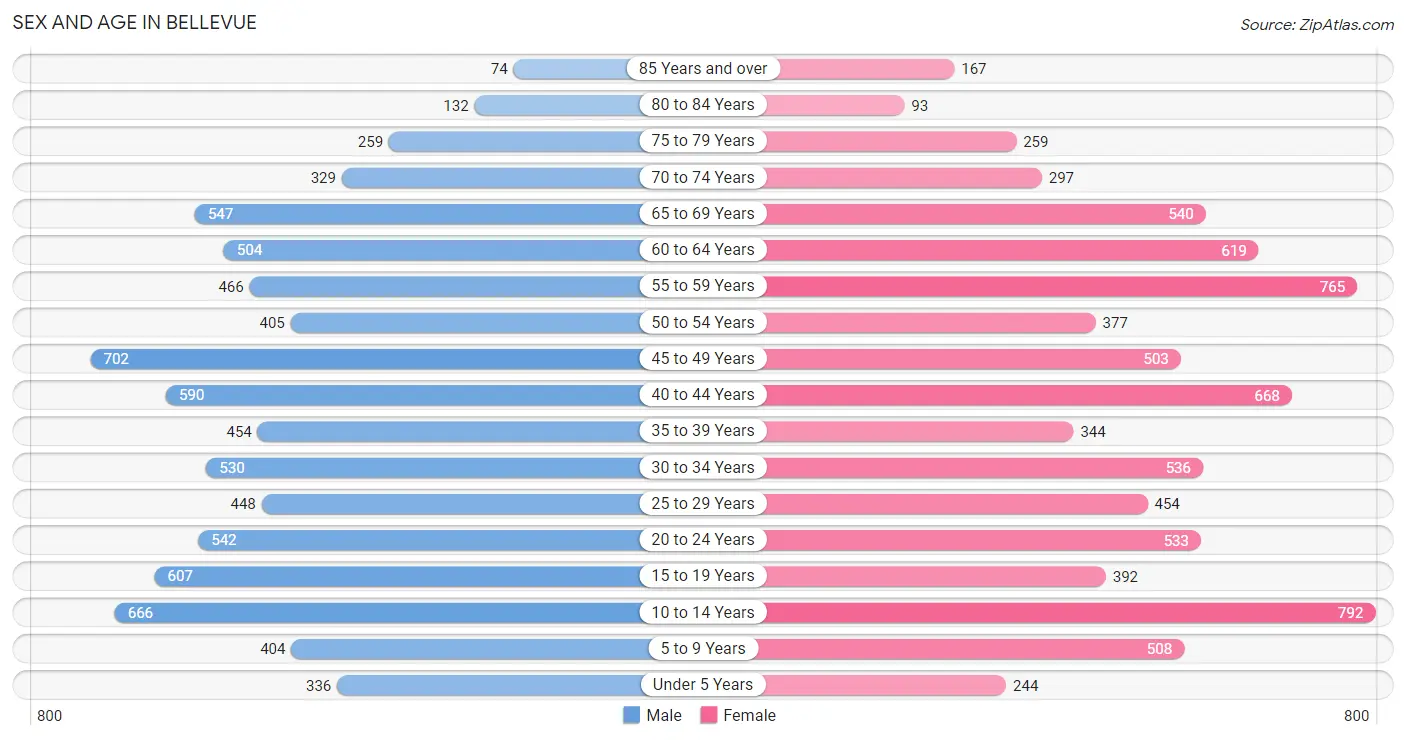
| Age Bracket | Male | Female |
| Under 5 Years | 336 (4.2%) | 244 (3.0%) |
| 5 to 9 Years | 404 (5.1%) | 508 (6.3%) |
| 10 to 14 Years | 666 (8.3%) | 792 (9.8%) |
| 15 to 19 Years | 607 (7.6%) | 392 (4.8%) |
| 20 to 24 Years | 542 (6.8%) | 533 (6.6%) |
| 25 to 29 Years | 448 (5.6%) | 454 (5.6%) |
| 30 to 34 Years | 530 (6.6%) | 536 (6.6%) |
| 35 to 39 Years | 454 (5.7%) | 344 (4.3%) |
| 40 to 44 Years | 590 (7.4%) | 668 (8.3%) |
| 45 to 49 Years | 702 (8.8%) | 503 (6.2%) |
| 50 to 54 Years | 405 (5.1%) | 377 (4.7%) |
| 55 to 59 Years | 466 (5.8%) | 765 (9.5%) |
| 60 to 64 Years | 504 (6.3%) | 619 (7.6%) |
| 65 to 69 Years | 547 (6.8%) | 540 (6.7%) |
| 70 to 74 Years | 329 (4.1%) | 297 (3.7%) |
| 75 to 79 Years | 259 (3.2%) | 259 (3.2%) |
| 80 to 84 Years | 132 (1.7%) | 93 (1.1%) |
| 85 Years and over | 74 (0.9%) | 167 (2.1%) |
| Total | 7,995 (100.0%) | 8,091 (100.0%) |
Families and Households in Bellevue
Median Family Size in Bellevue
The median family size in Bellevue is 2.98 persons per family, with married-couple families (3,312 | 77.7%) accounting for the largest median family size of 3.04 persons per family. On the other hand, single male/father families (388 | 9.1%) represent the smallest median family size with 2.50 persons per family.
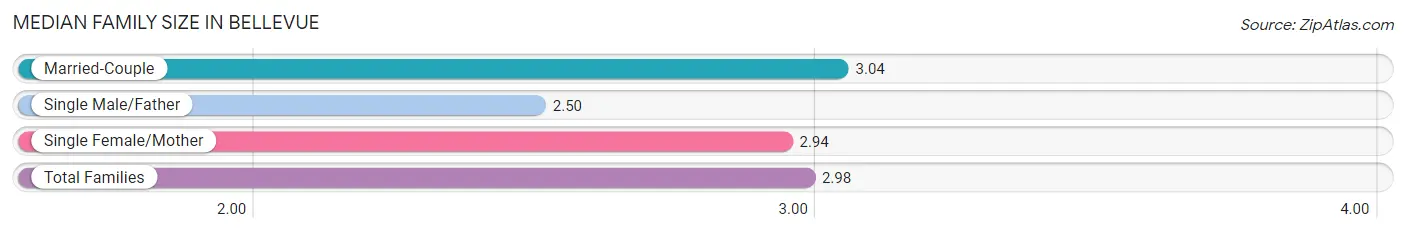
| Family Type | # Families | Family Size |
| Married-Couple | 3,312 (77.7%) | 3.04 |
| Single Male/Father | 388 (9.1%) | 2.50 |
| Single Female/Mother | 563 (13.2%) | 2.94 |
| Total Families | 4,263 (100.0%) | 2.98 |
Median Household Size in Bellevue
The median household size in Bellevue is 2.36 persons per household, with single female/mother households (563 | 8.3%) accounting for the largest median household size of 3.29 persons per household. non-family households (2,537 | 37.3%) represent the smallest median household size with 1.22 persons per household.
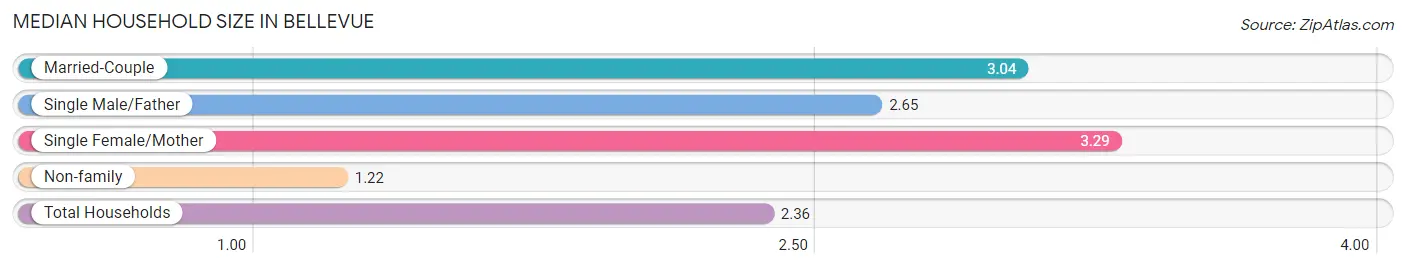
| Household Type | # Households | Household Size |
| Married-Couple | 3,312 (48.7%) | 3.04 |
| Single Male/Father | 388 (5.7%) | 2.65 |
| Single Female/Mother | 563 (8.3%) | 3.29 |
| Non-family | 2,537 (37.3%) | 1.22 |
| Total Households | 6,800 (100.0%) | 2.36 |
Household Size by Marriage Status in Bellevue
Out of a total of 6,800 households in Bellevue, 4,263 (62.7%) are family households, while 2,537 (37.3%) are nonfamily households. The most numerous type of family households are 2-person households, comprising 1,850, and the most common type of nonfamily households are 1-person households, comprising 2,050.
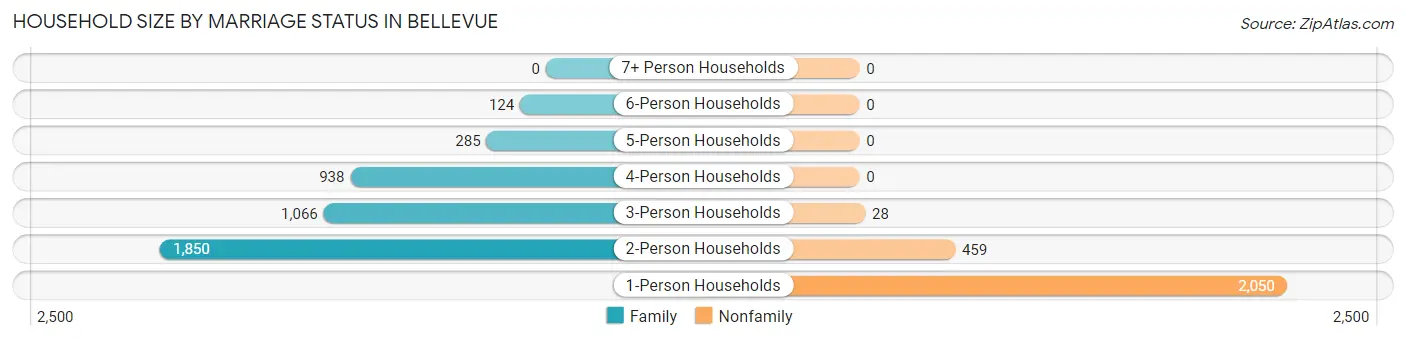
| Household Size | Family Households | Nonfamily Households |
| 1-Person Households | - | 2,050 (30.1%) |
| 2-Person Households | 1,850 (27.2%) | 459 (6.8%) |
| 3-Person Households | 1,066 (15.7%) | 28 (0.4%) |
| 4-Person Households | 938 (13.8%) | 0 (0.0%) |
| 5-Person Households | 285 (4.2%) | 0 (0.0%) |
| 6-Person Households | 124 (1.8%) | 0 (0.0%) |
| 7+ Person Households | 0 (0.0%) | 0 (0.0%) |
| Total | 4,263 (62.7%) | 2,537 (37.3%) |
Female Fertility in Bellevue
Fertility by Age in Bellevue
Average fertility rate in Bellevue is 50.0 births per 1,000 women. Women in the age bracket of 20 to 34 years have the highest fertility rate with 114.0 births per 1,000 women. Women in the age bracket of 20 to 34 years acount for 100.0% of all women with births.
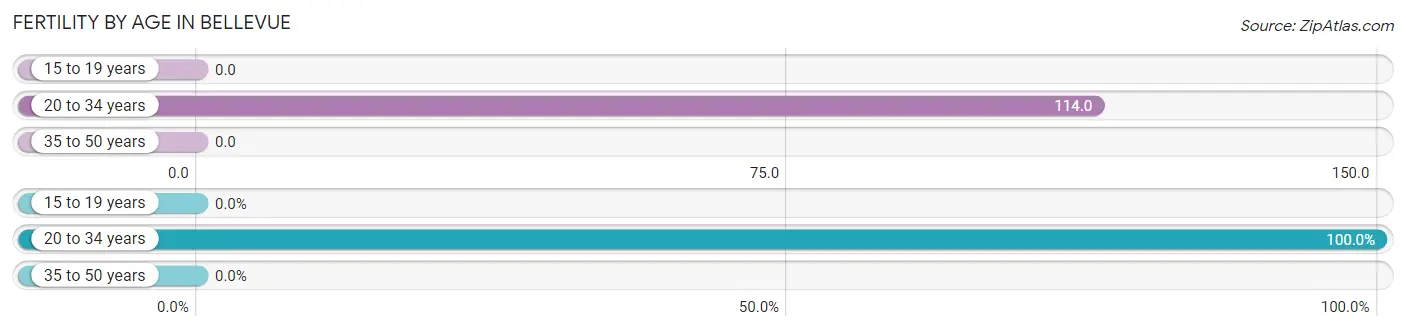
| Age Bracket | Women with Births | Births / 1,000 Women |
| 15 to 19 years | 0 (0.0%) | 0.0 |
| 20 to 34 years | 173 (100.0%) | 114.0 |
| 35 to 50 years | 0 (0.0%) | 0.0 |
| Total | 173 (100.0%) | 50.0 |
Fertility by Age by Marriage Status in Bellevue
81.5% of women with births (173) in Bellevue are married. The highest percentage of unmarried women with births falls into 20 to 34 years age bracket with 18.5% of them unmarried at the time of birth, while the lowest percentage of unmarried women with births belong to 20 to 34 years age bracket with 18.5% of them unmarried.
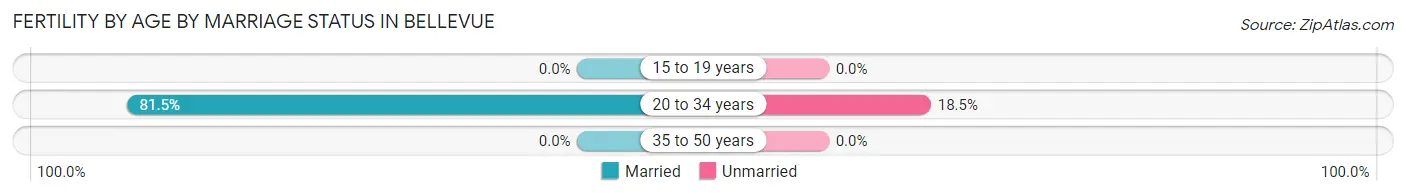
| Age Bracket | Married | Unmarried |
| 15 to 19 years | 0 (0.0%) | 0 (0.0%) |
| 20 to 34 years | 141 (81.5%) | 32 (18.5%) |
| 35 to 50 years | 0 (0.0%) | 0 (0.0%) |
| Total | 141 (81.5%) | 32 (18.5%) |
Fertility by Education in Bellevue
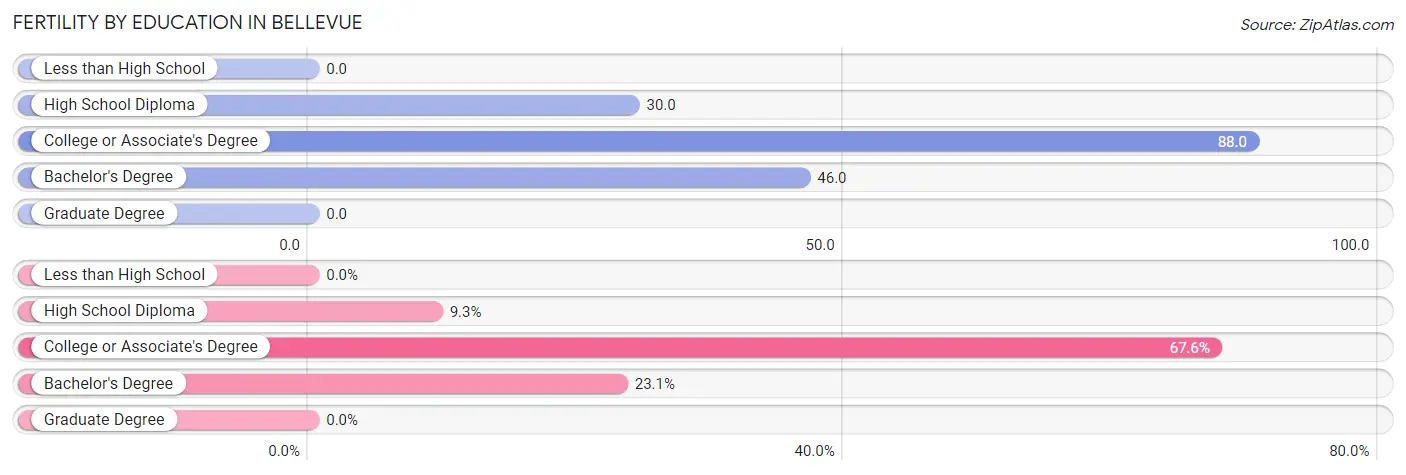
| Educational Attainment | Women with Births | Births / 1,000 Women |
| Less than High School | 0 (0.0%) | 0.0 |
| High School Diploma | 16 (9.2%) | 30.0 |
| College or Associate's Degree | 117 (67.6%) | 88.0 |
| Bachelor's Degree | 40 (23.1%) | 46.0 |
| Graduate Degree | 0 (0.0%) | 0.0 |
| Total | 173 (100.0%) | 50.0 |
Fertility by Education by Marriage Status in Bellevue
18.5% of women with births in Bellevue are unmarried. Women with the educational attainment of high school diploma are most likely to be married with 100.0% of them married at childbirth, while women with the educational attainment of college or associate's degree are least likely to be married with 27.4% of them unmarried at childbirth.
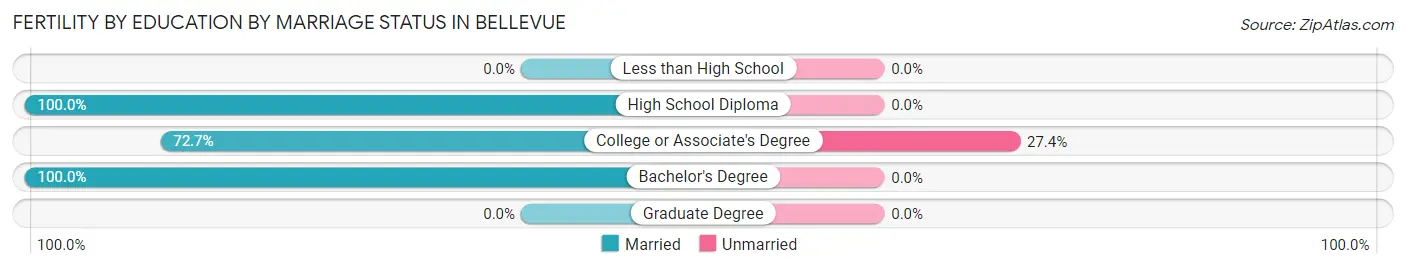
| Educational Attainment | Married | Unmarried |
| Less than High School | 0 (0.0%) | 0 (0.0%) |
| High School Diploma | 16 (100.0%) | 0 (0.0%) |
| College or Associate's Degree | 85 (72.7%) | 32 (27.4%) |
| Bachelor's Degree | 40 (100.0%) | 0 (0.0%) |
| Graduate Degree | 0 (0.0%) | 0 (0.0%) |
| Total | 141 (81.5%) | 32 (18.5%) |
Employment Characteristics in Bellevue
Employment by Class of Employer in Bellevue
Among the 8,601 employed individuals in Bellevue, private company employees (6,764 | 78.6%), not-for-profit organizations (852 | 9.9%), and self-employed (not incorporated) (349 | 4.1%) make up the most common classes of employment.
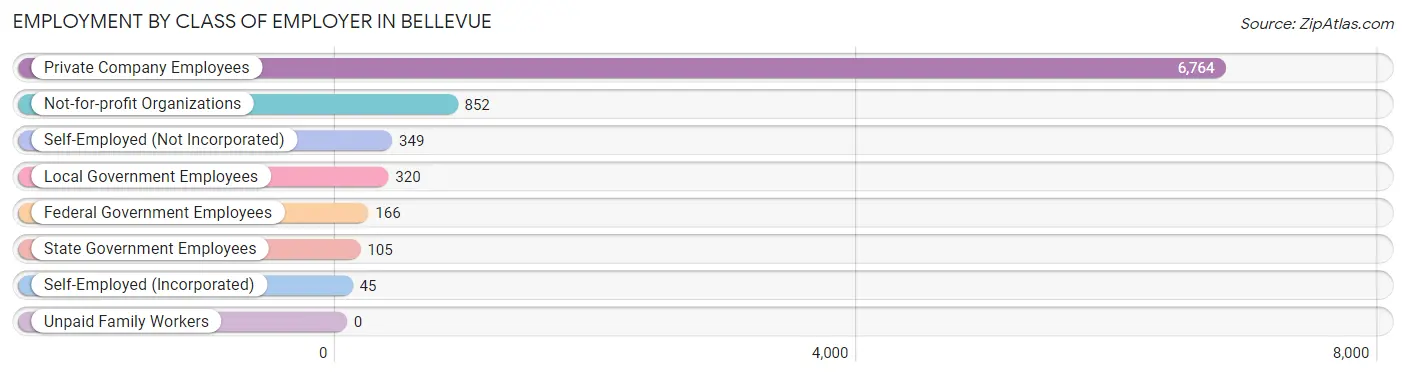
| Employer Class | # Employees | % Employees |
| Private Company Employees | 6,764 | 78.6% |
| Self-Employed (Incorporated) | 45 | 0.5% |
| Self-Employed (Not Incorporated) | 349 | 4.1% |
| Not-for-profit Organizations | 852 | 9.9% |
| Local Government Employees | 320 | 3.7% |
| State Government Employees | 105 | 1.2% |
| Federal Government Employees | 166 | 1.9% |
| Unpaid Family Workers | 0 | 0.0% |
| Total | 8,601 | 100.0% |
Employment Status by Age in Bellevue
According to the labor force statistics for Bellevue, out of the total population over 16 years of age (13,031), 69.2% or 9,017 individuals are in the labor force, with 3.1% or 280 of them unemployed. The age group with the highest labor force participation rate is 35 to 44 years, with 94.6% or 1,945 individuals in the labor force. Within the labor force, the 45 to 54 years age range has the highest percentage of unemployed individuals, with 6.3% or 112 of them being unemployed.
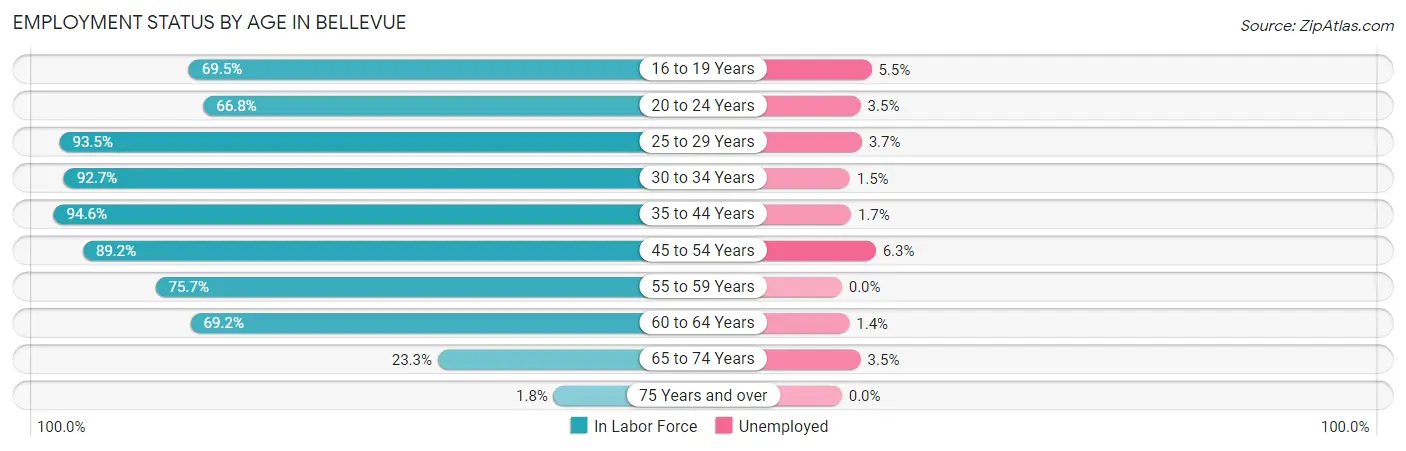
| Age Bracket | In Labor Force | Unemployed |
| 16 to 19 Years | 621 (69.5%) | 34 (5.5%) |
| 20 to 24 Years | 718 (66.8%) | 25 (3.5%) |
| 25 to 29 Years | 843 (93.5%) | 31 (3.7%) |
| 30 to 34 Years | 988 (92.7%) | 15 (1.5%) |
| 35 to 44 Years | 1,945 (94.6%) | 33 (1.7%) |
| 45 to 54 Years | 1,772 (89.2%) | 112 (6.3%) |
| 55 to 59 Years | 932 (75.7%) | 0 (0.0%) |
| 60 to 64 Years | 777 (69.2%) | 11 (1.4%) |
| 65 to 74 Years | 399 (23.3%) | 14 (3.5%) |
| 75 Years and over | 18 (1.8%) | 0 (0.0%) |
| Total | 9,017 (69.2%) | 280 (3.1%) |
Employment Status by Educational Attainment in Bellevue
According to labor force statistics for Bellevue, 86.8% of individuals (7,261) out of the total population between 25 and 64 years of age (8,365) are in the labor force, with 2.8% or 203 of them being unemployed. The group with the highest labor force participation rate are those with the educational attainment of bachelor's degree or higher, with 89.8% or 2,361 individuals in the labor force. Within the labor force, individuals with college / associate degree education have the highest percentage of unemployment, with 4.4% or 114 of them being unemployed.
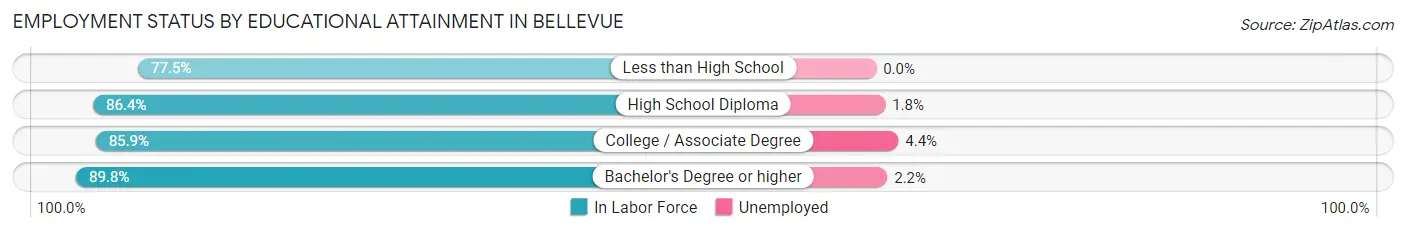
| Educational Attainment | In Labor Force | Unemployed |
| Less than High School | 396 (77.5%) | 0 (0.0%) |
| High School Diploma | 1,899 (86.4%) | 40 (1.8%) |
| College / Associate Degree | 2,600 (85.9%) | 133 (4.4%) |
| Bachelor's Degree or higher | 2,361 (89.8%) | 58 (2.2%) |
| Total | 7,261 (86.8%) | 234 (2.8%) |
Employment Occupations by Sex in Bellevue
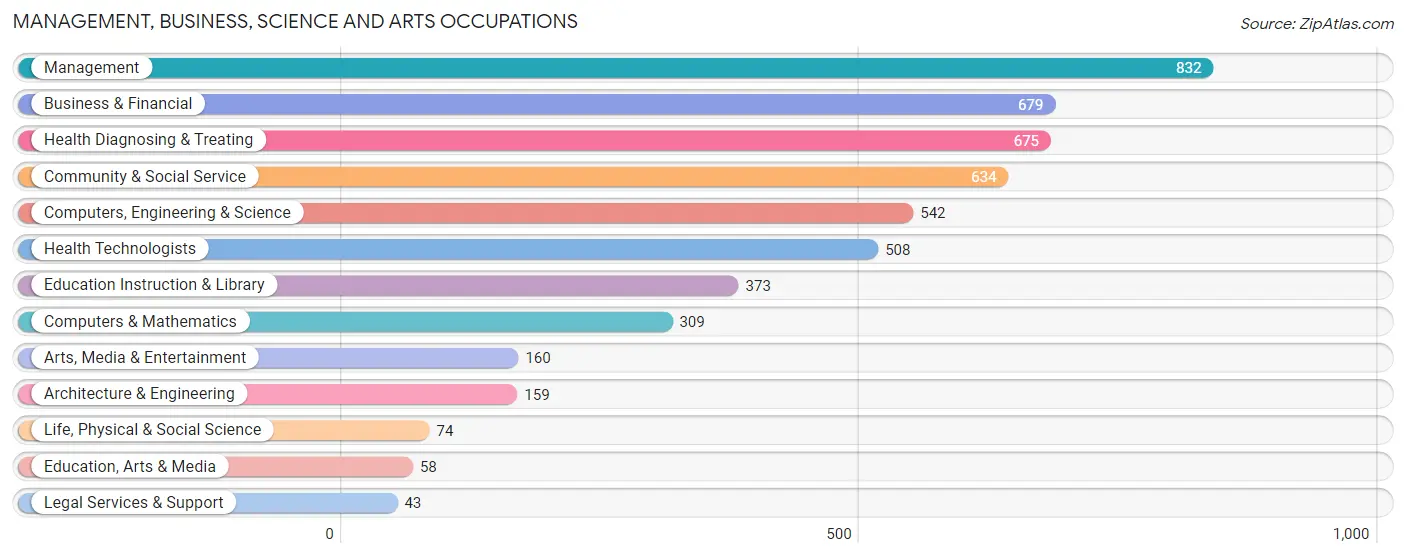
Management, Business, Science and Arts Occupations
The most common Management, Business, Science and Arts occupations in Bellevue are Management (832 | 9.5%), Business & Financial (679 | 7.8%), Health Diagnosing & Treating (675 | 7.7%), Community & Social Service (634 | 7.2%), and Computers, Engineering & Science (542 | 6.2%).
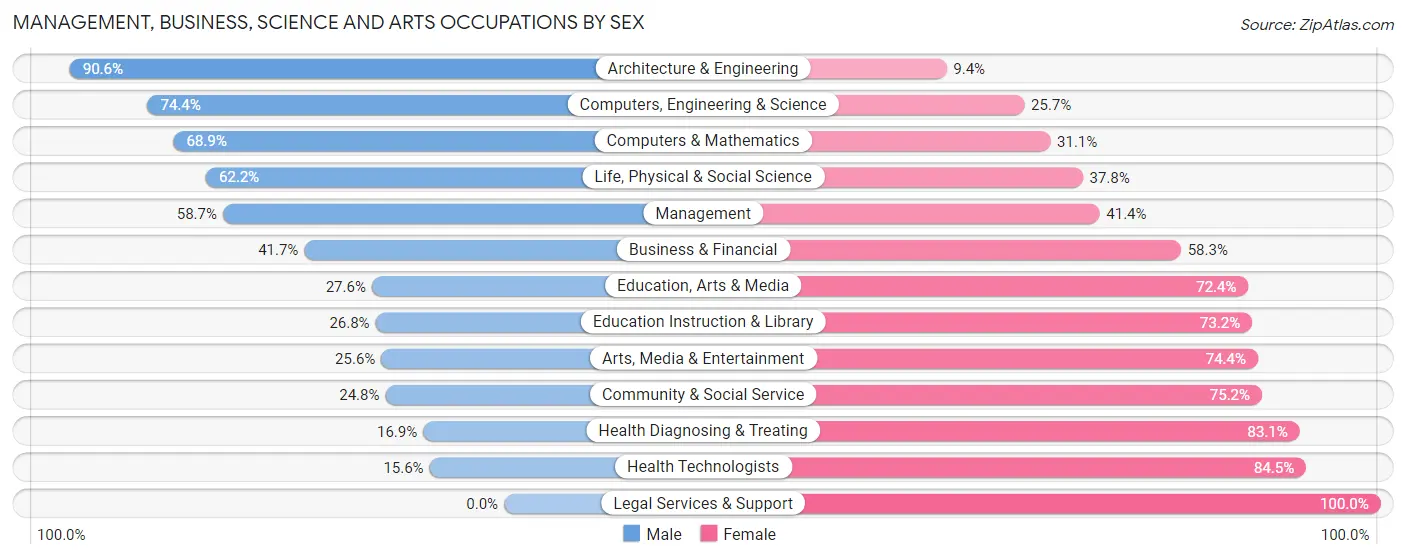
Management, Business, Science and Arts Occupations by Sex
Within the Management, Business, Science and Arts occupations in Bellevue, the most male-oriented occupations are Architecture & Engineering (90.6%), Computers, Engineering & Science (74.4%), and Computers & Mathematics (68.9%), while the most female-oriented occupations are Legal Services & Support (100.0%), Health Technologists (84.5%), and Health Diagnosing & Treating (83.1%).
| Occupation | Male | Female |
| Management | 488 (58.7%) | 344 (41.3%) |
| Business & Financial | 283 (41.7%) | 396 (58.3%) |
| Computers, Engineering & Science | 403 (74.4%) | 139 (25.7%) |
| Computers & Mathematics | 213 (68.9%) | 96 (31.1%) |
| Architecture & Engineering | 144 (90.6%) | 15 (9.4%) |
| Life, Physical & Social Science | 46 (62.2%) | 28 (37.8%) |
| Community & Social Service | 157 (24.8%) | 477 (75.2%) |
| Education, Arts & Media | 16 (27.6%) | 42 (72.4%) |
| Legal Services & Support | 0 (0.0%) | 43 (100.0%) |
| Education Instruction & Library | 100 (26.8%) | 273 (73.2%) |
| Arts, Media & Entertainment | 41 (25.6%) | 119 (74.4%) |
| Health Diagnosing & Treating | 114 (16.9%) | 561 (83.1%) |
| Health Technologists | 79 (15.5%) | 429 (84.5%) |
| Total (Category) | 1,445 (43.0%) | 1,917 (57.0%) |
| Total (Overall) | 4,618 (52.8%) | 4,121 (47.2%) |
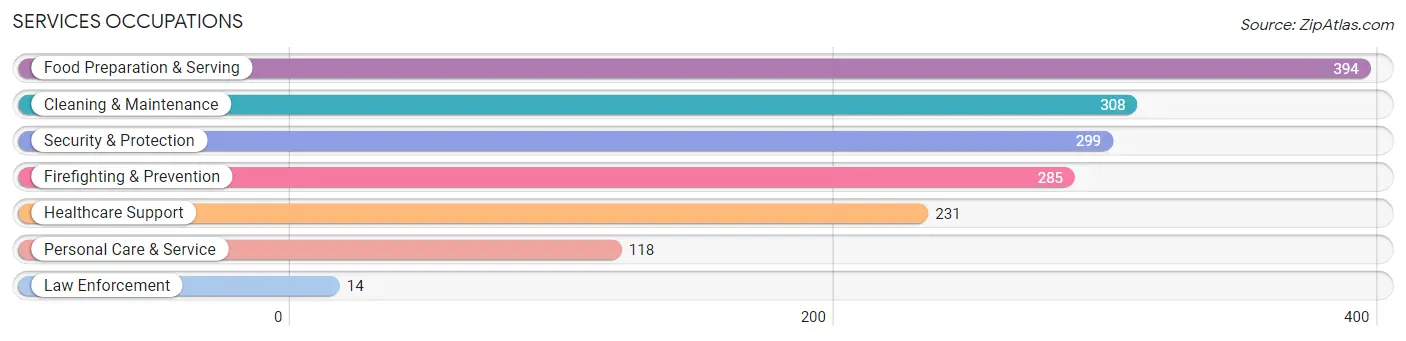
Services Occupations
The most common Services occupations in Bellevue are Food Preparation & Serving (394 | 4.5%), Cleaning & Maintenance (308 | 3.5%), Security & Protection (299 | 3.4%), Firefighting & Prevention (285 | 3.3%), and Healthcare Support (231 | 2.6%).
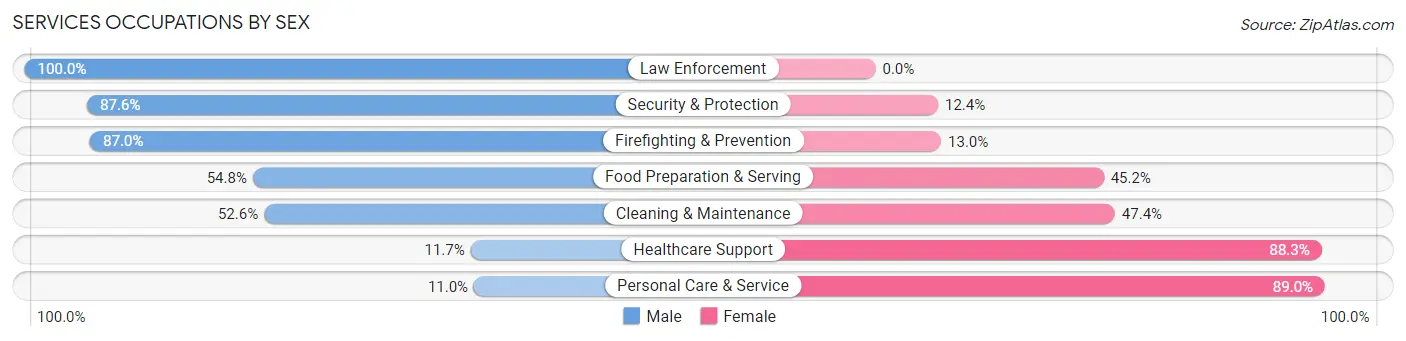
Services Occupations by Sex
Within the Services occupations in Bellevue, the most male-oriented occupations are Law Enforcement (100.0%), Security & Protection (87.6%), and Firefighting & Prevention (87.0%), while the most female-oriented occupations are Personal Care & Service (89.0%), Healthcare Support (88.3%), and Cleaning & Maintenance (47.4%).
| Occupation | Male | Female |
| Healthcare Support | 27 (11.7%) | 204 (88.3%) |
| Security & Protection | 262 (87.6%) | 37 (12.4%) |
| Firefighting & Prevention | 248 (87.0%) | 37 (13.0%) |
| Law Enforcement | 14 (100.0%) | 0 (0.0%) |
| Food Preparation & Serving | 216 (54.8%) | 178 (45.2%) |
| Cleaning & Maintenance | 162 (52.6%) | 146 (47.4%) |
| Personal Care & Service | 13 (11.0%) | 105 (89.0%) |
| Total (Category) | 680 (50.4%) | 670 (49.6%) |
| Total (Overall) | 4,618 (52.8%) | 4,121 (47.2%) |
Sales and Office Occupations
The most common Sales and Office occupations in Bellevue are Office & Administration (971 | 11.1%), and Sales & Related (868 | 9.9%).
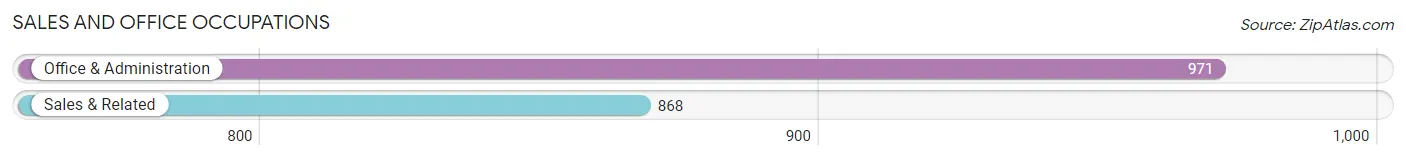
Sales and Office Occupations by Sex

| Occupation | Male | Female |
| Sales & Related | 486 (56.0%) | 382 (44.0%) |
| Office & Administration | 194 (20.0%) | 777 (80.0%) |
| Total (Category) | 680 (37.0%) | 1,159 (63.0%) |
| Total (Overall) | 4,618 (52.8%) | 4,121 (47.2%) |
Natural Resources, Construction and Maintenance Occupations
The most common Natural Resources, Construction and Maintenance occupations in Bellevue are Construction & Extraction (253 | 2.9%), Installation, Maintenance & Repair (152 | 1.7%), and Farming, Fishing & Forestry (27 | 0.3%).

Natural Resources, Construction and Maintenance Occupations by Sex
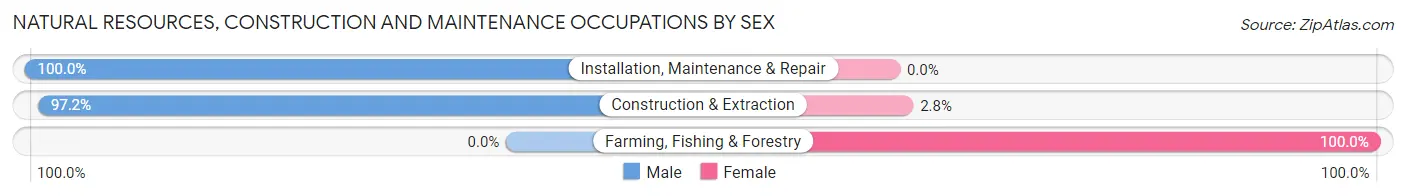
| Occupation | Male | Female |
| Farming, Fishing & Forestry | 0 (0.0%) | 27 (100.0%) |
| Construction & Extraction | 246 (97.2%) | 7 (2.8%) |
| Installation, Maintenance & Repair | 152 (100.0%) | 0 (0.0%) |
| Total (Category) | 398 (92.1%) | 34 (7.9%) |
| Total (Overall) | 4,618 (52.8%) | 4,121 (47.2%) |
Production, Transportation and Moving Occupations
The most common Production, Transportation and Moving occupations in Bellevue are Production (778 | 8.9%), Material Moving (574 | 6.6%), and Transportation (404 | 4.6%).
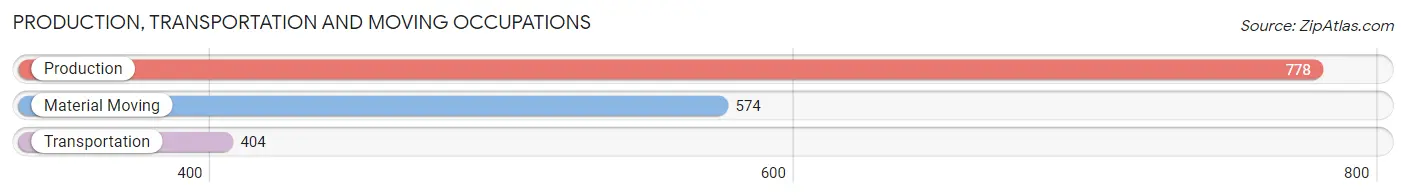
Production, Transportation and Moving Occupations by Sex
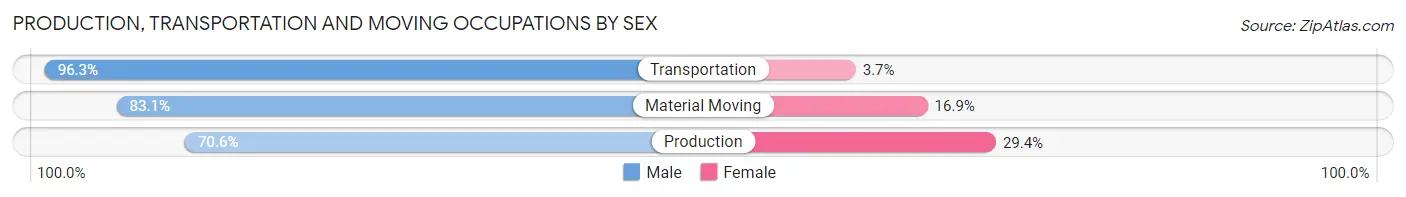
| Occupation | Male | Female |
| Production | 549 (70.6%) | 229 (29.4%) |
| Transportation | 389 (96.3%) | 15 (3.7%) |
| Material Moving | 477 (83.1%) | 97 (16.9%) |
| Total (Category) | 1,415 (80.6%) | 341 (19.4%) |
| Total (Overall) | 4,618 (52.8%) | 4,121 (47.2%) |
Employment Industries by Sex in Bellevue
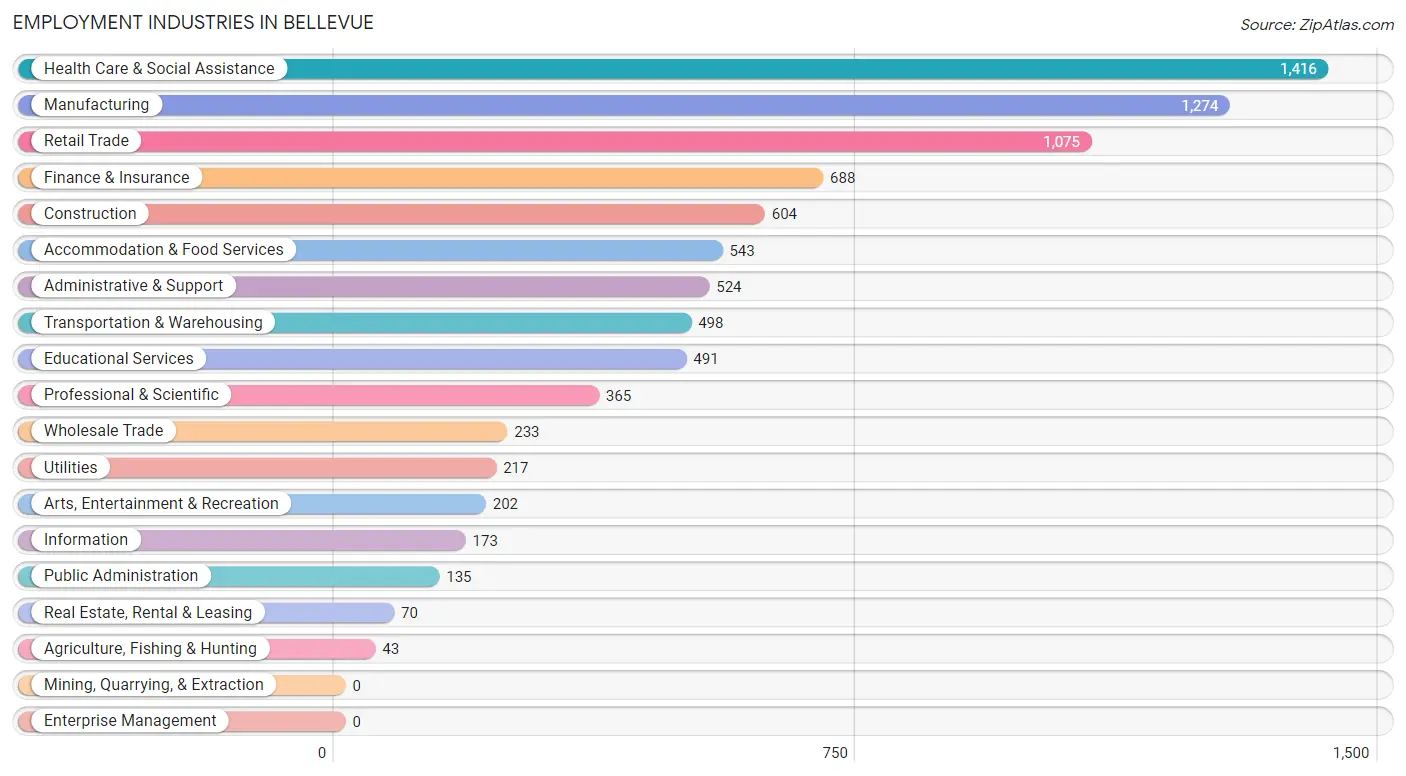
Employment Industries in Bellevue
The major employment industries in Bellevue include Health Care & Social Assistance (1,416 | 16.2%), Manufacturing (1,274 | 14.6%), Retail Trade (1,075 | 12.3%), Finance & Insurance (688 | 7.9%), and Construction (604 | 6.9%).
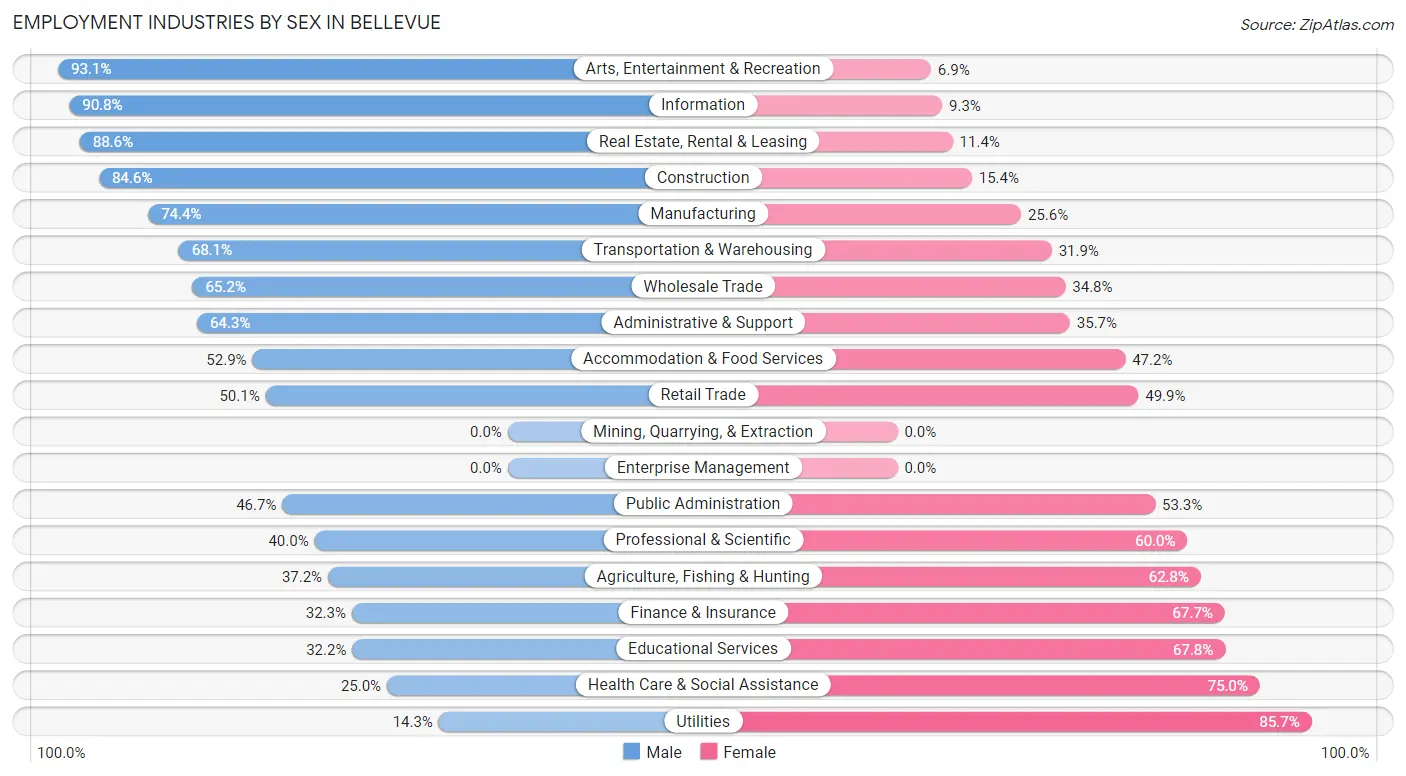
Employment Industries by Sex in Bellevue
The Bellevue industries that see more men than women are Arts, Entertainment & Recreation (93.1%), Information (90.7%), and Real Estate, Rental & Leasing (88.6%), whereas the industries that tend to have a higher number of women are Utilities (85.7%), Health Care & Social Assistance (75.0%), and Educational Services (67.8%).
| Industry | Male | Female |
| Agriculture, Fishing & Hunting | 16 (37.2%) | 27 (62.8%) |
| Mining, Quarrying, & Extraction | 0 (0.0%) | 0 (0.0%) |
| Construction | 511 (84.6%) | 93 (15.4%) |
| Manufacturing | 948 (74.4%) | 326 (25.6%) |
| Wholesale Trade | 152 (65.2%) | 81 (34.8%) |
| Retail Trade | 539 (50.1%) | 536 (49.9%) |
| Transportation & Warehousing | 339 (68.1%) | 159 (31.9%) |
| Utilities | 31 (14.3%) | 186 (85.7%) |
| Information | 157 (90.7%) | 16 (9.2%) |
| Finance & Insurance | 222 (32.3%) | 466 (67.7%) |
| Real Estate, Rental & Leasing | 62 (88.6%) | 8 (11.4%) |
| Professional & Scientific | 146 (40.0%) | 219 (60.0%) |
| Enterprise Management | 0 (0.0%) | 0 (0.0%) |
| Administrative & Support | 337 (64.3%) | 187 (35.7%) |
| Educational Services | 158 (32.2%) | 333 (67.8%) |
| Health Care & Social Assistance | 354 (25.0%) | 1,062 (75.0%) |
| Arts, Entertainment & Recreation | 188 (93.1%) | 14 (6.9%) |
| Accommodation & Food Services | 287 (52.8%) | 256 (47.1%) |
| Public Administration | 63 (46.7%) | 72 (53.3%) |
| Total | 4,618 (52.8%) | 4,121 (47.2%) |
Education in Bellevue
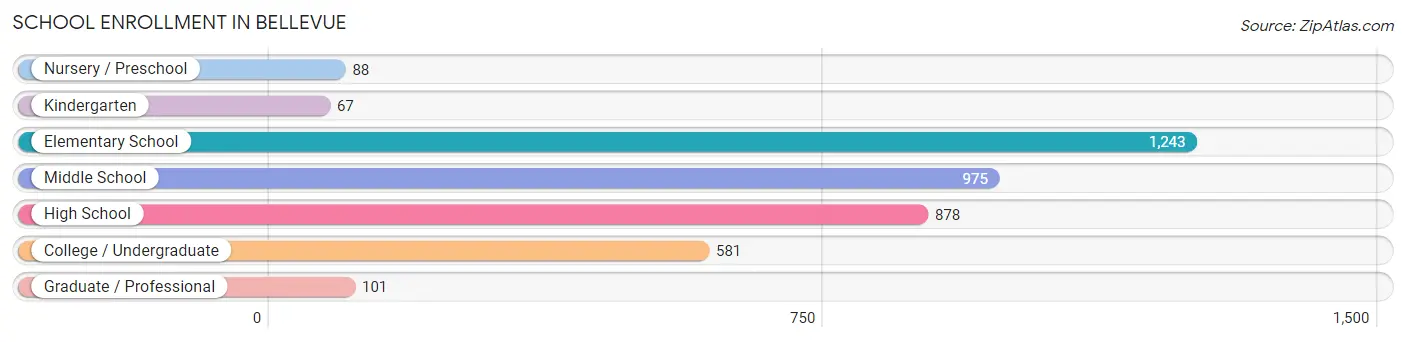
School Enrollment in Bellevue
The most common levels of schooling among the 3,933 students in Bellevue are elementary school (1,243 | 31.6%), middle school (975 | 24.8%), and high school (878 | 22.3%).
| School Level | # Students | % Students |
| Nursery / Preschool | 88 | 2.2% |
| Kindergarten | 67 | 1.7% |
| Elementary School | 1,243 | 31.6% |
| Middle School | 975 | 24.8% |
| High School | 878 | 22.3% |
| College / Undergraduate | 581 | 14.8% |
| Graduate / Professional | 101 | 2.6% |
| Total | 3,933 | 100.0% |
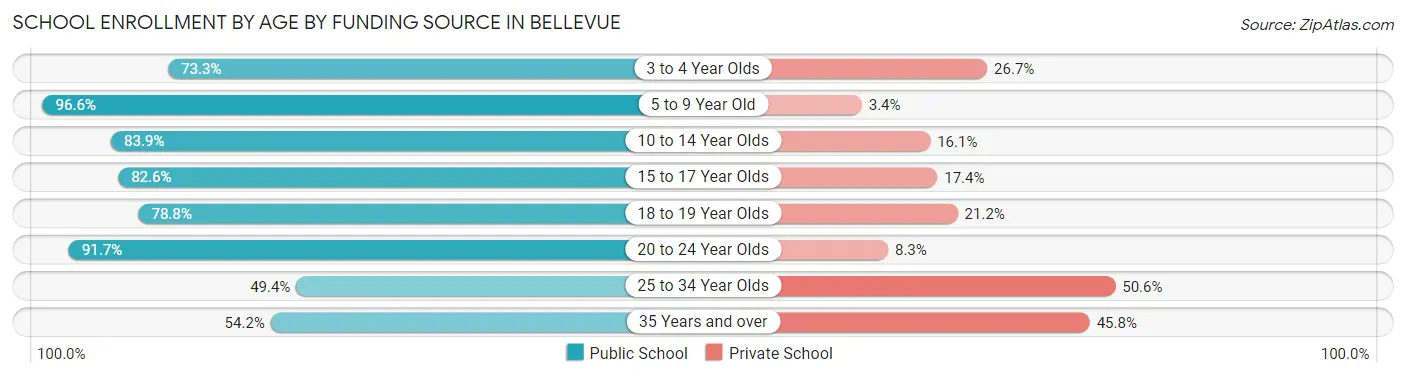
School Enrollment by Age by Funding Source in Bellevue
Out of a total of 3,933 students who are enrolled in schools in Bellevue, 574 (14.6%) attend a private institution, while the remaining 3,359 (85.4%) are enrolled in public schools. The age group of 25 to 34 year olds has the highest likelihood of being enrolled in private schools, with 43 (50.6% in the age bracket) enrolled. Conversely, the age group of 5 to 9 year old has the lowest likelihood of being enrolled in a private school, with 860 (96.6% in the age bracket) attending a public institution.
| Age Bracket | Public School | Private School |
| 3 to 4 Year Olds | 74 (73.3%) | 27 (26.7%) |
| 5 to 9 Year Old | 860 (96.6%) | 30 (3.4%) |
| 10 to 14 Year Olds | 1,223 (83.9%) | 235 (16.1%) |
| 15 to 17 Year Olds | 568 (82.6%) | 120 (17.4%) |
| 18 to 19 Year Olds | 141 (78.8%) | 38 (21.2%) |
| 20 to 24 Year Olds | 400 (91.7%) | 36 (8.3%) |
| 25 to 34 Year Olds | 42 (49.4%) | 43 (50.6%) |
| 35 Years and over | 52 (54.2%) | 44 (45.8%) |
| Total | 3,359 (85.4%) | 574 (14.6%) |
Educational Attainment by Field of Study in Bellevue
Business (834 | 26.7%), bio, nature & agricultural (491 | 15.7%), engineering (293 | 9.4%), education (282 | 9.0%), and science & technology (260 | 8.3%) are the most common fields of study among 3,130 individuals in Bellevue who have obtained a bachelor's degree or higher.
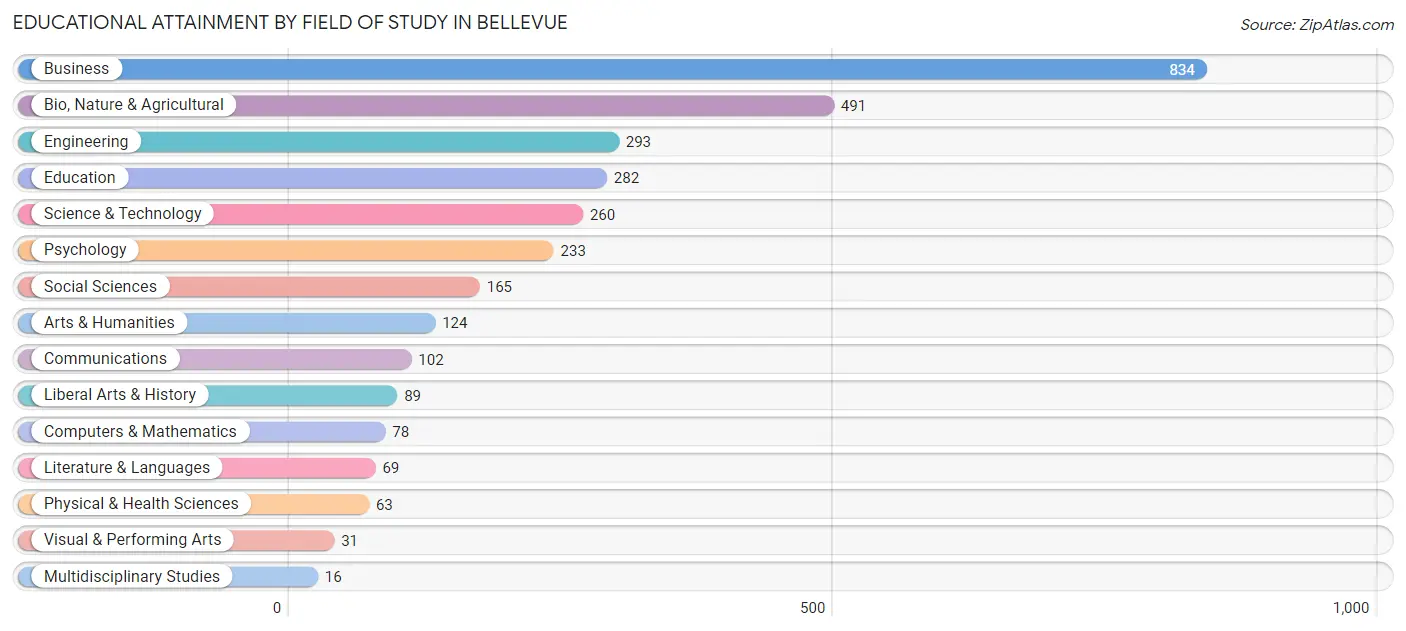
| Field of Study | # Graduates | % Graduates |
| Computers & Mathematics | 78 | 2.5% |
| Bio, Nature & Agricultural | 491 | 15.7% |
| Physical & Health Sciences | 63 | 2.0% |
| Psychology | 233 | 7.4% |
| Social Sciences | 165 | 5.3% |
| Engineering | 293 | 9.4% |
| Multidisciplinary Studies | 16 | 0.5% |
| Science & Technology | 260 | 8.3% |
| Business | 834 | 26.7% |
| Education | 282 | 9.0% |
| Literature & Languages | 69 | 2.2% |
| Liberal Arts & History | 89 | 2.8% |
| Visual & Performing Arts | 31 | 1.0% |
| Communications | 102 | 3.3% |
| Arts & Humanities | 124 | 4.0% |
| Total | 3,130 | 100.0% |
Transportation & Commute in Bellevue
Vehicle Availability by Sex in Bellevue
The most prevalent vehicle ownership categories in Bellevue are males with 2 vehicles (2,010, accounting for 44.0%) and females with 2 vehicles (1,767, making up 49.9%).
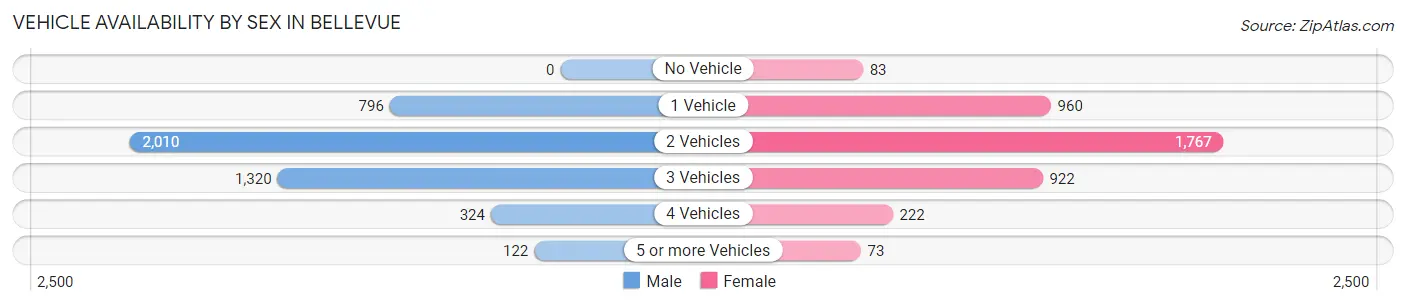
| Vehicles Available | Male | Female |
| No Vehicle | 0 (0.0%) | 83 (2.1%) |
| 1 Vehicle | 796 (17.4%) | 960 (23.8%) |
| 2 Vehicles | 2,010 (44.0%) | 1,767 (43.9%) |
| 3 Vehicles | 1,320 (28.9%) | 922 (22.9%) |
| 4 Vehicles | 324 (7.1%) | 222 (5.5%) |
| 5 or more Vehicles | 122 (2.7%) | 73 (1.8%) |
| Total | 4,572 (100.0%) | 4,027 (100.0%) |
Commute Time in Bellevue
The most frequently occuring commute durations in Bellevue are 15 to 19 minutes (2,125 commuters, 26.7%), 5 to 9 minutes (1,638 commuters, 20.5%), and 20 to 24 minutes (1,451 commuters, 18.2%).
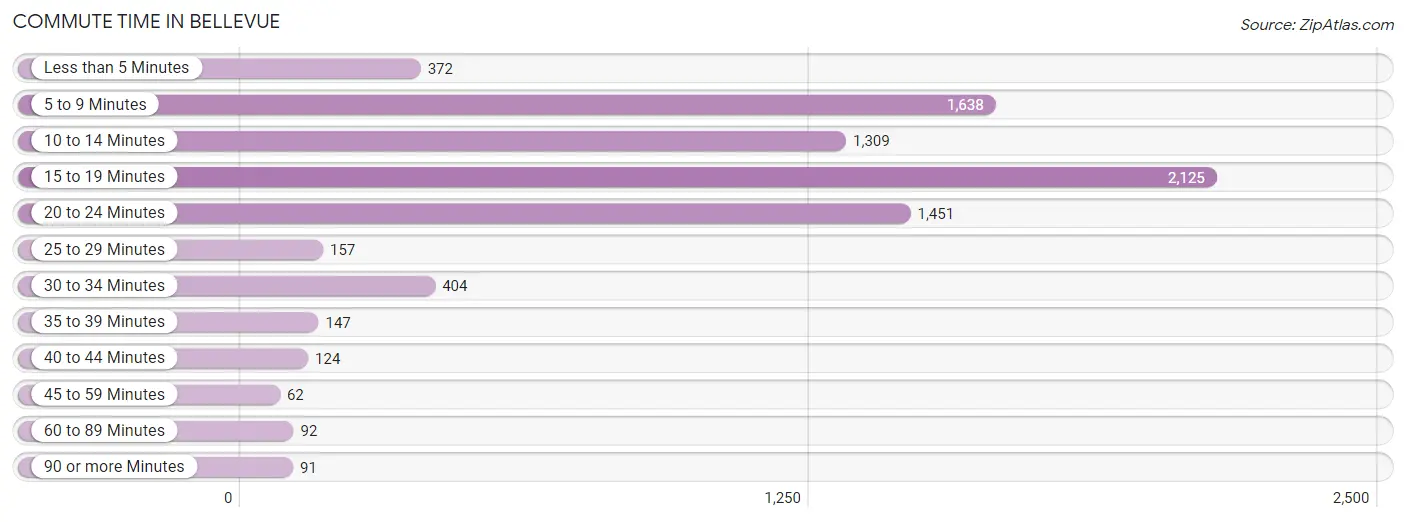
| Commute Time | # Commuters | % Commuters |
| Less than 5 Minutes | 372 | 4.7% |
| 5 to 9 Minutes | 1,638 | 20.5% |
| 10 to 14 Minutes | 1,309 | 16.4% |
| 15 to 19 Minutes | 2,125 | 26.7% |
| 20 to 24 Minutes | 1,451 | 18.2% |
| 25 to 29 Minutes | 157 | 2.0% |
| 30 to 34 Minutes | 404 | 5.1% |
| 35 to 39 Minutes | 147 | 1.8% |
| 40 to 44 Minutes | 124 | 1.6% |
| 45 to 59 Minutes | 62 | 0.8% |
| 60 to 89 Minutes | 92 | 1.1% |
| 90 or more Minutes | 91 | 1.1% |
Commute Time by Sex in Bellevue
The most common commute times in Bellevue are 15 to 19 minutes (1,158 commuters, 27.4%) for males and 15 to 19 minutes (967 commuters, 25.8%) for females.

| Commute Time | Male | Female |
| Less than 5 Minutes | 242 (5.7%) | 130 (3.5%) |
| 5 to 9 Minutes | 785 (18.6%) | 853 (22.8%) |
| 10 to 14 Minutes | 522 (12.4%) | 787 (21.0%) |
| 15 to 19 Minutes | 1,158 (27.4%) | 967 (25.8%) |
| 20 to 24 Minutes | 893 (21.1%) | 558 (14.9%) |
| 25 to 29 Minutes | 79 (1.9%) | 78 (2.1%) |
| 30 to 34 Minutes | 199 (4.7%) | 205 (5.5%) |
| 35 to 39 Minutes | 121 (2.9%) | 26 (0.7%) |
| 40 to 44 Minutes | 74 (1.8%) | 50 (1.3%) |
| 45 to 59 Minutes | 62 (1.5%) | 0 (0.0%) |
| 60 to 89 Minutes | 15 (0.4%) | 77 (2.1%) |
| 90 or more Minutes | 75 (1.8%) | 16 (0.4%) |
Time of Departure to Work by Sex in Bellevue
The most frequent times of departure to work in Bellevue are 7:00 AM to 7:29 AM (670, 15.9%) for males and 7:30 AM to 7:59 AM (688, 18.4%) for females.
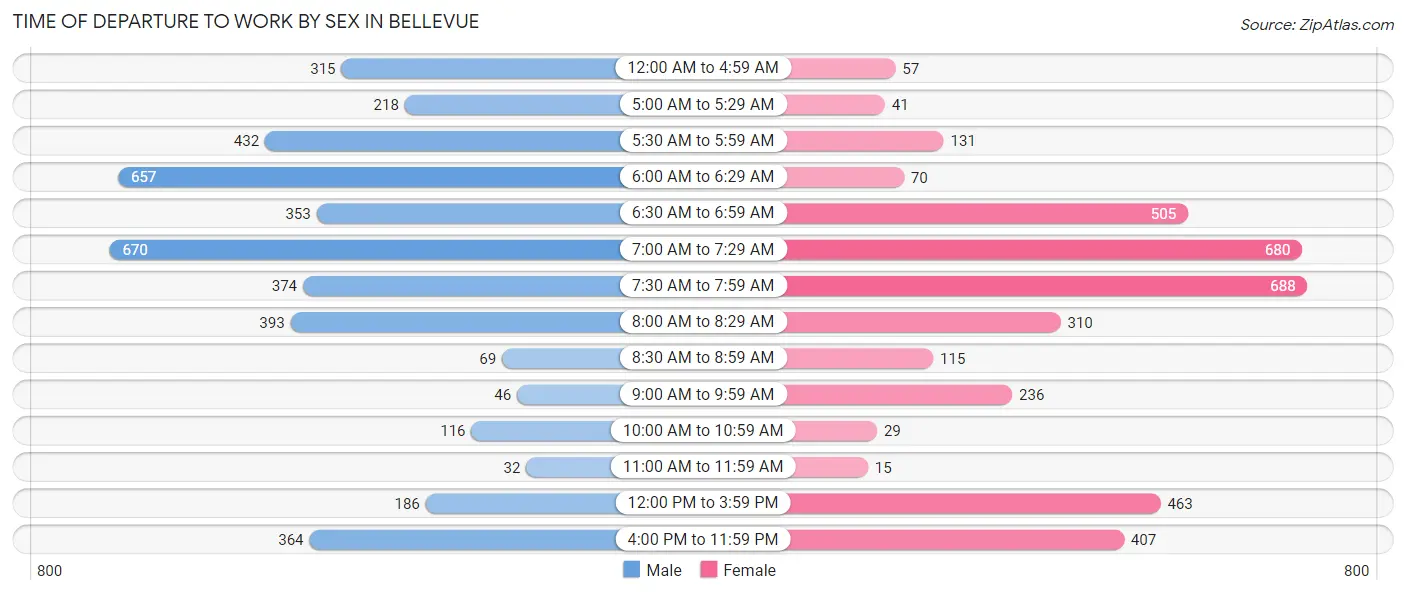
| Time of Departure | Male | Female |
| 12:00 AM to 4:59 AM | 315 (7.5%) | 57 (1.5%) |
| 5:00 AM to 5:29 AM | 218 (5.2%) | 41 (1.1%) |
| 5:30 AM to 5:59 AM | 432 (10.2%) | 131 (3.5%) |
| 6:00 AM to 6:29 AM | 657 (15.5%) | 70 (1.9%) |
| 6:30 AM to 6:59 AM | 353 (8.4%) | 505 (13.5%) |
| 7:00 AM to 7:29 AM | 670 (15.9%) | 680 (18.1%) |
| 7:30 AM to 7:59 AM | 374 (8.8%) | 688 (18.4%) |
| 8:00 AM to 8:29 AM | 393 (9.3%) | 310 (8.3%) |
| 8:30 AM to 8:59 AM | 69 (1.6%) | 115 (3.1%) |
| 9:00 AM to 9:59 AM | 46 (1.1%) | 236 (6.3%) |
| 10:00 AM to 10:59 AM | 116 (2.8%) | 29 (0.8%) |
| 11:00 AM to 11:59 AM | 32 (0.8%) | 15 (0.4%) |
| 12:00 PM to 3:59 PM | 186 (4.4%) | 463 (12.4%) |
| 4:00 PM to 11:59 PM | 364 (8.6%) | 407 (10.9%) |
| Total | 4,225 (100.0%) | 3,747 (100.0%) |
Housing Occupancy in Bellevue
Occupancy by Ownership in Bellevue
Of the total 6,800 dwellings in Bellevue, owner-occupied units account for 4,356 (64.1%), while renter-occupied units make up 2,444 (35.9%).
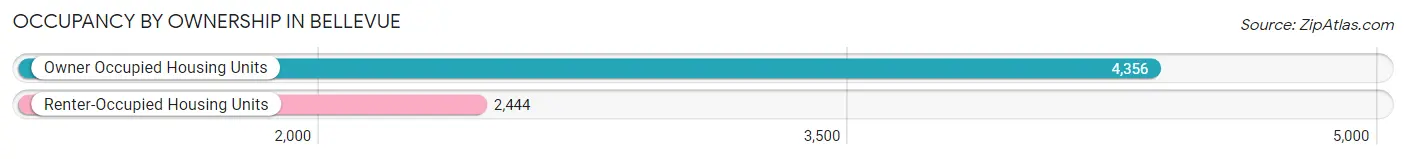
| Occupancy | # Housing Units | % Housing Units |
| Owner Occupied Housing Units | 4,356 | 64.1% |
| Renter-Occupied Housing Units | 2,444 | 35.9% |
| Total Occupied Housing Units | 6,800 | 100.0% |
Occupancy by Household Size in Bellevue
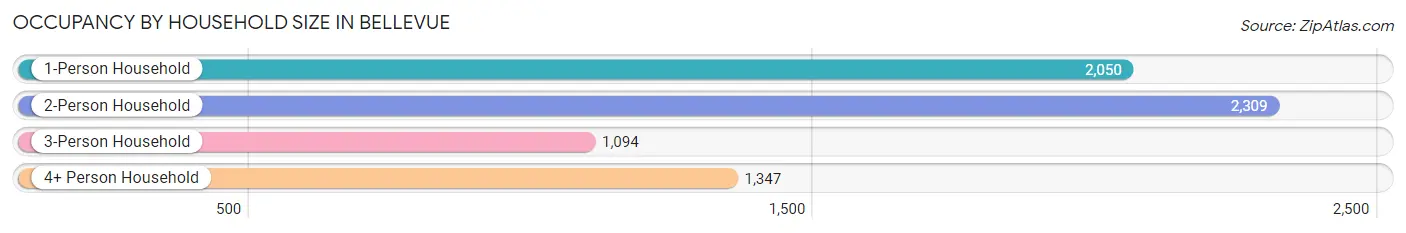
| Household Size | # Housing Units | % Housing Units |
| 1-Person Household | 2,050 | 30.1% |
| 2-Person Household | 2,309 | 34.0% |
| 3-Person Household | 1,094 | 16.1% |
| 4+ Person Household | 1,347 | 19.8% |
| Total Housing Units | 6,800 | 100.0% |
Occupancy by Ownership by Household Size in Bellevue
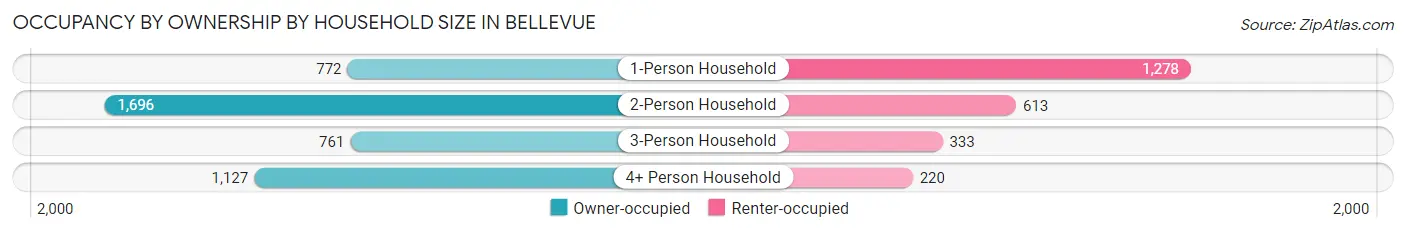
| Household Size | Owner-occupied | Renter-occupied |
| 1-Person Household | 772 (37.7%) | 1,278 (62.3%) |
| 2-Person Household | 1,696 (73.5%) | 613 (26.6%) |
| 3-Person Household | 761 (69.6%) | 333 (30.4%) |
| 4+ Person Household | 1,127 (83.7%) | 220 (16.3%) |
| Total Housing Units | 4,356 (64.1%) | 2,444 (35.9%) |
Occupancy by Educational Attainment in Bellevue
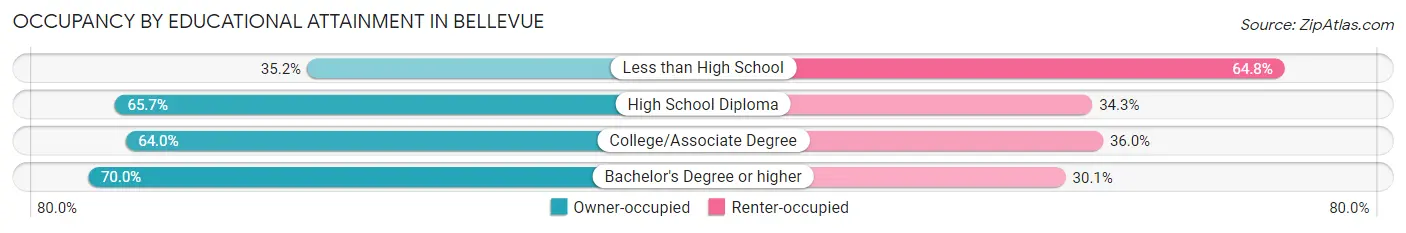
| Household Size | Owner-occupied | Renter-occupied |
| Less than High School | 168 (35.2%) | 309 (64.8%) |
| High School Diploma | 1,329 (65.7%) | 693 (34.3%) |
| College/Associate Degree | 1,616 (64.0%) | 908 (36.0%) |
| Bachelor's Degree or higher | 1,243 (70.0%) | 534 (30.0%) |
Occupancy by Age of Householder in Bellevue
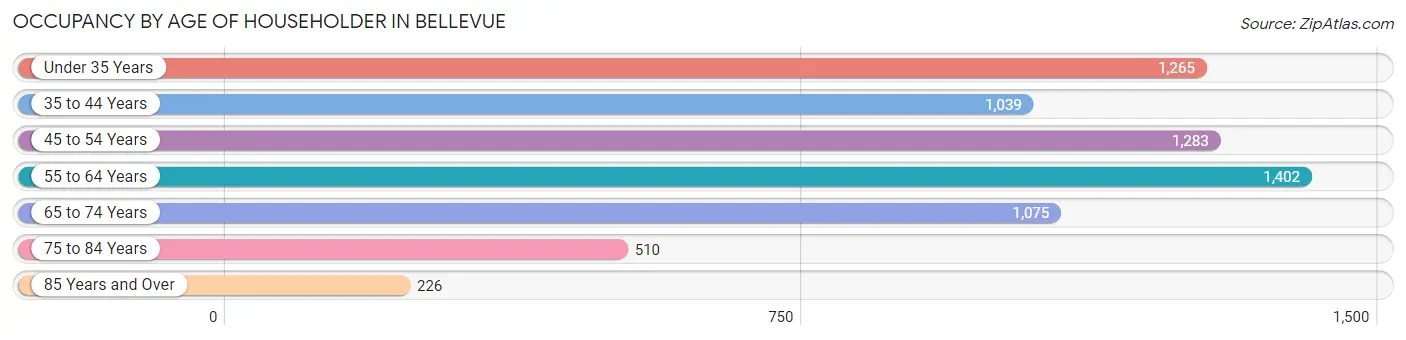
| Age Bracket | # Households | % Households |
| Under 35 Years | 1,265 | 18.6% |
| 35 to 44 Years | 1,039 | 15.3% |
| 45 to 54 Years | 1,283 | 18.9% |
| 55 to 64 Years | 1,402 | 20.6% |
| 65 to 74 Years | 1,075 | 15.8% |
| 75 to 84 Years | 510 | 7.5% |
| 85 Years and Over | 226 | 3.3% |
| Total | 6,800 | 100.0% |
Housing Finances in Bellevue
Median Income by Occupancy in Bellevue
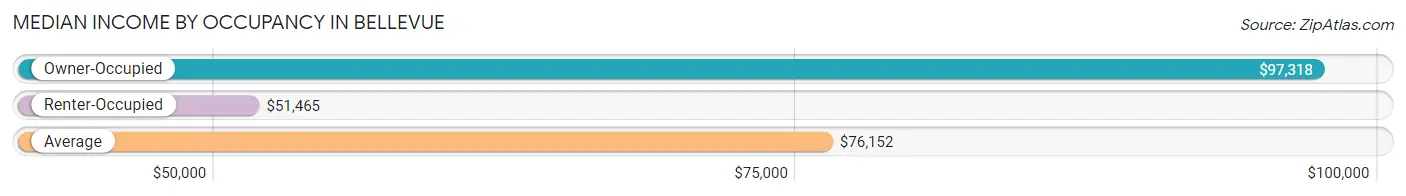
| Occupancy Type | # Households | Median Income |
| Owner-Occupied | 4,356 (64.1%) | $97,318 |
| Renter-Occupied | 2,444 (35.9%) | $51,465 |
| Average | 6,800 (100.0%) | $76,152 |
Occupancy by Householder Income Bracket in Bellevue
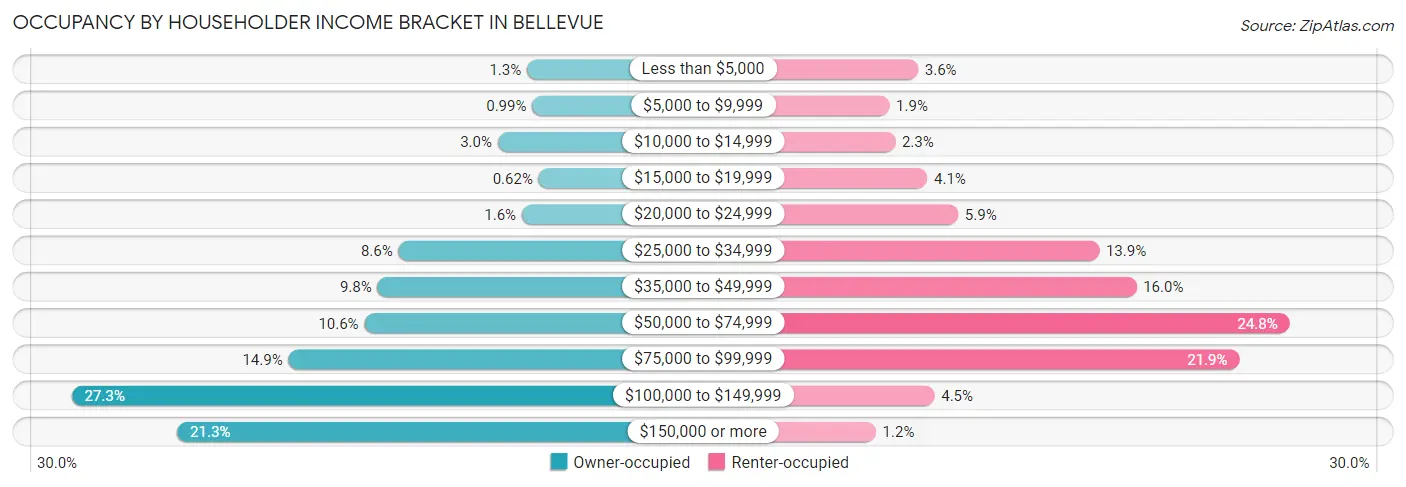
| Income Bracket | Owner-occupied | Renter-occupied |
| Less than $5,000 | 56 (1.3%) | 87 (3.6%) |
| $5,000 to $9,999 | 43 (1.0%) | 47 (1.9%) |
| $10,000 to $14,999 | 129 (3.0%) | 55 (2.2%) |
| $15,000 to $19,999 | 27 (0.6%) | 100 (4.1%) |
| $20,000 to $24,999 | 69 (1.6%) | 143 (5.9%) |
| $25,000 to $34,999 | 376 (8.6%) | 340 (13.9%) |
| $35,000 to $49,999 | 428 (9.8%) | 392 (16.0%) |
| $50,000 to $74,999 | 461 (10.6%) | 606 (24.8%) |
| $75,000 to $99,999 | 650 (14.9%) | 536 (21.9%) |
| $100,000 to $149,999 | 1,190 (27.3%) | 110 (4.5%) |
| $150,000 or more | 927 (21.3%) | 28 (1.1%) |
| Total | 4,356 (100.0%) | 2,444 (100.0%) |
Monthly Housing Cost Tiers in Bellevue
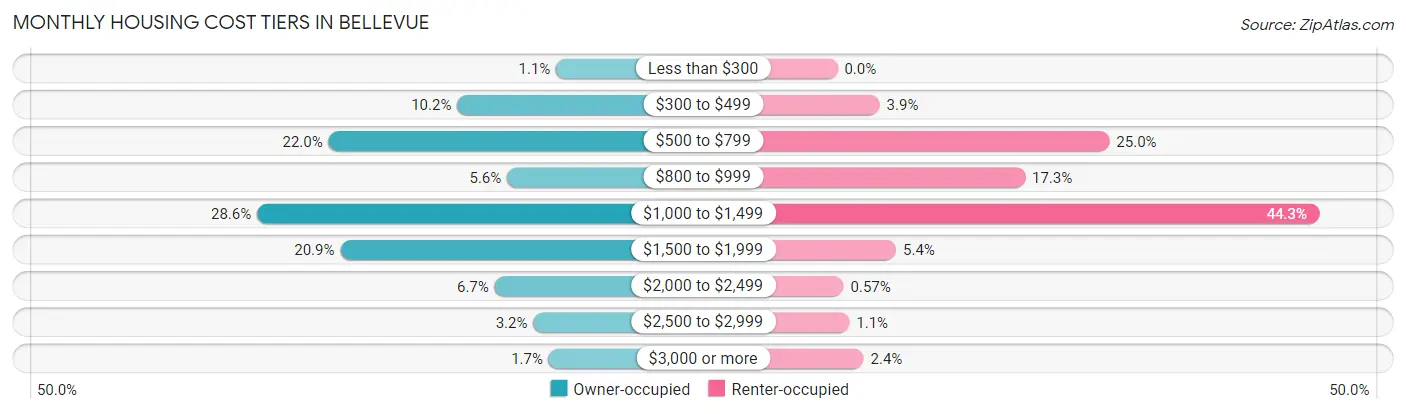
| Monthly Cost | Owner-occupied | Renter-occupied |
| Less than $300 | 46 (1.1%) | 0 (0.0%) |
| $300 to $499 | 443 (10.2%) | 95 (3.9%) |
| $500 to $799 | 959 (22.0%) | 612 (25.0%) |
| $800 to $999 | 243 (5.6%) | 422 (17.3%) |
| $1,000 to $1,499 | 1,246 (28.6%) | 1,083 (44.3%) |
| $1,500 to $1,999 | 912 (20.9%) | 132 (5.4%) |
| $2,000 to $2,499 | 293 (6.7%) | 14 (0.6%) |
| $2,500 to $2,999 | 138 (3.2%) | 27 (1.1%) |
| $3,000 or more | 76 (1.7%) | 59 (2.4%) |
| Total | 4,356 (100.0%) | 2,444 (100.0%) |
Physical Housing Characteristics in Bellevue
Housing Structures in Bellevue
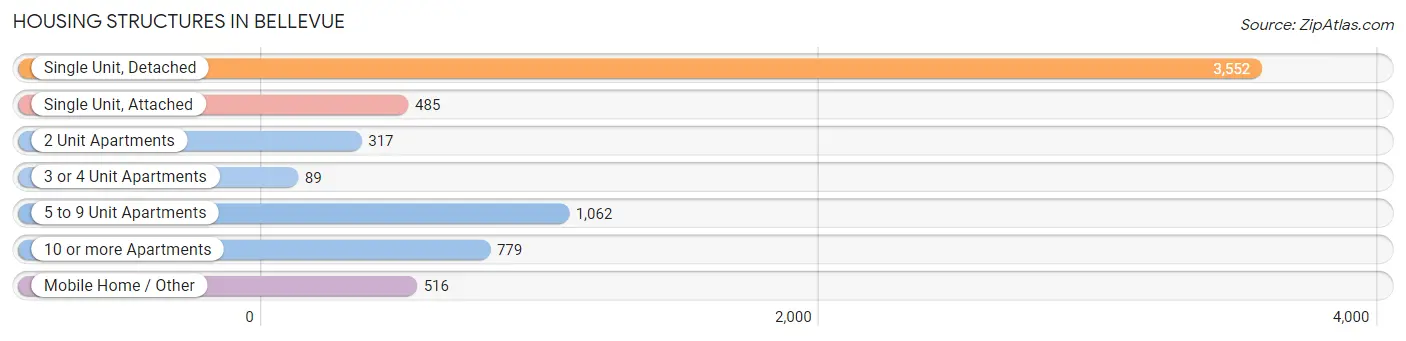
| Structure Type | # Housing Units | % Housing Units |
| Single Unit, Detached | 3,552 | 52.2% |
| Single Unit, Attached | 485 | 7.1% |
| 2 Unit Apartments | 317 | 4.7% |
| 3 or 4 Unit Apartments | 89 | 1.3% |
| 5 to 9 Unit Apartments | 1,062 | 15.6% |
| 10 or more Apartments | 779 | 11.5% |
| Mobile Home / Other | 516 | 7.6% |
| Total | 6,800 | 100.0% |
Housing Structures by Occupancy in Bellevue
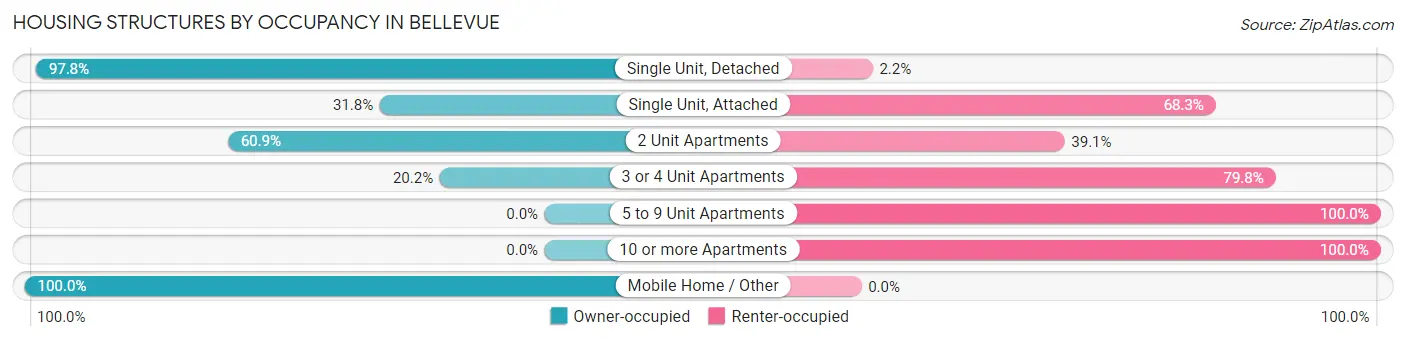
| Structure Type | Owner-occupied | Renter-occupied |
| Single Unit, Detached | 3,475 (97.8%) | 77 (2.2%) |
| Single Unit, Attached | 154 (31.8%) | 331 (68.2%) |
| 2 Unit Apartments | 193 (60.9%) | 124 (39.1%) |
| 3 or 4 Unit Apartments | 18 (20.2%) | 71 (79.8%) |
| 5 to 9 Unit Apartments | 0 (0.0%) | 1,062 (100.0%) |
| 10 or more Apartments | 0 (0.0%) | 779 (100.0%) |
| Mobile Home / Other | 516 (100.0%) | 0 (0.0%) |
| Total | 4,356 (64.1%) | 2,444 (35.9%) |
Housing Structures by Number of Rooms in Bellevue
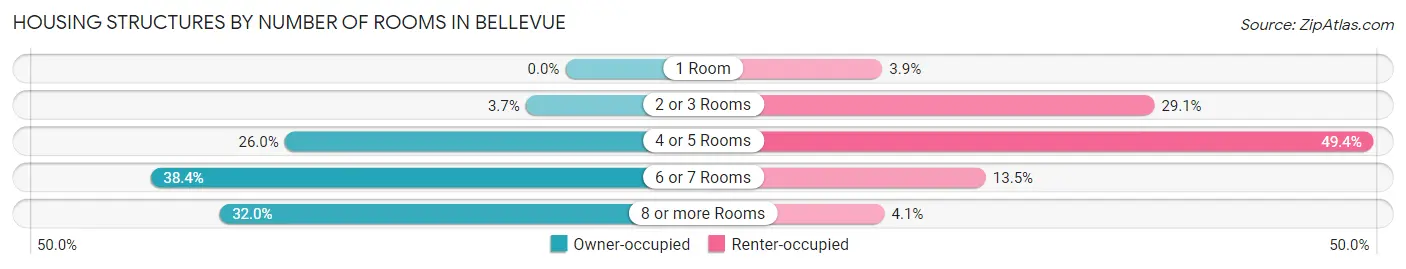
| Number of Rooms | Owner-occupied | Renter-occupied |
| 1 Room | 0 (0.0%) | 96 (3.9%) |
| 2 or 3 Rooms | 160 (3.7%) | 711 (29.1%) |
| 4 or 5 Rooms | 1,131 (26.0%) | 1,206 (49.3%) |
| 6 or 7 Rooms | 1,671 (38.4%) | 330 (13.5%) |
| 8 or more Rooms | 1,394 (32.0%) | 101 (4.1%) |
| Total | 4,356 (100.0%) | 2,444 (100.0%) |
Housing Structure by Heating Type in Bellevue
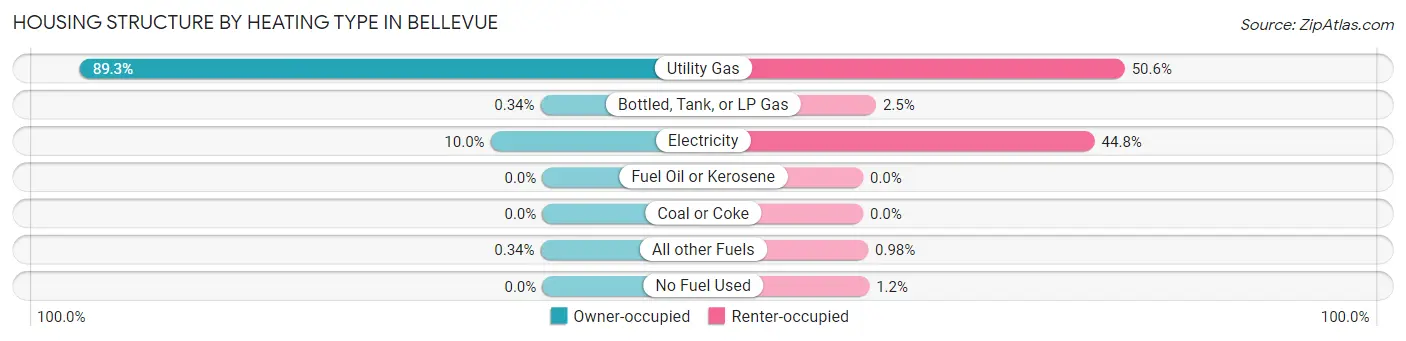
| Heating Type | Owner-occupied | Renter-occupied |
| Utility Gas | 3,891 (89.3%) | 1,236 (50.6%) |
| Bottled, Tank, or LP Gas | 15 (0.3%) | 61 (2.5%) |
| Electricity | 435 (10.0%) | 1,094 (44.8%) |
| Fuel Oil or Kerosene | 0 (0.0%) | 0 (0.0%) |
| Coal or Coke | 0 (0.0%) | 0 (0.0%) |
| All other Fuels | 15 (0.3%) | 24 (1.0%) |
| No Fuel Used | 0 (0.0%) | 29 (1.2%) |
| Total | 4,356 (100.0%) | 2,444 (100.0%) |
Household Vehicle Usage in Bellevue
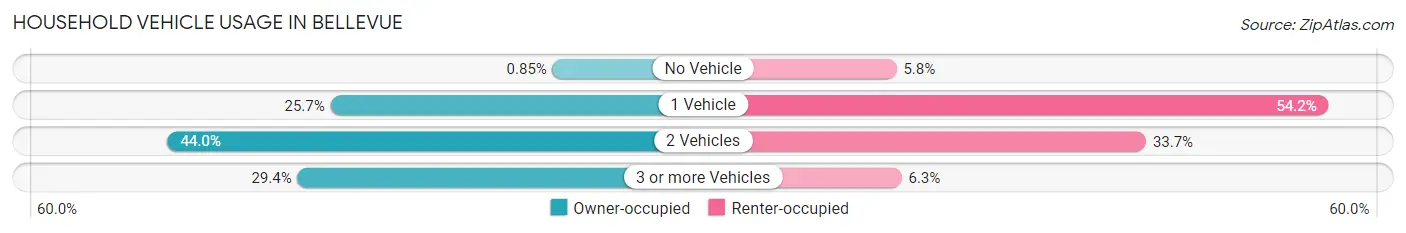
| Vehicles per Household | Owner-occupied | Renter-occupied |
| No Vehicle | 37 (0.9%) | 141 (5.8%) |
| 1 Vehicle | 1,121 (25.7%) | 1,324 (54.2%) |
| 2 Vehicles | 1,916 (44.0%) | 824 (33.7%) |
| 3 or more Vehicles | 1,282 (29.4%) | 155 (6.3%) |
| Total | 4,356 (100.0%) | 2,444 (100.0%) |
Real Estate & Mortgages in Bellevue
Real Estate and Mortgage Overview in Bellevue
| Characteristic | Without Mortgage | With Mortgage |
| Housing Units | 1,571 | 2,785 |
| Median Property Value | $236,400 | $261,300 |
| Median Household Income | $63,792 | $738 |
| Monthly Housing Costs | $584 | $76 |
| Real Estate Taxes | $3,365 | $60 |
Property Value by Mortgage Status in Bellevue
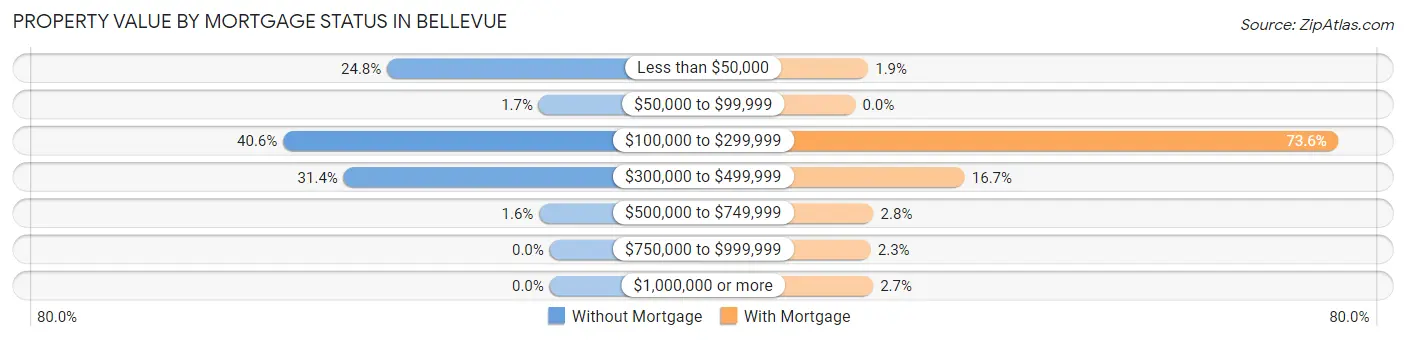
| Property Value | Without Mortgage | With Mortgage |
| Less than $50,000 | 389 (24.8%) | 54 (1.9%) |
| $50,000 to $99,999 | 26 (1.7%) | 0 (0.0%) |
| $100,000 to $299,999 | 638 (40.6%) | 2,050 (73.6%) |
| $300,000 to $499,999 | 493 (31.4%) | 464 (16.7%) |
| $500,000 to $749,999 | 25 (1.6%) | 77 (2.8%) |
| $750,000 to $999,999 | 0 (0.0%) | 65 (2.3%) |
| $1,000,000 or more | 0 (0.0%) | 75 (2.7%) |
| Total | 1,571 (100.0%) | 2,785 (100.0%) |
Household Income by Mortgage Status in Bellevue
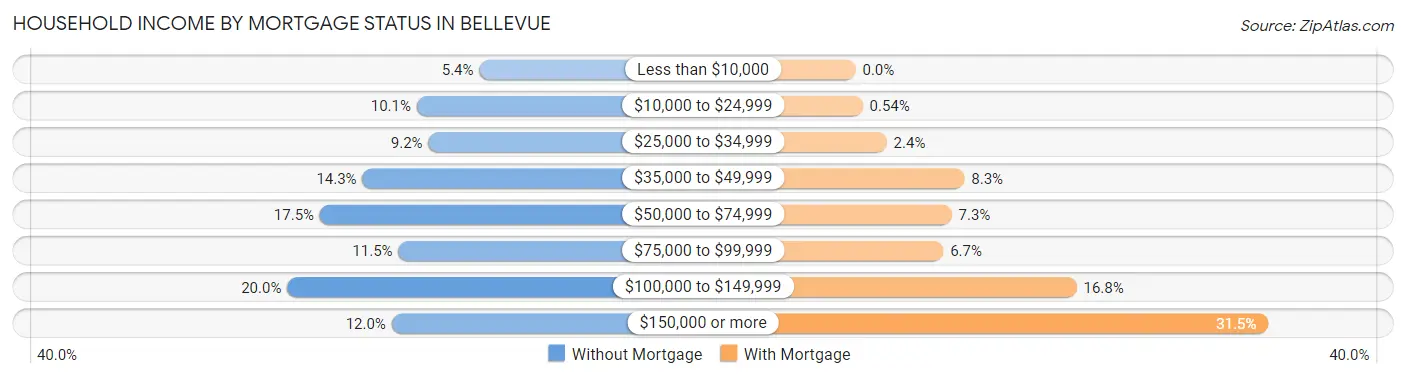
| Household Income | Without Mortgage | With Mortgage |
| Less than $10,000 | 84 (5.3%) | 0 (0.0%) |
| $10,000 to $24,999 | 159 (10.1%) | 15 (0.5%) |
| $25,000 to $34,999 | 145 (9.2%) | 66 (2.4%) |
| $35,000 to $49,999 | 224 (14.3%) | 231 (8.3%) |
| $50,000 to $74,999 | 275 (17.5%) | 204 (7.3%) |
| $75,000 to $99,999 | 181 (11.5%) | 186 (6.7%) |
| $100,000 to $149,999 | 314 (20.0%) | 469 (16.8%) |
| $150,000 or more | 189 (12.0%) | 876 (31.5%) |
| Total | 1,571 (100.0%) | 2,785 (100.0%) |
Property Value to Household Income Ratio in Bellevue
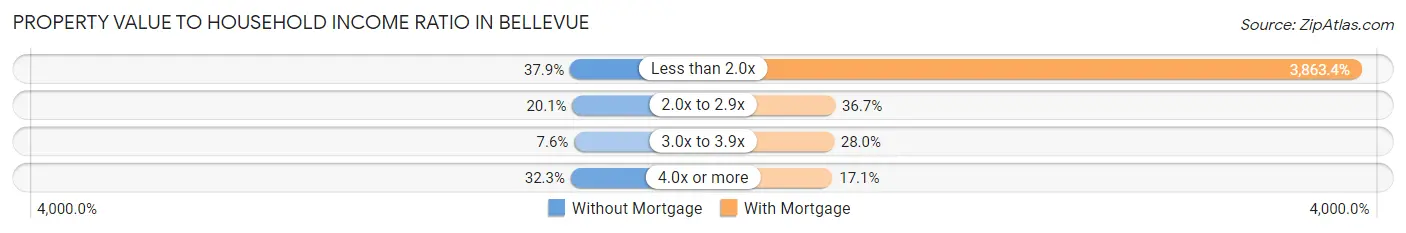
| Value-to-Income Ratio | Without Mortgage | With Mortgage |
| Less than 2.0x | 595 (37.9%) | 107,595 (3,863.4%) |
| 2.0x to 2.9x | 315 (20.1%) | 1,022 (36.7%) |
| 3.0x to 3.9x | 119 (7.6%) | 779 (28.0%) |
| 4.0x or more | 508 (32.3%) | 476 (17.1%) |
| Total | 1,571 (100.0%) | 2,785 (100.0%) |
Real Estate Taxes by Mortgage Status in Bellevue
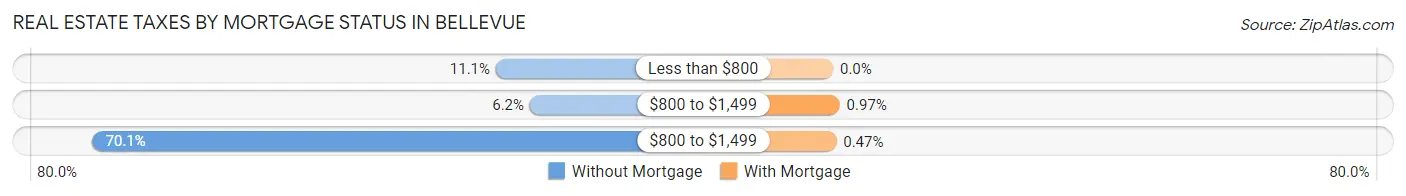
| Property Taxes | Without Mortgage | With Mortgage |
| Less than $800 | 175 (11.1%) | 0 (0.0%) |
| $800 to $1,499 | 97 (6.2%) | 27 (1.0%) |
| $800 to $1,499 | 1,101 (70.1%) | 13 (0.5%) |
| Total | 1,571 (100.0%) | 2,785 (100.0%) |
Health & Disability in Bellevue
Health Insurance Coverage by Age in Bellevue
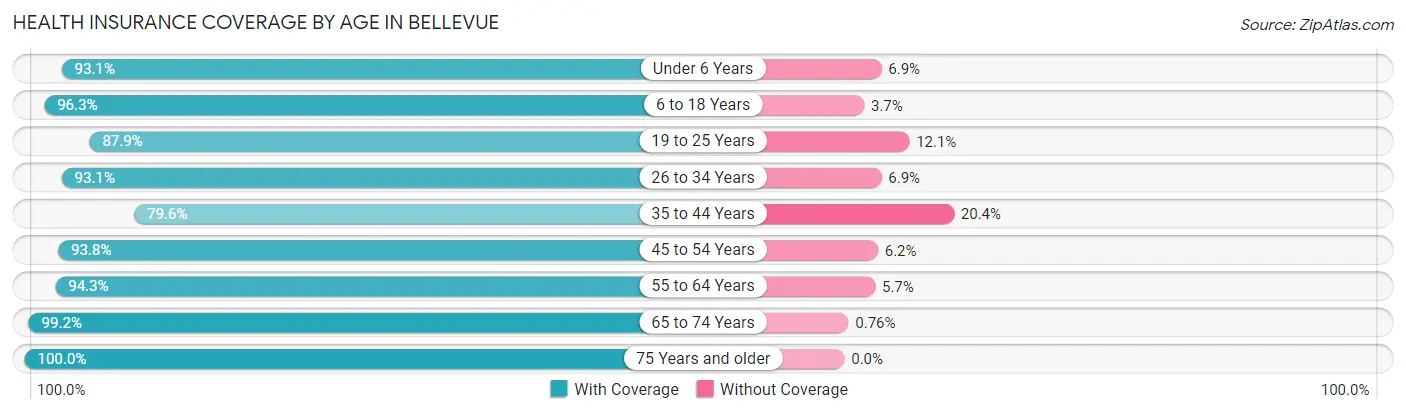
| Age Bracket | With Coverage | Without Coverage |
| Under 6 Years | 566 (93.1%) | 42 (6.9%) |
| 6 to 18 Years | 3,101 (96.3%) | 118 (3.7%) |
| 19 to 25 Years | 1,104 (87.9%) | 152 (12.1%) |
| 26 to 34 Years | 1,777 (93.1%) | 132 (6.9%) |
| 35 to 44 Years | 1,636 (79.6%) | 420 (20.4%) |
| 45 to 54 Years | 1,863 (93.8%) | 124 (6.2%) |
| 55 to 64 Years | 2,219 (94.3%) | 135 (5.7%) |
| 65 to 74 Years | 1,700 (99.2%) | 13 (0.8%) |
| 75 Years and older | 984 (100.0%) | 0 (0.0%) |
| Total | 14,950 (92.9%) | 1,136 (7.1%) |
Health Insurance Coverage by Citizenship Status in Bellevue
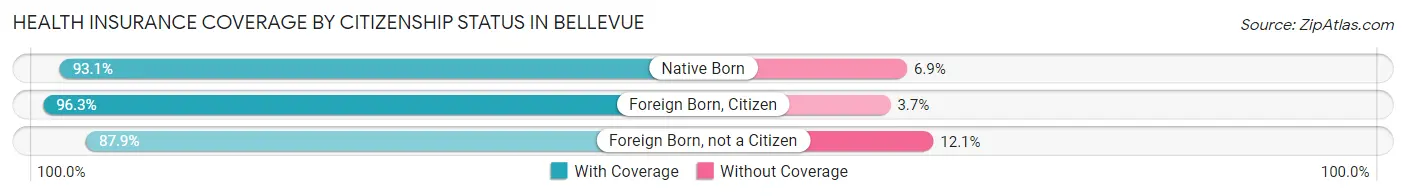
| Citizenship Status | With Coverage | Without Coverage |
| Native Born | 566 (93.1%) | 42 (6.9%) |
| Foreign Born, Citizen | 3,101 (96.3%) | 118 (3.7%) |
| Foreign Born, not a Citizen | 1,104 (87.9%) | 152 (12.1%) |
Health Insurance Coverage by Household Income in Bellevue
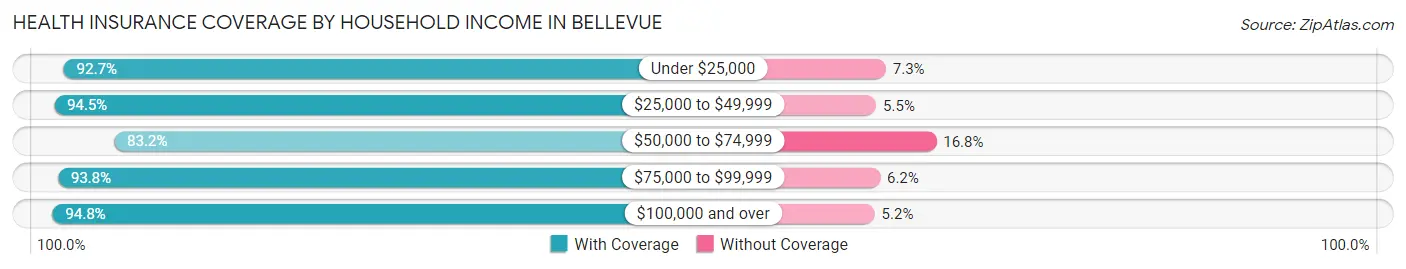
| Household Income | With Coverage | Without Coverage |
| Under $25,000 | 873 (92.7%) | 69 (7.3%) |
| $25,000 to $49,999 | 2,646 (94.5%) | 154 (5.5%) |
| $50,000 to $74,999 | 1,717 (83.2%) | 346 (16.8%) |
| $75,000 to $99,999 | 3,012 (93.8%) | 200 (6.2%) |
| $100,000 and over | 6,664 (94.8%) | 367 (5.2%) |
Public vs Private Health Insurance Coverage by Age in Bellevue
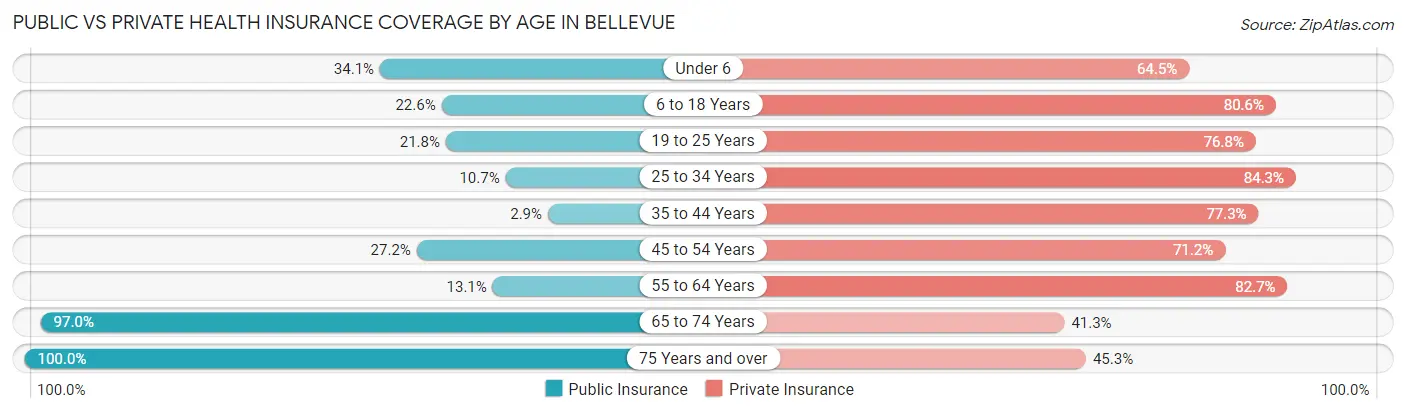
| Age Bracket | Public Insurance | Private Insurance |
| Under 6 | 207 (34.1%) | 392 (64.5%) |
| 6 to 18 Years | 728 (22.6%) | 2,593 (80.5%) |
| 19 to 25 Years | 274 (21.8%) | 965 (76.8%) |
| 25 to 34 Years | 205 (10.7%) | 1,609 (84.3%) |
| 35 to 44 Years | 59 (2.9%) | 1,590 (77.3%) |
| 45 to 54 Years | 541 (27.2%) | 1,414 (71.2%) |
| 55 to 64 Years | 309 (13.1%) | 1,947 (82.7%) |
| 65 to 74 Years | 1,662 (97.0%) | 708 (41.3%) |
| 75 Years and over | 984 (100.0%) | 446 (45.3%) |
| Total | 4,969 (30.9%) | 11,664 (72.5%) |
Disability Status by Sex by Age in Bellevue
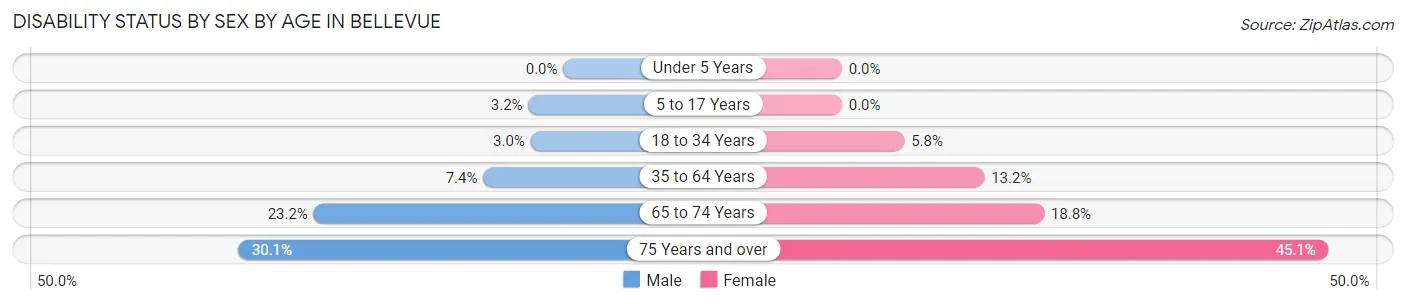
| Age Bracket | Male | Female |
| Under 5 Years | 0 (0.0%) | 0 (0.0%) |
| 5 to 17 Years | 49 (3.2%) | 0 (0.0%) |
| 18 to 34 Years | 51 (3.0%) | 91 (5.8%) |
| 35 to 64 Years | 232 (7.4%) | 433 (13.2%) |
| 65 to 74 Years | 203 (23.2%) | 157 (18.8%) |
| 75 Years and over | 140 (30.1%) | 234 (45.1%) |
Disability Class by Sex by Age in Bellevue
Disability Class: Hearing Difficulty
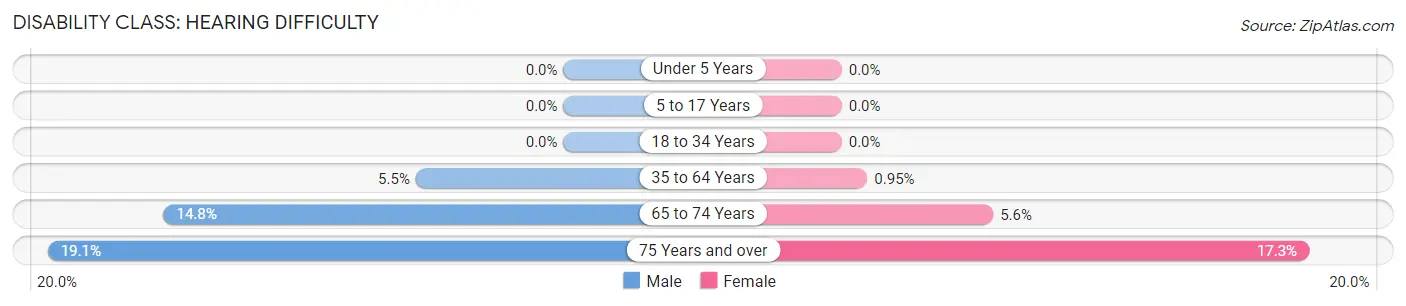
| Age Bracket | Male | Female |
| Under 5 Years | 0 (0.0%) | 0 (0.0%) |
| 5 to 17 Years | 0 (0.0%) | 0 (0.0%) |
| 18 to 34 Years | 0 (0.0%) | 0 (0.0%) |
| 35 to 64 Years | 171 (5.5%) | 31 (0.9%) |
| 65 to 74 Years | 130 (14.8%) | 47 (5.6%) |
| 75 Years and over | 89 (19.1%) | 90 (17.3%) |
Disability Class: Vision Difficulty
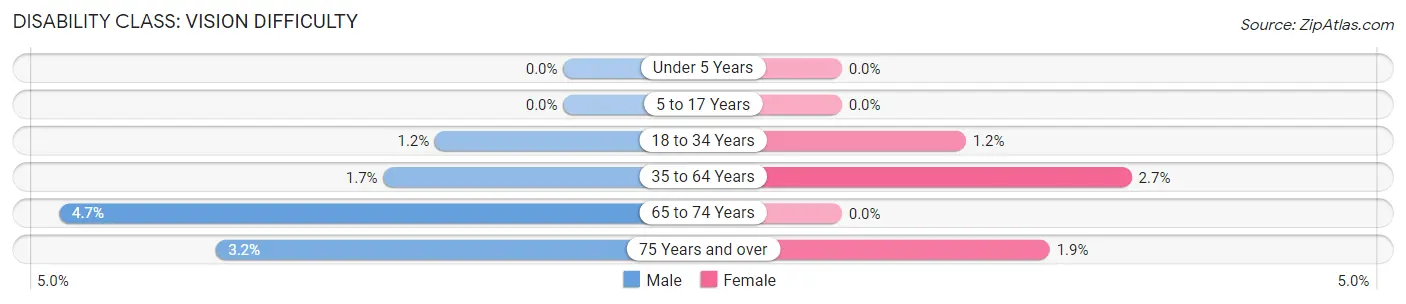
| Age Bracket | Male | Female |
| Under 5 Years | 0 (0.0%) | 0 (0.0%) |
| 5 to 17 Years | 0 (0.0%) | 0 (0.0%) |
| 18 to 34 Years | 20 (1.2%) | 18 (1.1%) |
| 35 to 64 Years | 52 (1.7%) | 88 (2.7%) |
| 65 to 74 Years | 41 (4.7%) | 0 (0.0%) |
| 75 Years and over | 15 (3.2%) | 10 (1.9%) |
Disability Class: Cognitive Difficulty
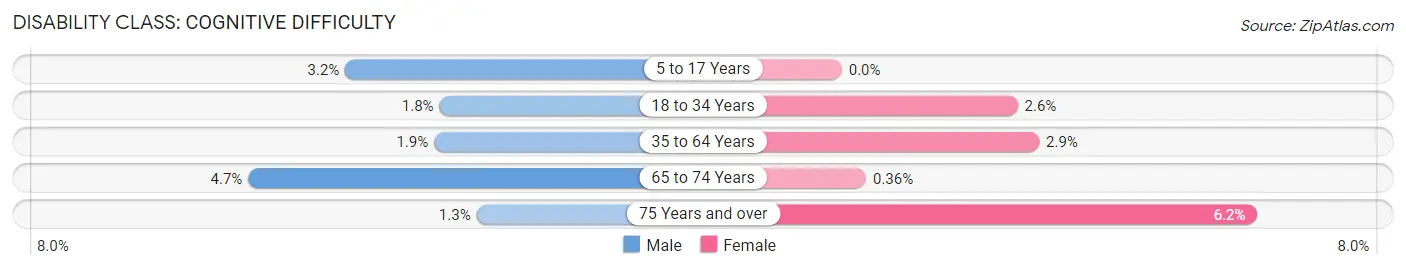
| Age Bracket | Male | Female |
| 5 to 17 Years | 49 (3.2%) | 0 (0.0%) |
| 18 to 34 Years | 31 (1.8%) | 41 (2.6%) |
| 35 to 64 Years | 60 (1.9%) | 96 (2.9%) |
| 65 to 74 Years | 41 (4.7%) | 3 (0.4%) |
| 75 Years and over | 6 (1.3%) | 32 (6.2%) |
Disability Class: Ambulatory Difficulty
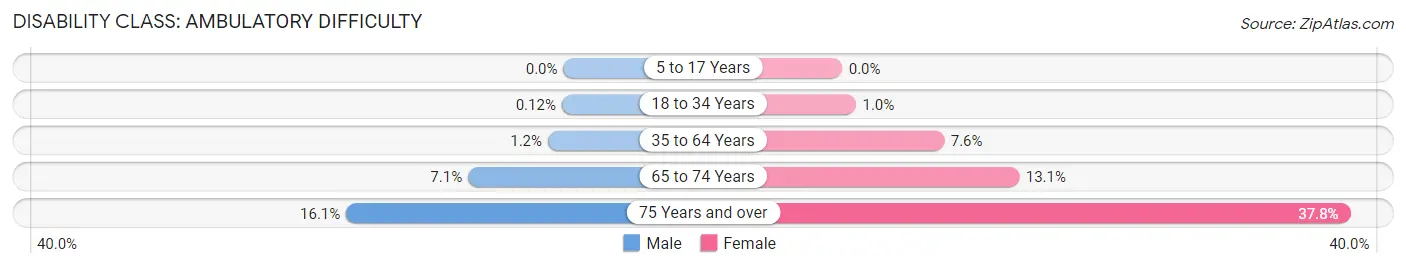
| Age Bracket | Male | Female |
| 5 to 17 Years | 0 (0.0%) | 0 (0.0%) |
| 18 to 34 Years | 2 (0.1%) | 16 (1.0%) |
| 35 to 64 Years | 36 (1.1%) | 248 (7.6%) |
| 65 to 74 Years | 62 (7.1%) | 110 (13.1%) |
| 75 Years and over | 75 (16.1%) | 196 (37.8%) |
Disability Class: Self-Care Difficulty
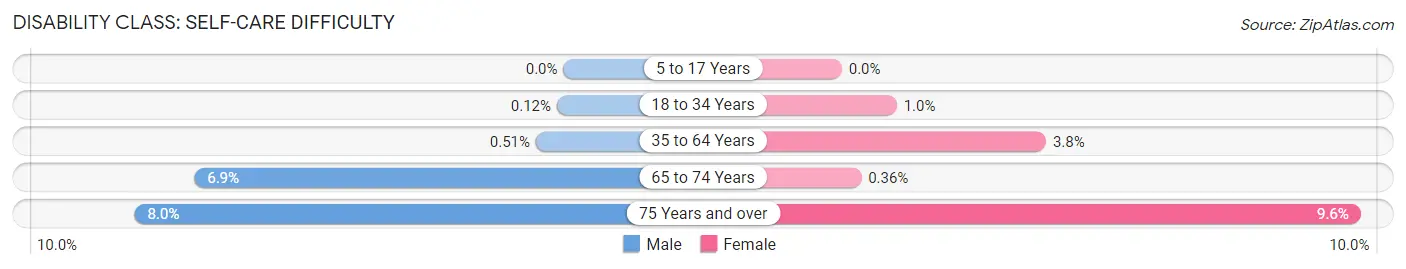
| Age Bracket | Male | Female |
| 5 to 17 Years | 0 (0.0%) | 0 (0.0%) |
| 18 to 34 Years | 2 (0.1%) | 16 (1.0%) |
| 35 to 64 Years | 16 (0.5%) | 124 (3.8%) |
| 65 to 74 Years | 60 (6.9%) | 3 (0.4%) |
| 75 Years and over | 37 (8.0%) | 50 (9.6%) |
Technology Access in Bellevue
Computing Device Access in Bellevue
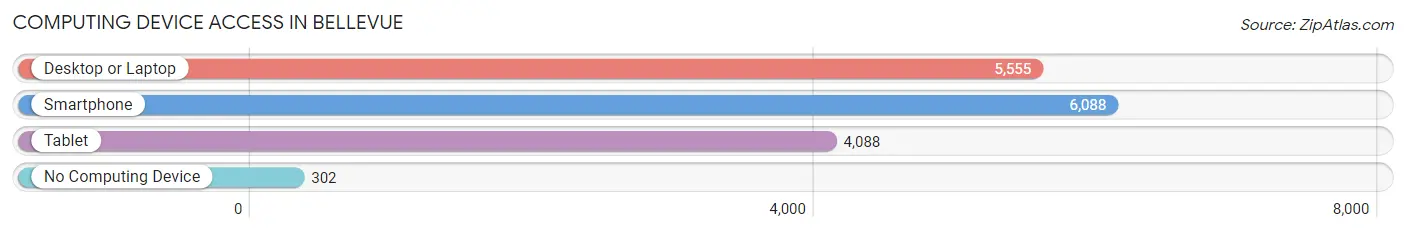
| Device Type | # Households | % Households |
| Desktop or Laptop | 5,555 | 81.7% |
| Smartphone | 6,088 | 89.5% |
| Tablet | 4,088 | 60.1% |
| No Computing Device | 302 | 4.4% |
| Total | 6,800 | 100.0% |
Internet Access in Bellevue
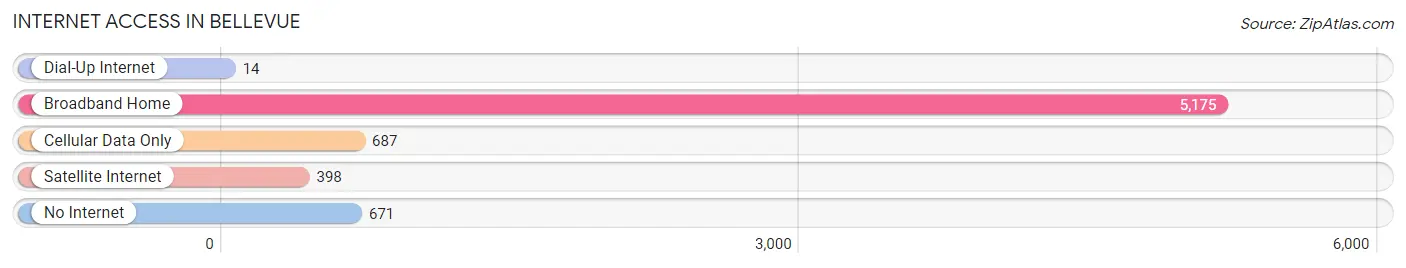
| Internet Type | # Households | % Households |
| Dial-Up Internet | 14 | 0.2% |
| Broadband Home | 5,175 | 76.1% |
| Cellular Data Only | 687 | 10.1% |
| Satellite Internet | 398 | 5.9% |
| No Internet | 671 | 9.9% |
| Total | 6,800 | 100.0% |
Bellevue Summary
Bellevue, Wisconsin is a small village located in Brown County, Wisconsin. It is situated on the banks of the Fox River, just south of Green Bay. The village has a population of approximately 1,500 people and is part of the Green Bay Metropolitan Statistical Area.
History
Bellevue was first settled in 1835 by a group of French-Canadian immigrants. The village was originally known as “La Belle Vue”, which translates to “beautiful view” in French. The village was officially incorporated in 1856.
In the late 19th century, Bellevue was a thriving industrial center. The village was home to several factories, including a paper mill, a sawmill, a grist mill, and a tannery. The village also had a large lumber industry, which provided jobs for many of the residents.
In the early 20th century, Bellevue experienced a period of decline. The factories closed and the population decreased. However, in the late 20th century, the village experienced a resurgence. The village was revitalized with the construction of a new shopping center and the opening of several new businesses.
Geography
Bellevue is located in Brown County, Wisconsin. The village is situated on the banks of the Fox River, just south of Green Bay. The village is surrounded by rolling hills and is located in a rural area.
The climate in Bellevue is typical of the Midwest. Summers are warm and humid, while winters are cold and snowy. The average annual temperature is around 50 degrees Fahrenheit.
Economy
The economy of Bellevue is largely based on tourism and retail. The village is home to several small businesses, including restaurants, shops, and galleries. The village also has a small industrial park, which is home to several manufacturing companies.
The village is also home to several large employers, including the Green Bay Packers and the University of Wisconsin-Green Bay. The village is also home to several medical facilities, including a hospital and several clinics.
Demographics
As of the 2010 census, the population of Bellevue was 1,521. The racial makeup of the village was 94.3% White, 0.7% African American, 0.3% Native American, 0.7% Asian, 0.1% Pacific Islander, and 3.0% from other races. Hispanic or Latino of any race were 2.2% of the population.
The median household income in Bellevue was $45,938, and the median family income was $54,844. The per capita income was $21,945. About 8.2% of families and 10.3% of the population were below the poverty line, including 14.2% of those under age 18 and 5.2% of those age 65 or over.
Bellevue is a small village with a rich history and a vibrant economy. The village is home to several businesses and employers, and is a popular tourist destination. The village has a diverse population and is a great place to live and work.
Common Questions
What is Per Capita Income in Bellevue?
Per Capita income in Bellevue is $41,473.
What is the Median Family Income in Bellevue?
Median Family Income in Bellevue is $92,379.
What is the Median Household income in Bellevue?
Median Household Income in Bellevue is $76,152.
What is Income or Wage Gap in Bellevue?
Income or Wage Gap in Bellevue is 26.2%.
Women in Bellevue earn 73.8 cents for every dollar earned by a man.
What is Inequality or Gini Index in Bellevue?
Inequality or Gini Index in Bellevue is 0.43.
What is the Total Population of Bellevue?
Total Population of Bellevue is 16,086.
What is the Total Male Population of Bellevue?
Total Male Population of Bellevue is 7,995.
What is the Total Female Population of Bellevue?
Total Female Population of Bellevue is 8,091.
What is the Ratio of Males per 100 Females in Bellevue?
There are 98.81 Males per 100 Females in Bellevue.
What is the Ratio of Females per 100 Males in Bellevue?
There are 101.20 Females per 100 Males in Bellevue.
What is the Median Population Age in Bellevue?
Median Population Age in Bellevue is 40.7 Years.
What is the Average Family Size in Bellevue
Average Family Size in Bellevue is 3.0 People.
What is the Average Household Size in Bellevue
Average Household Size in Bellevue is 2.4 People.
How Large is the Labor Force in Bellevue?
There are 9,017 People in the Labor Forcein in Bellevue.
What is the Percentage of People in the Labor Force in Bellevue?
69.2% of People are in the Labor Force in Bellevue.
What is the Unemployment Rate in Bellevue?
Unemployment Rate in Bellevue is 3.1%.