Haitian vs Immigrants from Jordan 3 or more Vehicles in Household
COMPARE
Haitian
Immigrants from Jordan
3 or more Vehicles in Household
3 or more Vehicles in Household Comparison
Haitians
Immigrants from Jordan
15.5%
3 OR MORE VEHICLES IN HOUSEHOLD
0.0/ 100
METRIC RATING
315th/ 347
METRIC RANK
19.9%
3 OR MORE VEHICLES IN HOUSEHOLD
75.0/ 100
METRIC RATING
154th/ 347
METRIC RANK
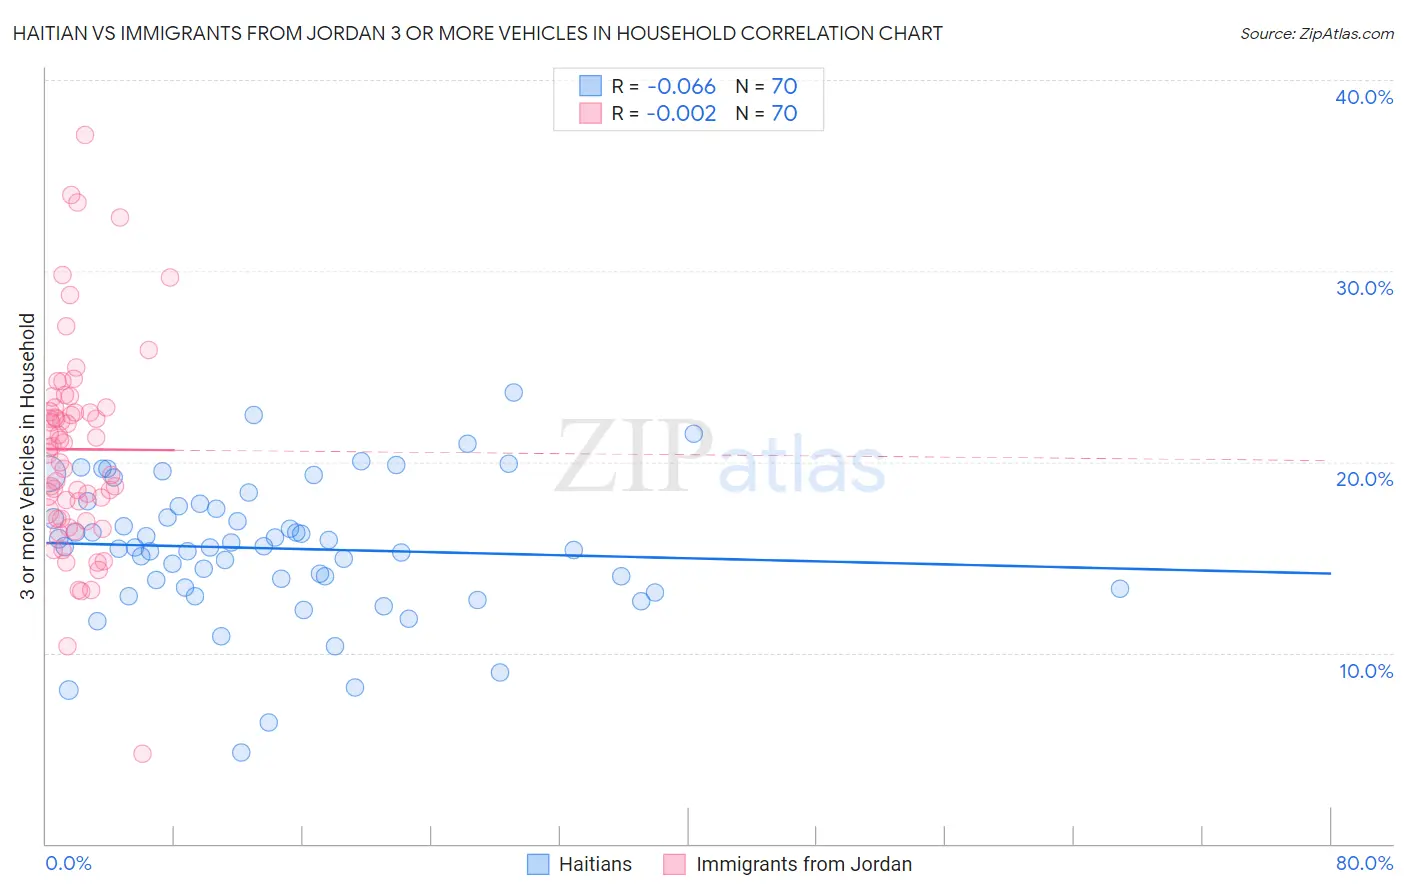
Haitian vs Immigrants from Jordan 3 or more Vehicles in Household Correlation Chart
The statistical analysis conducted on geographies consisting of 287,611,480 people shows a slight negative correlation between the proportion of Haitians and percentage of households with 3 or more vehicles available in the United States with a correlation coefficient (R) of -0.066 and weighted average of 15.5%. Similarly, the statistical analysis conducted on geographies consisting of 181,207,315 people shows no correlation between the proportion of Immigrants from Jordan and percentage of households with 3 or more vehicles available in the United States with a correlation coefficient (R) of -0.002 and weighted average of 19.9%, a difference of 28.6%.
3 or more Vehicles in Household Correlation Summary
| Measurement | Haitian | Immigrants from Jordan |
| Minimum | 4.8% | 4.7% |
| Maximum | 23.6% | 37.1% |
| Range | 18.8% | 32.4% |
| Mean | 15.5% | 20.7% |
| Median | 15.6% | 20.8% |
| Interquartile 25% (IQ1) | 13.4% | 17.0% |
| Interquartile 75% (IQ3) | 17.7% | 22.8% |
| Interquartile Range (IQR) | 4.2% | 5.8% |
| Standard Deviation (Sample) | 3.6% | 5.5% |
| Standard Deviation (Population) | 3.6% | 5.5% |
Similar Demographics by 3 or more Vehicles in Household
Demographics Similar to Haitians by 3 or more Vehicles in Household
In terms of 3 or more vehicles in household, the demographic groups most similar to Haitians are Immigrants from Belarus (15.5%, a difference of 0.32%), U.S. Virgin Islander (15.4%, a difference of 0.52%), Immigrants from Israel (15.6%, a difference of 0.96%), Puerto Rican (15.6%, a difference of 0.98%), and Jamaican (15.2%, a difference of 1.7%).
| Demographics | Rating | Rank | 3 or more Vehicles in Household |
| Houma | 0.0 /100 | #308 | Tragic 16.1% |
| Immigrants | Somalia | 0.0 /100 | #309 | Tragic 15.9% |
| Moroccans | 0.0 /100 | #310 | Tragic 15.9% |
| Albanians | 0.0 /100 | #311 | Tragic 15.8% |
| Puerto Ricans | 0.0 /100 | #312 | Tragic 15.6% |
| Immigrants | Israel | 0.0 /100 | #313 | Tragic 15.6% |
| Immigrants | Belarus | 0.0 /100 | #314 | Tragic 15.5% |
| Haitians | 0.0 /100 | #315 | Tragic 15.5% |
| U.S. Virgin Islanders | 0.0 /100 | #316 | Tragic 15.4% |
| Jamaicans | 0.0 /100 | #317 | Tragic 15.2% |
| Immigrants | Haiti | 0.0 /100 | #318 | Tragic 15.2% |
| Cape Verdeans | 0.0 /100 | #319 | Tragic 15.0% |
| Yup'ik | 0.0 /100 | #320 | Tragic 14.8% |
| Immigrants | Jamaica | 0.0 /100 | #321 | Tragic 14.7% |
| Immigrants | West Indies | 0.0 /100 | #322 | Tragic 14.6% |
Demographics Similar to Immigrants from Jordan by 3 or more Vehicles in Household
In terms of 3 or more vehicles in household, the demographic groups most similar to Immigrants from Jordan are Yuman (19.9%, a difference of 0.060%), Tlingit-Haida (19.9%, a difference of 0.15%), Thai (19.8%, a difference of 0.37%), Hungarian (19.8%, a difference of 0.42%), and Lebanese (20.0%, a difference of 0.51%).
| Demographics | Rating | Rank | 3 or more Vehicles in Household |
| Slovaks | 83.0 /100 | #147 | Excellent 20.1% |
| Guatemalans | 82.6 /100 | #148 | Excellent 20.1% |
| Immigrants | Iran | 80.9 /100 | #149 | Excellent 20.0% |
| Immigrants | Immigrants | 80.8 /100 | #150 | Excellent 20.0% |
| Taiwanese | 80.6 /100 | #151 | Excellent 20.0% |
| Lebanese | 79.8 /100 | #152 | Good 20.0% |
| Yuman | 75.6 /100 | #153 | Good 19.9% |
| Immigrants | Jordan | 75.0 /100 | #154 | Good 19.9% |
| Tlingit-Haida | 73.4 /100 | #155 | Good 19.9% |
| Thais | 71.1 /100 | #156 | Good 19.8% |
| Hungarians | 70.5 /100 | #157 | Good 19.8% |
| Armenians | 68.8 /100 | #158 | Good 19.8% |
| Immigrants | Pakistan | 68.2 /100 | #159 | Good 19.8% |
| Immigrants | Lebanon | 67.6 /100 | #160 | Good 19.8% |
| Immigrants | Guatemala | 65.6 /100 | #161 | Good 19.7% |