Alsatian vs Immigrants from Jordan 10th Grade

COMPARE

Alsatian
Race
Ancestry
AfghanAfricanAlaska NativeAlaskan AthabascanAlbanianAleutAlsatianAmericanApacheArabArapahoArgentineanArmenianAssyrian/Chaldean/SyriacAustralianAustrianBahamianBangladeshiBarbadianBasqueBelgianBelizeanBermudanBhutaneseBlackfeetBolivianBrazilianBritishBritish West IndianBulgarianBurmeseCajunCambodianCanadianCape VerdeanCarpatho RusynCelticCentral AmericanCentral American IndianCherokeeCheyenneChickasawChileanChineseChippewaChoctawColombianColvilleComancheCosta RicanCreeCreekCroatianCrowCubanCypriotCzechCzechoslovakianDanishDelawareDominicanDutchDutch West IndianEastern EuropeanEcuadorianEgyptianEnglishEstonianEthiopianEuropeanFijianFilipinoFinnishFrenchFrench American IndianFrench CanadianGermanGerman RussianGhanaianGreekGuamanian/ChamorroGuatemalanGuyaneseHaitianHmongHonduranHopiHoumaHungarianIcelanderIndian (Asian)IndonesianInupiatIranianIraqiIrishIroquoisIsraeliItalianJamaicanJapaneseJordanianKenyanKiowaKoreanLaotianLatvianLebaneseLiberianLithuanianLumbeeLuxembourgerMacedonianMalaysianMalteseMarshalleseMenomineeMexicanMexican American IndianMongolianMoroccanNative HawaiianNavajoNepaleseNew ZealanderNicaraguanNigerianNorthern EuropeanNorwegianOkinawanOsageOttawaPaiutePakistaniPalestinianPanamanianParaguayanPennsylvania GermanPeruvianPimaPolishPortuguesePotawatomiPuebloPuerto RicanPuget Sound SalishRomanianRussianSalvadoranSamoanScandinavianScotch-IrishScottishSeminoleSenegaleseSerbianShoshoneSierra LeoneanSiouxSlavicSlovakSloveneSomaliSouth AfricanSouth AmericanSouth American IndianSoviet UnionSpaniardSpanishSpanish AmericanSpanish American IndianSri LankanSubsaharan AfricanSudaneseSwedishSwissSyrianTaiwaneseThaiTlingit-HaidaTohono O'OdhamTonganTrinidadian and TobagonianTsimshianTurkishU.S. Virgin IslanderUgandanUkrainianUruguayanUteVenezuelanVietnameseWelshWest IndianYakamaYaquiYugoslavianYumanYup'ikZimbabwean
Immigration
NonimmigrantsImmigrantsAfghanistanAfricaAlbaniaArgentinaArmeniaAsiaAustraliaAustriaBahamasBangladeshBarbadosBelarusBelgiumBelizeBoliviaBosnia and HerzegovinaBrazilBulgariaBurma/MyanmarCabo VerdeCambodiaCameroonCanadaCaribbeanCentral AmericaChileChinaColombiaCongoCosta RicaCroatiaCubaCzechoslovakiaDenmarkDominicaDominican RepublicEastern AfricaEastern AsiaEastern EuropeEcuadorEgyptEl SalvadorEnglandEritreaEthiopiaEuropeFijiFranceGermanyGhanaGreeceGrenadaGuatemalaGuyanaHaitiHondurasHong KongHungaryIndiaIndonesiaIranIraqIrelandIsraelItalyJamaicaJapanKazakhstanKenyaKoreaKuwaitLaosLatin AmericaLatviaLebanonLiberiaLithuaniaMalaysiaMexicoMicronesiaMiddle AfricaMoldovaMoroccoNepalNetherlandsNicaraguaNigeriaNorth AmericaNorth MacedoniaNorthern AfricaNorthern EuropeNorwayOceaniaPakistanPanamaPeruPhilippinesPolandPortugalRomaniaRussiaSaudi ArabiaScotlandSenegalSerbiaSierra LeoneSingaporeSomaliaSouth AfricaSouth AmericaSouth Central AsiaSouth Eastern AsiaSouthern EuropeSpainSri LankaSt. Vincent and the GrenadinesSudanSwedenSwitzerlandSyriaTaiwanThailandTrinidad and TobagoTurkeyUgandaUkraineUruguayUzbekistanVenezuelaVietnamWest IndiesWestern AfricaWestern AsiaWestern EuropeYemenZaireZimbabweAzores
Immigrants from Jordan
Race
Ancestry
AfghanAfricanAlaska NativeAlaskan AthabascanAlbanianAleutAmericanApacheArabArapahoArgentineanArmenianAssyrian/Chaldean/SyriacAustralianAustrianBahamianBangladeshiBarbadianBasqueBelgianBelizeanBermudanBhutaneseBlackfeetBolivianBrazilianBritishBritish West IndianBulgarianBurmeseCajunCambodianCanadianCape VerdeanCarpatho RusynCelticCentral AmericanCentral American IndianCherokeeCheyenneChickasawChileanChineseChippewaChoctawColombianColvilleComancheCosta RicanCreeCreekCroatianCrowCubanCypriotCzechCzechoslovakianDanishDelawareDominicanDutchDutch West IndianEastern EuropeanEcuadorianEgyptianEnglishEstonianEthiopianEuropeanFijianFilipinoFinnishFrenchFrench American IndianFrench CanadianGermanGerman RussianGhanaianGreekGuamanian/ChamorroGuatemalanGuyaneseHaitianHmongHonduranHopiHoumaHungarianIcelanderIndian (Asian)IndonesianInupiatIranianIraqiIrishIroquoisIsraeliItalianJamaicanJapaneseJordanianKenyanKiowaKoreanLaotianLatvianLebaneseLiberianLithuanianLumbeeLuxembourgerMacedonianMalaysianMalteseMarshalleseMenomineeMexicanMexican American IndianMongolianMoroccanNative HawaiianNavajoNepaleseNew ZealanderNicaraguanNigerianNorthern EuropeanNorwegianOkinawanOsageOttawaPaiutePakistaniPalestinianPanamanianParaguayanPennsylvania GermanPeruvianPimaPolishPortuguesePotawatomiPuebloPuerto RicanPuget Sound SalishRomanianRussianSalvadoranSamoanScandinavianScotch-IrishScottishSeminoleSenegaleseSerbianShoshoneSierra LeoneanSiouxSlavicSlovakSloveneSomaliSouth AfricanSouth AmericanSouth American IndianSoviet UnionSpaniardSpanishSpanish AmericanSpanish American IndianSri LankanSubsaharan AfricanSudaneseSwedishSwissSyrianTaiwaneseThaiTlingit-HaidaTohono O'OdhamTonganTrinidadian and TobagonianTsimshianTurkishU.S. Virgin IslanderUgandanUkrainianUruguayanUteVenezuelanVietnameseWelshWest IndianYakamaYaquiYugoslavianYumanYup'ikZimbabwean
Immigration
NonimmigrantsImmigrantsAfghanistanAfricaAlbaniaArgentinaArmeniaAsiaAustraliaAustriaBahamasBangladeshBarbadosBelarusBelgiumBelizeBoliviaBosnia and HerzegovinaBrazilBulgariaBurma/MyanmarCabo VerdeCambodiaCameroonCanadaCaribbeanCentral AmericaChileChinaColombiaCongoCosta RicaCroatiaCubaCzechoslovakiaDenmarkDominicaDominican RepublicEastern AfricaEastern AsiaEastern EuropeEcuadorEgyptEl SalvadorEnglandEritreaEthiopiaEuropeFijiFranceGermanyGhanaGreeceGrenadaGuatemalaGuyanaHaitiHondurasHong KongHungaryIndiaIndonesiaIranIraqIrelandIsraelItalyJamaicaJapanJordanKazakhstanKenyaKoreaKuwaitLaosLatin AmericaLatviaLebanonLiberiaLithuaniaMalaysiaMexicoMicronesiaMiddle AfricaMoldovaMoroccoNepalNetherlandsNicaraguaNigeriaNorth AmericaNorth MacedoniaNorthern AfricaNorthern EuropeNorwayOceaniaPakistanPanamaPeruPhilippinesPolandPortugalRomaniaRussiaSaudi ArabiaScotlandSenegalSerbiaSierra LeoneSingaporeSomaliaSouth AfricaSouth AmericaSouth Central AsiaSouth Eastern AsiaSouthern EuropeSpainSri LankaSt. Vincent and the GrenadinesSudanSwedenSwitzerlandSyriaTaiwanThailandTrinidad and TobagoTurkeyUgandaUkraineUruguayUzbekistanVenezuelaVietnamWest IndiesWestern AfricaWestern AsiaWestern EuropeYemenZaireZimbabweAzores
10th Grade
Income
Poverty
Unemployment
Labor Participation
Family Structure
Vehicle Availability
Education Level
Disability

10th Grade Comparison

Alsatians

Immigrants from Jordan

Average
Excellent
93.8%
10TH GRADE
59.4/ 100
METRIC RATING
168th/ 347
METRIC RANK
94.1%
10TH GRADE
87.6/ 100
METRIC RATING
140th/ 347
METRIC RANK

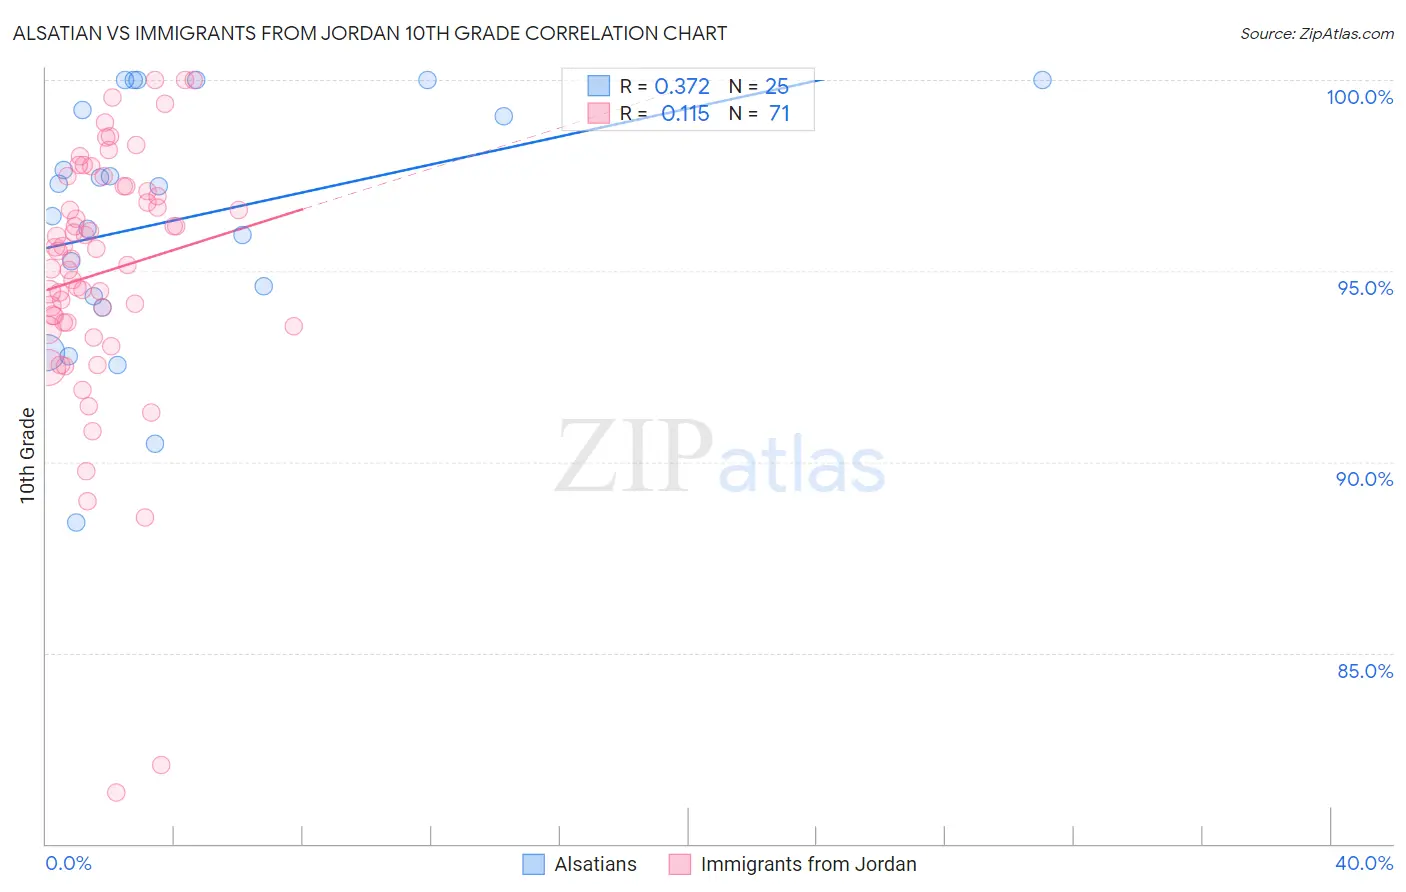
Alsatian vs Immigrants from Jordan 10th Grade Correlation Chart

The statistical analysis conducted on geographies consisting of 82,682,365 people shows a mild positive correlation between the proportion of Alsatians and percentage of population with at least 10th grade education in the United States with a correlation coefficient (R) of 0.372 and weighted average of 93.8%. Similarly, the statistical analysis conducted on geographies consisting of 181,278,272 people shows a poor positive correlation between the proportion of Immigrants from Jordan and percentage of population with at least 10th grade education in the United States with a correlation coefficient (R) of 0.115 and weighted average of 94.1%, a difference of 0.35%.
Alsatian vs Immigrants from Jordan 10th Grade

10th Grade Correlation Summary

MeasurementAlsatianImmigrants from Jordan
Minimum88.4%81.3%
Maximum100.0%100.0%
Range11.6%18.7%
Mean96.4%95.0%
Median97.2%95.5%
Interquartile 25% (IQ1)94.2%93.6%
Interquartile 75% (IQ3)99.6%97.2%
Interquartile Range (IQR)5.4%3.6%
Standard Deviation (Sample)3.2%3.4%
Standard Deviation (Population)3.2%3.4%

Similar Demographics by 10th Grade

Demographics Similar to Alsatians by 10th Grade

In terms of 10th grade, the demographic groups most similar to Alsatians are Immigrants from Iraq (93.8%, a difference of 0.030%), Immigrants from Egypt (93.8%, a difference of 0.030%), Immigrants from Spain (93.8%, a difference of 0.030%), Brazilian (93.8%, a difference of 0.040%), and Immigrants from Venezuela (93.8%, a difference of 0.050%).
DemographicsRating | Rank10th Grade
Assyrians/Chaldeans/Syriacs
69.7
/100
|
#161
Good
93.9%
Immigrants | Poland
69.6
/100
|
#162
Good
93.9%
Venezuelans
69.5
/100
|
#163
Good
93.9%
Iraqis
68.1
/100
|
#164
Good
93.9%
Brazilians
63.6
/100
|
#165
Good
93.8%
Immigrants | Iraq
63.0
/100
|
#166
Good
93.8%
Immigrants | Egypt
62.3
/100
|
#167
Good
93.8%
Alsatians
59.4
/100
|
#168
Average
93.8%
Immigrants | Spain
55.9
/100
|
#169
Average
93.8%
Immigrants | Venezuela
53.9
/100
|
#170
Average
93.8%
Immigrants | Albania
52.4
/100
|
#171
Average
93.8%
French American Indians
50.9
/100
|
#172
Average
93.7%
Spaniards
50.3
/100
|
#173
Average
93.7%
Argentineans
50.0
/100
|
#174
Average
93.7%
Immigrants | Nepal
49.6
/100
|
#175
Average
93.7%

Demographics Similar to Immigrants from Jordan by 10th Grade

In terms of 10th grade, the demographic groups most similar to Immigrants from Jordan are Hmong (94.1%, a difference of 0.020%), Albanian (94.1%, a difference of 0.020%), Immigrants from Bosnia and Herzegovina (94.2%, a difference of 0.040%), Immigrants from Sri Lanka (94.2%, a difference of 0.050%), and Cherokee (94.1%, a difference of 0.050%).
DemographicsRating | Rank10th Grade
Creek
91.9
/100
|
#133
Exceptional
94.2%
Osage
91.7
/100
|
#134
Exceptional
94.2%
Immigrants | Korea
91.3
/100
|
#135
Exceptional
94.2%
Shoshone
90.8
/100
|
#136
Exceptional
94.2%
Arapaho
90.5
/100
|
#137
Exceptional
94.2%
Immigrants | Sri Lanka
89.9
/100
|
#138
Excellent
94.2%
Immigrants | Bosnia and Herzegovina
89.4
/100
|
#139
Excellent
94.2%
Immigrants | Jordan
87.6
/100
|
#140
Excellent
94.1%
Hmong
86.6
/100
|
#141
Excellent
94.1%
Albanians
86.5
/100
|
#142
Excellent
94.1%
Cherokee
84.9
/100
|
#143
Excellent
94.1%
Immigrants | Kazakhstan
84.9
/100
|
#144
Excellent
94.1%
Immigrants | Nonimmigrants
83.8
/100
|
#145
Excellent
94.1%
Chickasaw
82.6
/100
|
#146
Excellent
94.1%
Immigrants | Ukraine
81.5
/100
|
#147
Excellent
94.0%