Alsatian vs Immigrants from Jordan 1st Grade
COMPARE
Alsatian
Immigrants from Jordan
1st Grade
1st Grade Comparison
Alsatians
Immigrants from Jordan
98.0%
1ST GRADE
80.9/ 100
METRIC RATING
144th/ 347
METRIC RANK
97.9%
1ST GRADE
53.9/ 100
METRIC RATING
171st/ 347
METRIC RANK
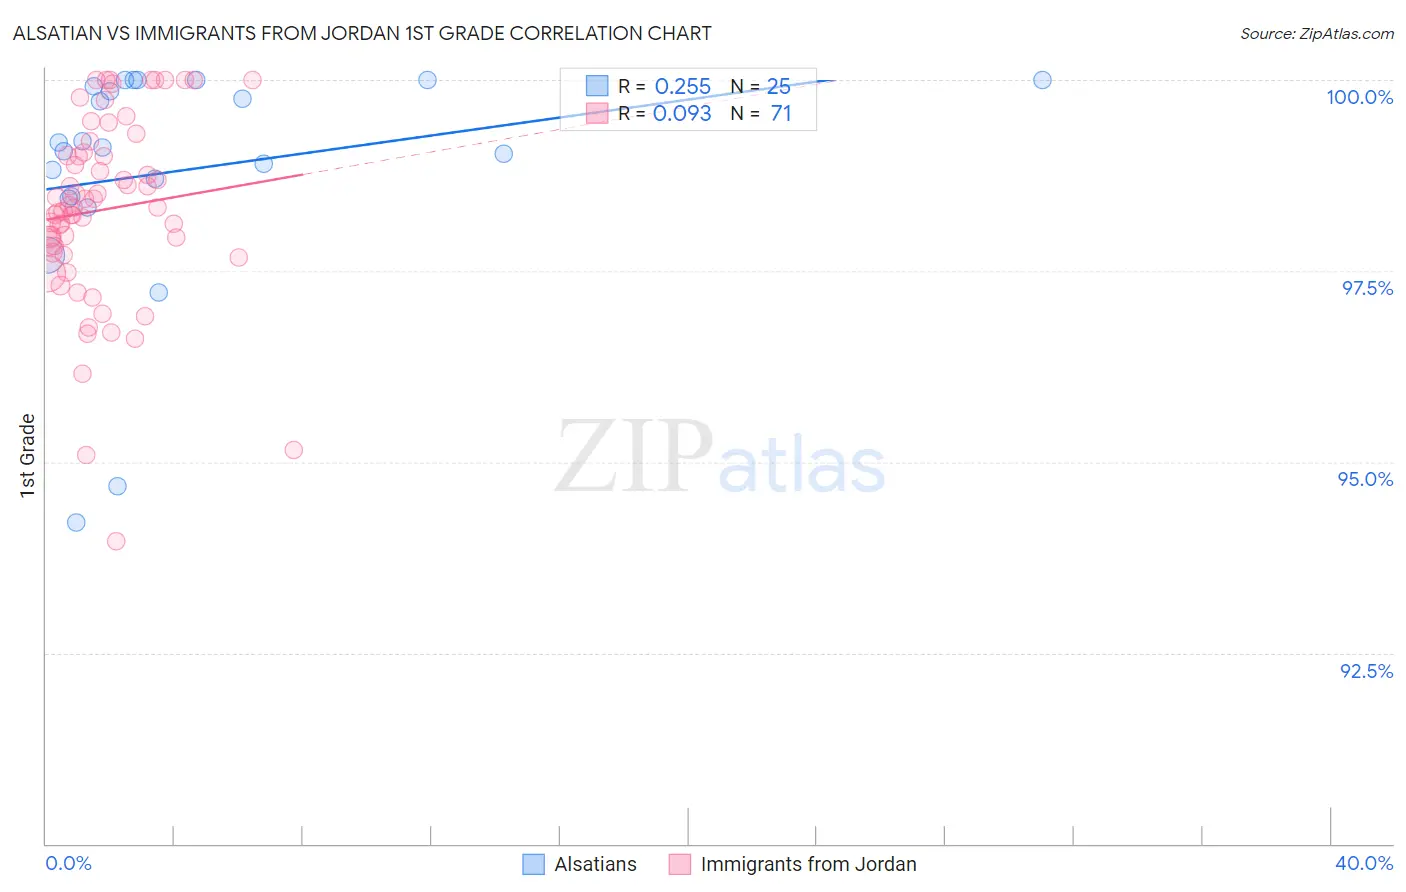
Alsatian vs Immigrants from Jordan 1st Grade Correlation Chart
The statistical analysis conducted on geographies consisting of 82,682,365 people shows a weak positive correlation between the proportion of Alsatians and percentage of population with at least 1st grade education in the United States with a correlation coefficient (R) of 0.255 and weighted average of 98.0%. Similarly, the statistical analysis conducted on geographies consisting of 181,269,915 people shows a slight positive correlation between the proportion of Immigrants from Jordan and percentage of population with at least 1st grade education in the United States with a correlation coefficient (R) of 0.093 and weighted average of 97.9%, a difference of 0.10%.
1st Grade Correlation Summary
| Measurement | Alsatian | Immigrants from Jordan |
| Minimum | 94.2% | 94.0% |
| Maximum | 100.0% | 100.0% |
| Range | 5.8% | 6.0% |
| Mean | 98.8% | 98.3% |
| Median | 99.1% | 98.3% |
| Interquartile 25% (IQ1) | 98.5% | 97.7% |
| Interquartile 75% (IQ3) | 100.0% | 99.1% |
| Interquartile Range (IQR) | 1.5% | 1.3% |
| Standard Deviation (Sample) | 1.5% | 1.2% |
| Standard Deviation (Population) | 1.5% | 1.2% |
Similar Demographics by 1st Grade
Demographics Similar to Alsatians by 1st Grade
In terms of 1st grade, the demographic groups most similar to Alsatians are Burmese (98.0%, a difference of 0.0%), Palestinian (98.0%, a difference of 0.010%), Immigrants from Turkey (98.0%, a difference of 0.010%), Marshallese (98.0%, a difference of 0.010%), and Hmong (98.0%, a difference of 0.010%).
| Demographics | Rating | Rank | 1st Grade |
| Israelis | 87.8 /100 | #137 | Excellent 98.1% |
| Immigrants | Romania | 87.8 /100 | #138 | Excellent 98.1% |
| Blackfeet | 87.6 /100 | #139 | Excellent 98.1% |
| Palestinians | 83.0 /100 | #140 | Excellent 98.0% |
| Immigrants | Turkey | 82.8 /100 | #141 | Excellent 98.0% |
| Marshallese | 82.0 /100 | #142 | Excellent 98.0% |
| Burmese | 81.0 /100 | #143 | Excellent 98.0% |
| Alsatians | 80.9 /100 | #144 | Excellent 98.0% |
| Hmong | 79.0 /100 | #145 | Good 98.0% |
| Immigrants | Israel | 77.8 /100 | #146 | Good 98.0% |
| Filipinos | 77.6 /100 | #147 | Good 98.0% |
| Apache | 75.2 /100 | #148 | Good 98.0% |
| Immigrants | Greece | 74.9 /100 | #149 | Good 98.0% |
| Jordanians | 72.7 /100 | #150 | Good 98.0% |
| Dutch West Indians | 69.8 /100 | #151 | Good 98.0% |
Demographics Similar to Immigrants from Jordan by 1st Grade
In terms of 1st grade, the demographic groups most similar to Immigrants from Jordan are Immigrants from Micronesia (97.9%, a difference of 0.0%), Immigrants from Spain (97.9%, a difference of 0.0%), Immigrants from Korea (97.9%, a difference of 0.0%), Brazilian (97.9%, a difference of 0.010%), and Ugandan (97.9%, a difference of 0.010%).
| Demographics | Rating | Rank | 1st Grade |
| Brazilians | 57.6 /100 | #164 | Average 97.9% |
| Ugandans | 56.9 /100 | #165 | Average 97.9% |
| Navajo | 56.6 /100 | #166 | Average 97.9% |
| Bermudans | 56.3 /100 | #167 | Average 97.9% |
| Chileans | 55.6 /100 | #168 | Average 97.9% |
| Immigrants | Micronesia | 55.3 /100 | #169 | Average 97.9% |
| Immigrants | Spain | 54.9 /100 | #170 | Average 97.9% |
| Immigrants | Jordan | 53.9 /100 | #171 | Average 97.9% |
| Immigrants | Korea | 53.0 /100 | #172 | Average 97.9% |
| Kenyans | 51.2 /100 | #173 | Average 97.9% |
| Natives/Alaskans | 50.0 /100 | #174 | Average 97.9% |
| Immigrants | Sri Lanka | 49.7 /100 | #175 | Average 97.9% |
| Albanians | 49.6 /100 | #176 | Average 97.9% |
| Immigrants | Brazil | 49.1 /100 | #177 | Average 97.9% |
| Immigrants | Venezuela | 47.8 /100 | #178 | Average 97.9% |