Argentinean vs Immigrants from Jordan 3 or more Vehicles in Household
COMPARE
Argentinean
Immigrants from Jordan
3 or more Vehicles in Household
3 or more Vehicles in Household Comparison
Argentineans
Immigrants from Jordan
18.9%
3 OR MORE VEHICLES IN HOUSEHOLD
18.2/ 100
METRIC RATING
200th/ 347
METRIC RANK
19.9%
3 OR MORE VEHICLES IN HOUSEHOLD
75.0/ 100
METRIC RATING
154th/ 347
METRIC RANK
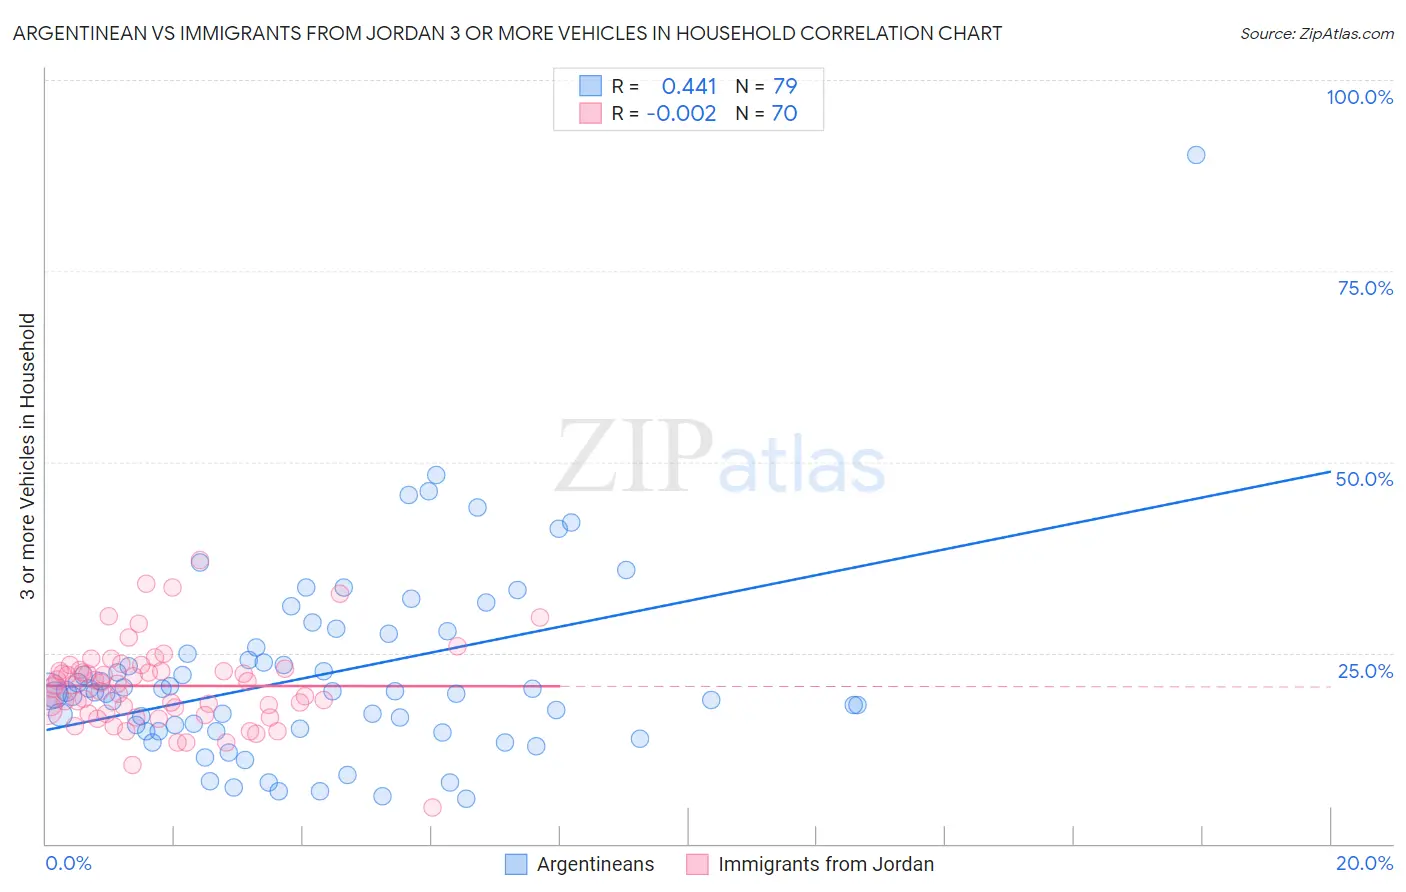
Argentinean vs Immigrants from Jordan 3 or more Vehicles in Household Correlation Chart
The statistical analysis conducted on geographies consisting of 296,926,248 people shows a moderate positive correlation between the proportion of Argentineans and percentage of households with 3 or more vehicles available in the United States with a correlation coefficient (R) of 0.441 and weighted average of 18.9%. Similarly, the statistical analysis conducted on geographies consisting of 181,207,315 people shows no correlation between the proportion of Immigrants from Jordan and percentage of households with 3 or more vehicles available in the United States with a correlation coefficient (R) of -0.002 and weighted average of 19.9%, a difference of 5.1%.
3 or more Vehicles in Household Correlation Summary
| Measurement | Argentinean | Immigrants from Jordan |
| Minimum | 6.0% | 4.7% |
| Maximum | 90.2% | 37.1% |
| Range | 84.2% | 32.4% |
| Mean | 22.1% | 20.7% |
| Median | 19.9% | 20.8% |
| Interquartile 25% (IQ1) | 14.8% | 17.0% |
| Interquartile 75% (IQ3) | 25.6% | 22.8% |
| Interquartile Range (IQR) | 10.8% | 5.8% |
| Standard Deviation (Sample) | 12.5% | 5.5% |
| Standard Deviation (Population) | 12.4% | 5.5% |
Similar Demographics by 3 or more Vehicles in Household
Demographics Similar to Argentineans by 3 or more Vehicles in Household
In terms of 3 or more vehicles in household, the demographic groups most similar to Argentineans are Arab (18.9%, a difference of 0.060%), Immigrants from Norway (19.0%, a difference of 0.10%), Egyptian (19.0%, a difference of 0.17%), Immigrants from Austria (18.9%, a difference of 0.39%), and Immigrants from Japan (19.0%, a difference of 0.46%).
| Demographics | Rating | Rank | 3 or more Vehicles in Household |
| Tsimshian | 24.4 /100 | #193 | Fair 19.1% |
| Serbians | 24.0 /100 | #194 | Fair 19.1% |
| Immigrants | Moldova | 23.6 /100 | #195 | Fair 19.1% |
| Central American Indians | 22.2 /100 | #196 | Fair 19.0% |
| Immigrants | Japan | 22.0 /100 | #197 | Fair 19.0% |
| Egyptians | 19.5 /100 | #198 | Poor 19.0% |
| Immigrants | Norway | 19.0 /100 | #199 | Poor 19.0% |
| Argentineans | 18.2 /100 | #200 | Poor 18.9% |
| Arabs | 17.7 /100 | #201 | Poor 18.9% |
| Immigrants | Austria | 15.4 /100 | #202 | Poor 18.9% |
| Tohono O'odham | 14.8 /100 | #203 | Poor 18.9% |
| Immigrants | Romania | 14.6 /100 | #204 | Poor 18.9% |
| Russians | 14.2 /100 | #205 | Poor 18.8% |
| Immigrants | Eastern Asia | 14.1 /100 | #206 | Poor 18.8% |
| Immigrants | Chile | 13.6 /100 | #207 | Poor 18.8% |
Demographics Similar to Immigrants from Jordan by 3 or more Vehicles in Household
In terms of 3 or more vehicles in household, the demographic groups most similar to Immigrants from Jordan are Yuman (19.9%, a difference of 0.060%), Tlingit-Haida (19.9%, a difference of 0.15%), Thai (19.8%, a difference of 0.37%), Hungarian (19.8%, a difference of 0.42%), and Lebanese (20.0%, a difference of 0.51%).
| Demographics | Rating | Rank | 3 or more Vehicles in Household |
| Slovaks | 83.0 /100 | #147 | Excellent 20.1% |
| Guatemalans | 82.6 /100 | #148 | Excellent 20.1% |
| Immigrants | Iran | 80.9 /100 | #149 | Excellent 20.0% |
| Immigrants | Immigrants | 80.8 /100 | #150 | Excellent 20.0% |
| Taiwanese | 80.6 /100 | #151 | Excellent 20.0% |
| Lebanese | 79.8 /100 | #152 | Good 20.0% |
| Yuman | 75.6 /100 | #153 | Good 19.9% |
| Immigrants | Jordan | 75.0 /100 | #154 | Good 19.9% |
| Tlingit-Haida | 73.4 /100 | #155 | Good 19.9% |
| Thais | 71.1 /100 | #156 | Good 19.8% |
| Hungarians | 70.5 /100 | #157 | Good 19.8% |
| Armenians | 68.8 /100 | #158 | Good 19.8% |
| Immigrants | Pakistan | 68.2 /100 | #159 | Good 19.8% |
| Immigrants | Lebanon | 67.6 /100 | #160 | Good 19.8% |
| Immigrants | Guatemala | 65.6 /100 | #161 | Good 19.7% |