Zip Codes with the Highest Percentage of Population Employed in Accommodation & Food Services in Suffolk, VA
RELATED REPORTS & OPTIONS
Accommodation & Food Services
Suffolk
Compare Zip Codes
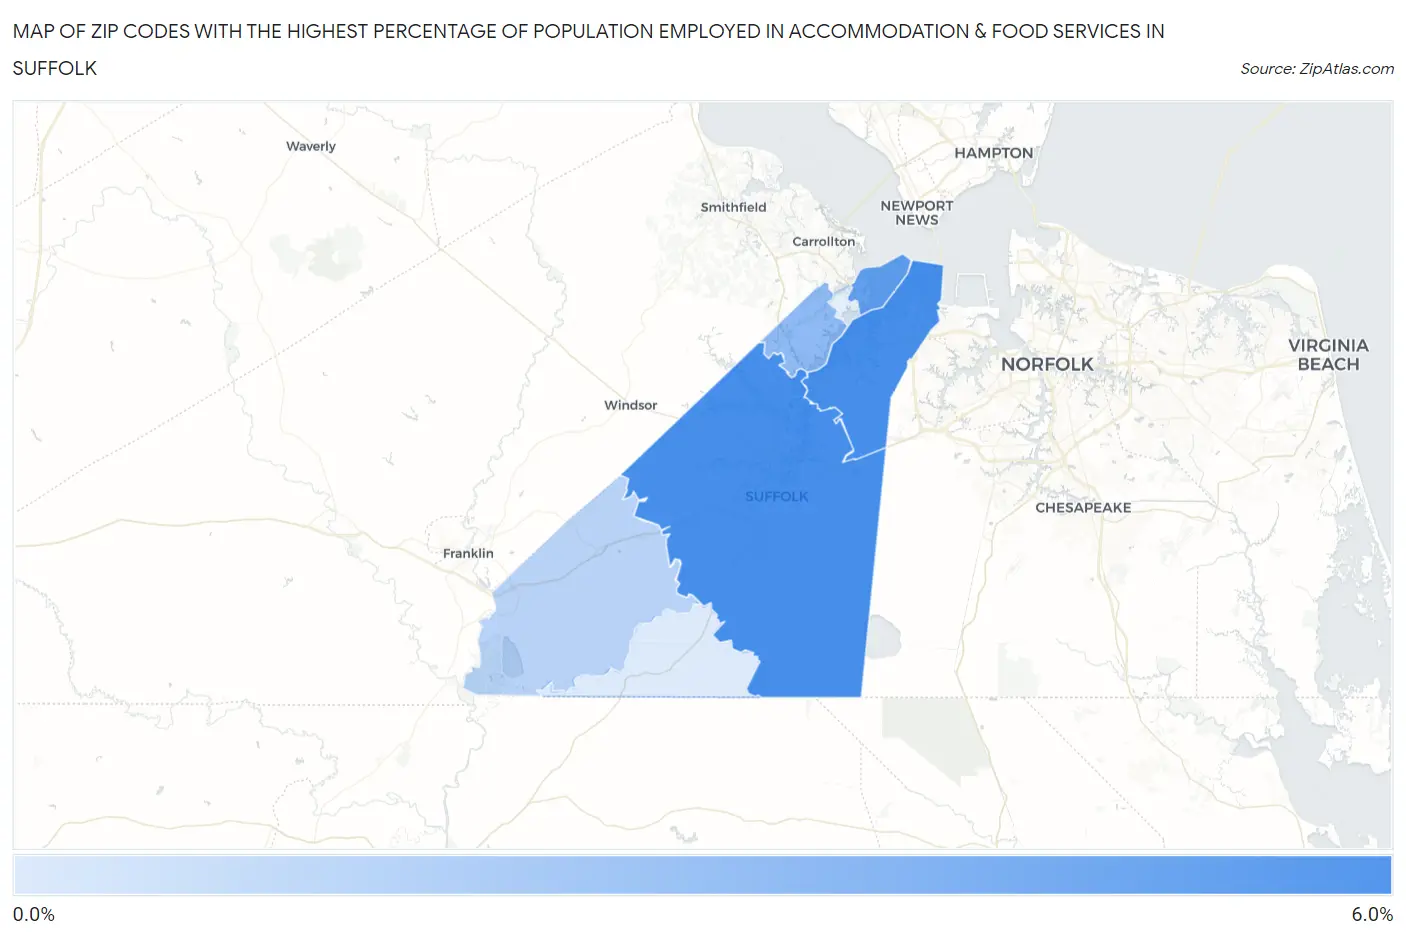
Map of Zip Codes with the Highest Percentage of Population Employed in Accommodation & Food Services in Suffolk
0.98%
5.9%
Zip Codes with the Highest Percentage of Population Employed in Accommodation & Food Services in Suffolk, VA
| Zip Code | % Employed | vs State | vs National | |
| 1. | 23434 | 5.9% | 6.4%(-0.583)#369 | 6.9%(-1.02)#13,924 |
| 2. | 23435 | 5.8% | 6.4%(-0.613)#372 | 6.9%(-1.05)#14,006 |
| 3. | 23433 | 4.9% | 6.4%(-1.57)#449 | 6.9%(-2.01)#17,243 |
| 4. | 23432 | 3.5% | 6.4%(-2.93)#560 | 6.9%(-3.37)#21,738 |
| 5. | 23437 | 2.2% | 6.4%(-4.26)#645 | 6.9%(-4.70)#25,186 |
| 6. | 23438 | 0.98% | 6.4%(-5.46)#691 | 6.9%(-5.90)#27,325 |
1
Common Questions
What are the Top 5 Zip Codes with the Highest Percentage of Population Employed in Accommodation & Food Services in Suffolk, VA?
Top 5 Zip Codes with the Highest Percentage of Population Employed in Accommodation & Food Services in Suffolk, VA are:
What zip code has the Highest Percentage of Population Employed in Accommodation & Food Services in Suffolk, VA?
23434 has the Highest Percentage of Population Employed in Accommodation & Food Services in Suffolk, VA with 5.9%.
What is the Percentage of Population Employed in Accommodation & Food Services in Suffolk, VA?
Percentage of Population Employed in Accommodation & Food Services in Suffolk is 5.4%.
What is the Percentage of Population Employed in Accommodation & Food Services in Virginia?
Percentage of Population Employed in Accommodation & Food Services in Virginia is 6.4%.
What is the Percentage of Population Employed in Accommodation & Food Services in the United States?
Percentage of Population Employed in Accommodation & Food Services in the United States is 6.9%.