Zip Codes with the Highest Percentage of Population Employed in Health Care & Social Assistance in Garland, TX

RELATED REPORTS & OPTIONS

Health Care & Social Assistance
Population
Families and Households
Female Fertility
Female Fertility (Unmarried)
Race (Community Size)
Race (Percentage)
Ancestry (Community Size)
AfghanAfricanAmericanApacheArabArgentineanAustrianBhutaneseBlackfeetBolivianBrazilianBritishBurmeseCajunCanadianCentral AmericanCentral American IndianCherokeeChickasawChoctawColombianComancheCosta RicanCreekCroatianCubanCzechCzechoslovakianDanishDominicanDutchEastern EuropeanEcuadorianEnglishEthiopianEuropeanFilipinoFinnishFrenchFrench American IndianFrench CanadianGermanGhanaianGreekGuatemalanHaitianHonduranHopiHungarianIndian (Asian)IndonesianIranianIraqiIrishItalianJamaicanJapaneseJordanianKenyanKoreanLaotianLebaneseLithuanianMalaysianMexicanMexican American IndianMongolianMoroccanNavajoNicaraguanNigerianNorthern EuropeanNorwegianPakistaniPalestinianPanamanianPeruvianPolishPortuguesePuerto RicanRomanianRussianSalvadoranScandinavianScotch-IrishScottishSeminoleSerbianSiouxSlavicSlovakSloveneSouth AfricanSouth AmericanSpaniardSpanishSri LankanSubsaharan AfricanSwedishSwissSyrianThaiTrinidadian and TobagonianTurkishUkrainianVenezuelanVietnameseWelshWest IndianYugoslavian
Ancestry (Percentage)
AfghanAfricanAmericanApacheArabArgentineanAustrianBhutaneseBlackfeetBolivianBrazilianBritishBurmeseCajunCanadianCentral AmericanCentral American IndianCherokeeChickasawChoctawColombianComancheCosta RicanCreekCroatianCubanCzechCzechoslovakianDanishDominicanDutchEastern EuropeanEcuadorianEnglishEthiopianEuropeanFilipinoFinnishFrenchFrench American IndianFrench CanadianGermanGhanaianGreekGuatemalanHaitianHonduranHopiHungarianIndian (Asian)IndonesianIranianIraqiIrishItalianJamaicanJapaneseJordanianKenyanKoreanLaotianLebaneseLithuanianMalaysianMexicanMexican American IndianMongolianMoroccanNavajoNicaraguanNigerianNorthern EuropeanNorwegianPakistaniPalestinianPanamanianPeruvianPolishPortuguesePuerto RicanRomanianRussianSalvadoranScandinavianScotch-IrishScottishSeminoleSerbianSiouxSlavicSlovakSloveneSouth AfricanSouth AmericanSpaniardSpanishSri LankanSubsaharan AfricanSwedishSwissSyrianThaiTrinidadian and TobagonianTurkishUkrainianVenezuelanVietnameseWelshWest IndianYugoslavian
Immigrant Origin (Total)
Immigrant Origin (Percentage)
Income
Income (Families)
Income (Households)
Poverty
Poverty (Families)
Unemployment
Employment Occupations
Employment Industries
Employer Class
Commute Time
Commute Means
School Enrollment
Education by Degree Field
Occupancy
Finances
Physical Characteristics
Garland
Compare Zip Codes
Comparison Subject

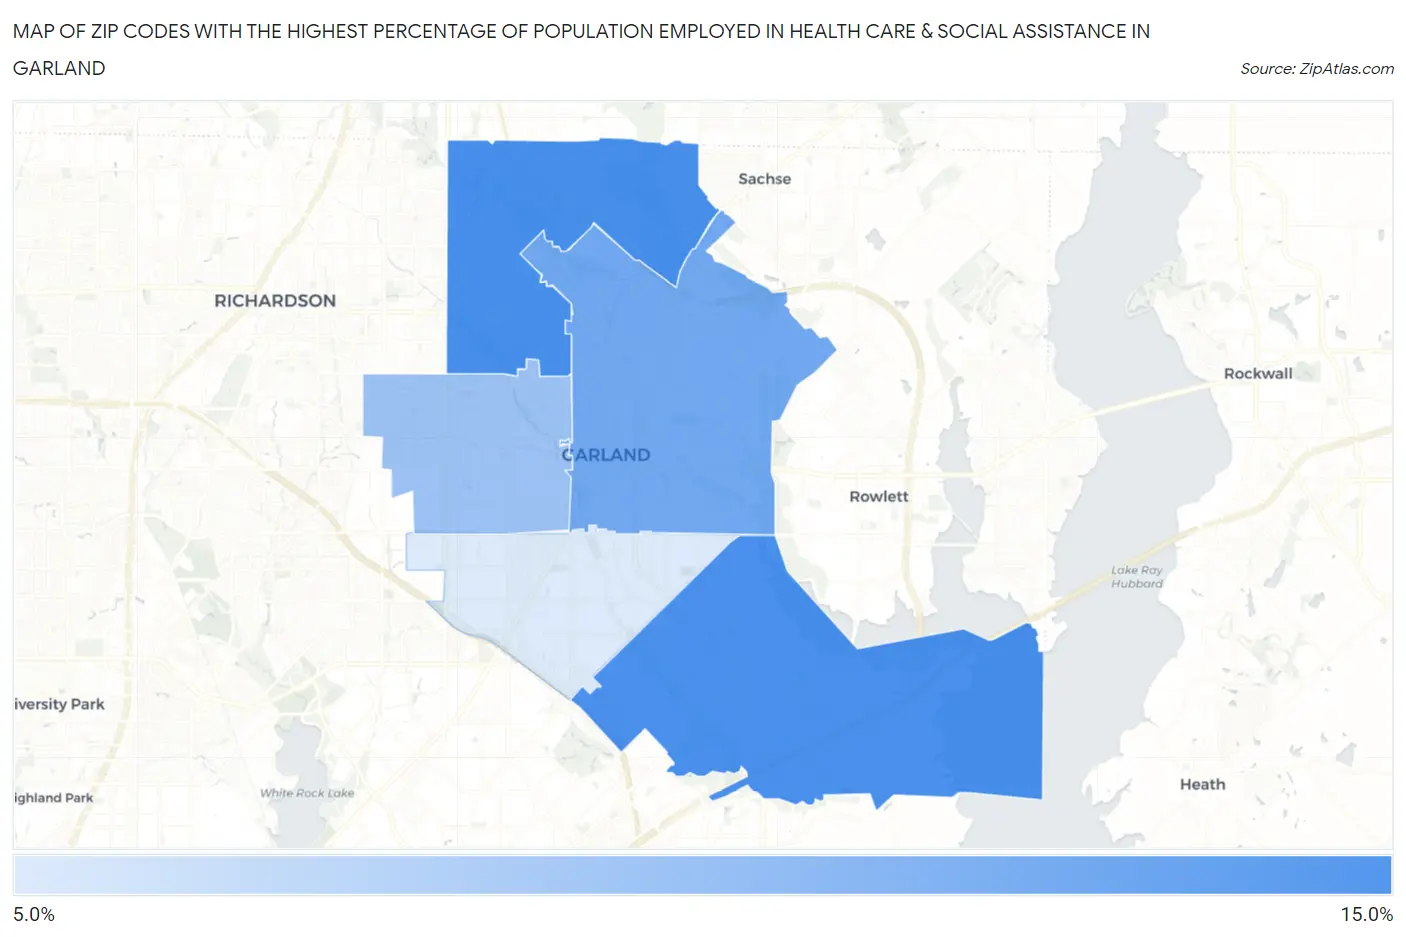
Map of Zip Codes with the Highest Percentage of Population Employed in Health Care & Social Assistance in Garland

0.0%
15.0%
Zip Codes with the Highest Percentage of Population Employed in Health Care & Social Assistance in Garland Map

Zip Codes with the Highest Percentage of Population Employed in Health Care & Social Assistance in Garland, TX

Zip Code % Employed vs State vs National
1.7504411.4%11.9%(-0.482)#89613.9%(-2.49)#20,336
2.7504311.4%11.9%(-0.515)#90713.9%(-2.53)#20,423
3.7504010.4%11.9%(-1.56)#1,06613.9%(-3.57)#22,724
4.750429.3%11.9%(-2.65)#1,23813.9%(-4.66)#24,739
5.750417.5%11.9%(-4.39)#1,45613.9%(-6.40)#26,967

Common Questions

What are the Top 3 Zip Codes with the Highest Percentage of Population Employed in Health Care & Social Assistance in Garland, TX?
Top 3 Zip Codes with the Highest Percentage of Population Employed in Health Care & Social Assistance in Garland, TX are:
#1
11.4%
#2
11.4%
#3
10.4%
What zip code has the Highest Percentage of Population Employed in Health Care & Social Assistance in Garland, TX?
75044 has the Highest Percentage of Population Employed in Health Care & Social Assistance in Garland, TX with 11.4%.
What is the Percentage of Population Employed in Health Care & Social Assistance in Garland, TX?
Percentage of Population Employed in Health Care & Social Assistance in Garland is 10.3%.
What is the Percentage of Population Employed in Health Care & Social Assistance in Texas?
Percentage of Population Employed in Health Care & Social Assistance in Texas is 11.9%.
What is the Percentage of Population Employed in Health Care & Social Assistance in the United States?
Percentage of Population Employed in Health Care & Social Assistance in the United States is 13.9%.