Thai vs Immigrants from Taiwan Receiving Food Stamps
COMPARE
Thai
Immigrants from Taiwan
Receiving Food Stamps
Receiving Food Stamps Comparison
Thais
Immigrants from Taiwan
8.1%
RECEIVING FOOD STAMPS
100.0/ 100
METRIC RATING
5th/ 347
METRIC RANK
7.3%
RECEIVING FOOD STAMPS
100.0/ 100
METRIC RATING
1st/ 347
METRIC RANK
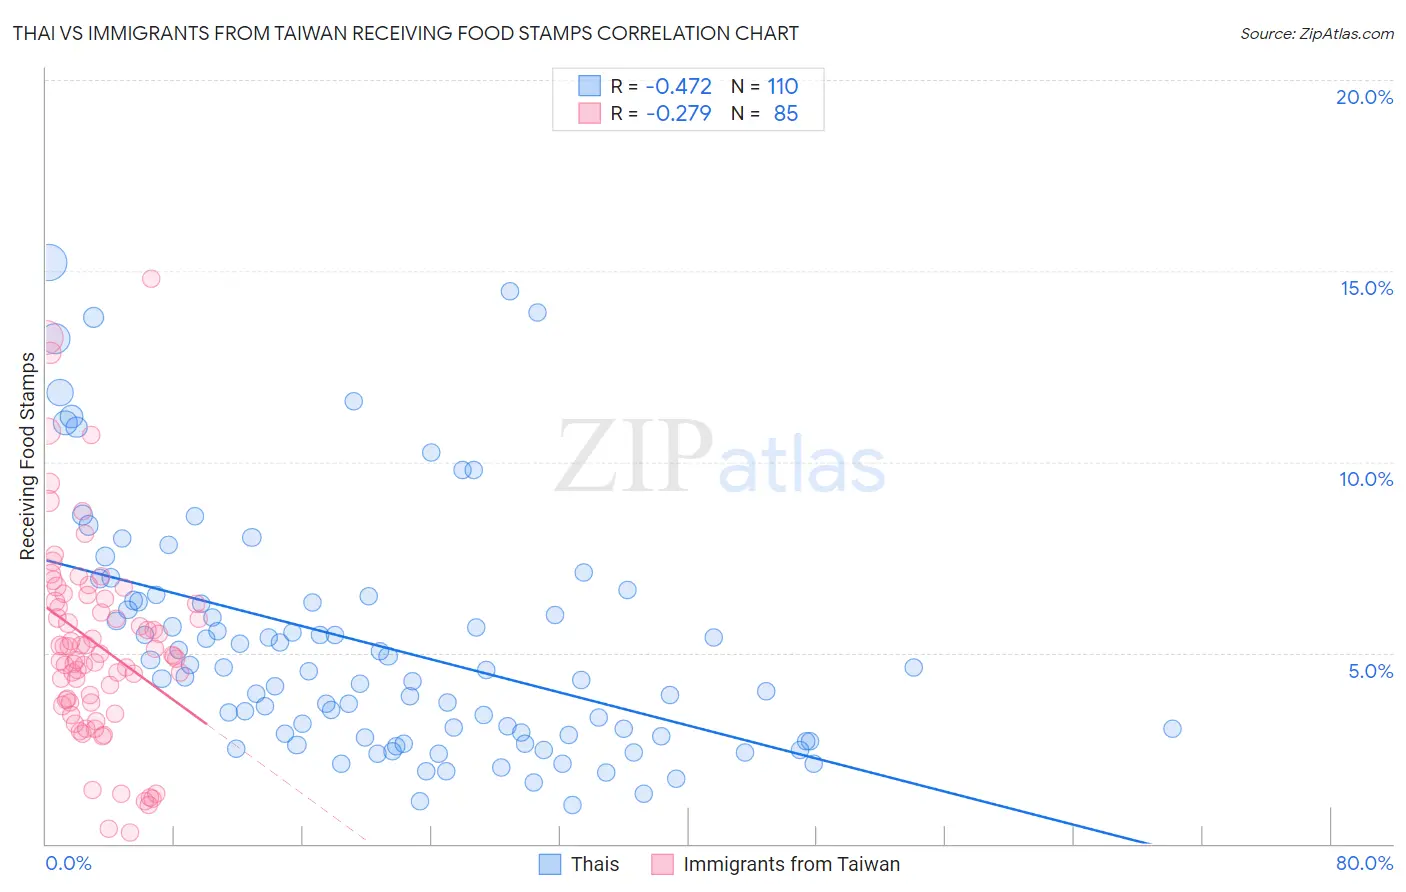
Thai vs Immigrants from Taiwan Receiving Food Stamps Correlation Chart
The statistical analysis conducted on geographies consisting of 473,754,114 people shows a moderate negative correlation between the proportion of Thais and percentage of population receiving government assistance and/or food stamps in the United States with a correlation coefficient (R) of -0.472 and weighted average of 8.1%. Similarly, the statistical analysis conducted on geographies consisting of 297,390,748 people shows a weak negative correlation between the proportion of Immigrants from Taiwan and percentage of population receiving government assistance and/or food stamps in the United States with a correlation coefficient (R) of -0.279 and weighted average of 7.3%, a difference of 11.0%.
Receiving Food Stamps Correlation Summary
| Measurement | Thai | Immigrants from Taiwan |
| Minimum | 1.0% | 0.30% |
| Maximum | 15.2% | 14.8% |
| Range | 14.2% | 14.5% |
| Mean | 5.2% | 5.2% |
| Median | 4.4% | 4.9% |
| Interquartile 25% (IQ1) | 2.8% | 3.7% |
| Interquartile 75% (IQ3) | 6.3% | 6.4% |
| Interquartile Range (IQR) | 3.5% | 2.7% |
| Standard Deviation (Sample) | 3.1% | 2.7% |
| Standard Deviation (Population) | 3.1% | 2.7% |
Demographics Similar to Thais and Immigrants from Taiwan by Receiving Food Stamps
In terms of receiving food stamps, the demographic groups most similar to Thais are Iranian (7.9%, a difference of 2.3%), Immigrants from Singapore (8.3%, a difference of 2.3%), Immigrants from Iran (8.3%, a difference of 2.9%), Burmese (8.6%, a difference of 6.6%), and Immigrants from Korea (8.7%, a difference of 6.8%). Similarly, the demographic groups most similar to Immigrants from Taiwan are Immigrants from India (7.4%, a difference of 0.87%), Filipino (7.4%, a difference of 1.1%), Iranian (7.9%, a difference of 8.5%), Immigrants from Singapore (8.3%, a difference of 13.6%), and Immigrants from Iran (8.3%, a difference of 14.2%).
| Demographics | Rating | Rank | Receiving Food Stamps |
| Immigrants | Taiwan | 100.0 /100 | #1 | Exceptional 7.3% |
| Immigrants | India | 100.0 /100 | #2 | Exceptional 7.4% |
| Filipinos | 100.0 /100 | #3 | Exceptional 7.4% |
| Iranians | 100.0 /100 | #4 | Exceptional 7.9% |
| Thais | 100.0 /100 | #5 | Exceptional 8.1% |
| Immigrants | Singapore | 100.0 /100 | #6 | Exceptional 8.3% |
| Immigrants | Iran | 100.0 /100 | #7 | Exceptional 8.3% |
| Burmese | 99.9 /100 | #8 | Exceptional 8.6% |
| Immigrants | Korea | 99.9 /100 | #9 | Exceptional 8.7% |
| Immigrants | South Central Asia | 99.9 /100 | #10 | Exceptional 8.8% |
| Okinawans | 99.9 /100 | #11 | Exceptional 8.9% |
| Cypriots | 99.9 /100 | #12 | Exceptional 8.9% |
| Bulgarians | 99.9 /100 | #13 | Exceptional 8.9% |
| Maltese | 99.9 /100 | #14 | Exceptional 8.9% |
| Norwegians | 99.9 /100 | #15 | Exceptional 9.0% |
| Immigrants | Japan | 99.9 /100 | #16 | Exceptional 9.0% |
| Immigrants | Scotland | 99.9 /100 | #17 | Exceptional 9.0% |
| Danes | 99.9 /100 | #18 | Exceptional 9.0% |
| Immigrants | Hong Kong | 99.8 /100 | #19 | Exceptional 9.1% |
| Latvians | 99.8 /100 | #20 | Exceptional 9.1% |