Subsaharan African vs Icelander Male Poverty
COMPARE
Subsaharan African
Icelander
Male Poverty
Male Poverty Comparison
Sub-Saharan Africans
Icelanders
13.3%
MALE POVERTY
0.1/ 100
METRIC RATING
268th/ 347
METRIC RANK
11.0%
MALE POVERTY
68.5/ 100
METRIC RATING
147th/ 347
METRIC RANK
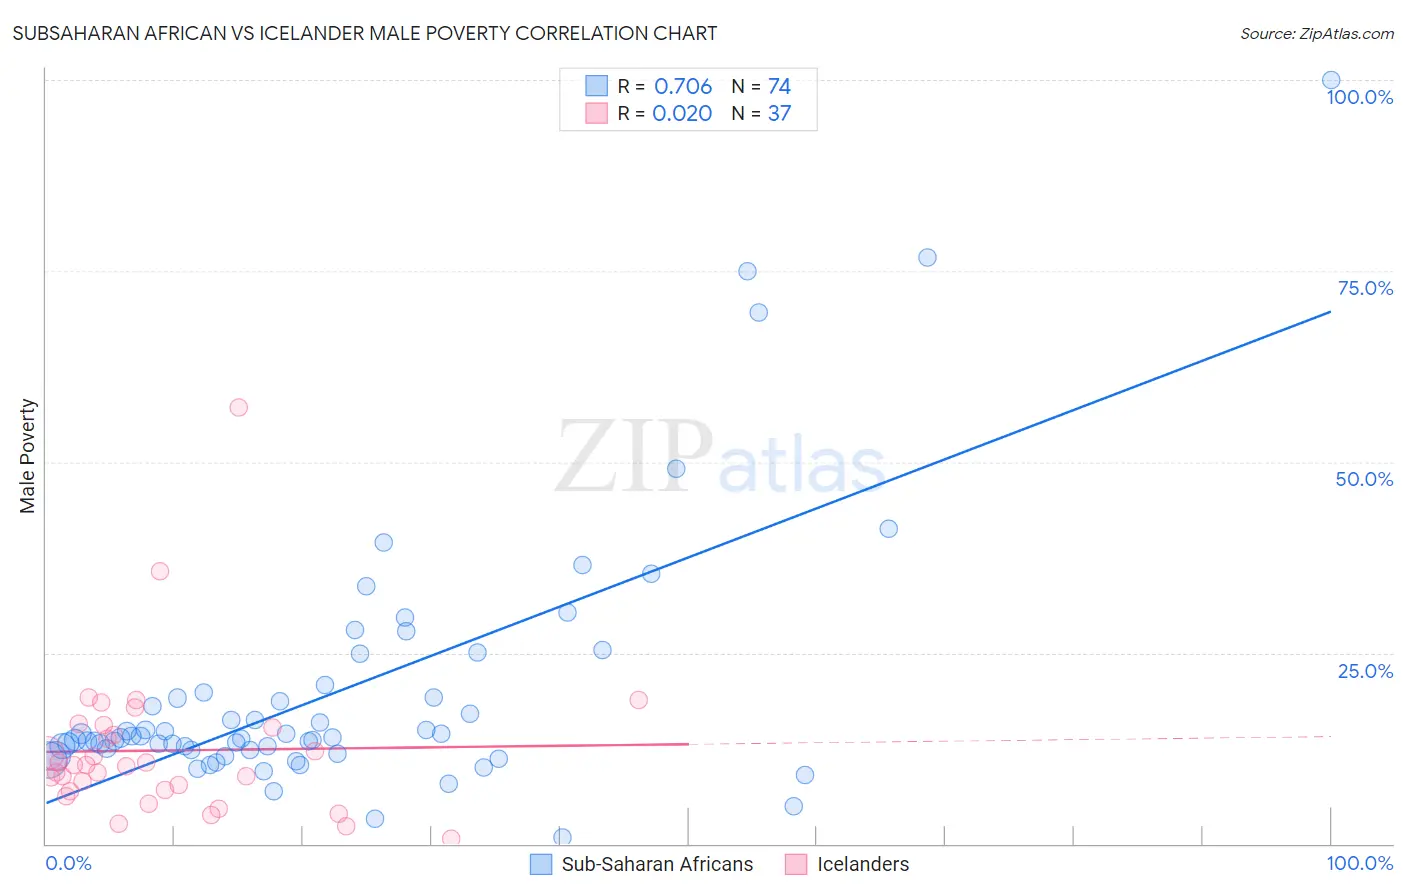
Subsaharan African vs Icelander Male Poverty Correlation Chart
The statistical analysis conducted on geographies consisting of 507,378,936 people shows a strong positive correlation between the proportion of Sub-Saharan Africans and poverty level among males in the United States with a correlation coefficient (R) of 0.706 and weighted average of 13.3%. Similarly, the statistical analysis conducted on geographies consisting of 159,599,836 people shows no correlation between the proportion of Icelanders and poverty level among males in the United States with a correlation coefficient (R) of 0.020 and weighted average of 11.0%, a difference of 20.8%.
Male Poverty Correlation Summary
| Measurement | Subsaharan African | Icelander |
| Minimum | 0.81% | 0.64% |
| Maximum | 100.0% | 57.1% |
| Range | 99.2% | 56.5% |
| Mean | 20.0% | 12.2% |
| Median | 13.9% | 10.3% |
| Interquartile 25% (IQ1) | 12.3% | 7.0% |
| Interquartile 75% (IQ3) | 19.8% | 15.4% |
| Interquartile Range (IQR) | 7.6% | 8.3% |
| Standard Deviation (Sample) | 17.2% | 10.0% |
| Standard Deviation (Population) | 17.0% | 9.8% |
Similar Demographics by Male Poverty
Demographics Similar to Sub-Saharan Africans by Male Poverty
In terms of male poverty, the demographic groups most similar to Sub-Saharan Africans are Immigrants from Jamaica (13.3%, a difference of 0.030%), Immigrants from Guyana (13.2%, a difference of 0.14%), Guyanese (13.3%, a difference of 0.22%), Jamaican (13.2%, a difference of 0.28%), and Iroquois (13.2%, a difference of 0.30%).
| Demographics | Rating | Rank | Male Poverty |
| Trinidadians and Tobagonians | 0.1 /100 | #261 | Tragic 13.1% |
| Spanish American Indians | 0.1 /100 | #262 | Tragic 13.1% |
| Central Americans | 0.1 /100 | #263 | Tragic 13.2% |
| Iroquois | 0.1 /100 | #264 | Tragic 13.2% |
| Jamaicans | 0.1 /100 | #265 | Tragic 13.2% |
| Immigrants | Guyana | 0.1 /100 | #266 | Tragic 13.2% |
| Immigrants | Jamaica | 0.1 /100 | #267 | Tragic 13.3% |
| Sub-Saharan Africans | 0.1 /100 | #268 | Tragic 13.3% |
| Guyanese | 0.0 /100 | #269 | Tragic 13.3% |
| Cree | 0.0 /100 | #270 | Tragic 13.3% |
| Spanish Americans | 0.0 /100 | #271 | Tragic 13.4% |
| Immigrants | Bahamas | 0.0 /100 | #272 | Tragic 13.5% |
| Chickasaw | 0.0 /100 | #273 | Tragic 13.5% |
| Immigrants | West Indies | 0.0 /100 | #274 | Tragic 13.5% |
| Barbadians | 0.0 /100 | #275 | Tragic 13.6% |
Demographics Similar to Icelanders by Male Poverty
In terms of male poverty, the demographic groups most similar to Icelanders are Armenian (11.0%, a difference of 0.050%), Immigrants from Venezuela (11.0%, a difference of 0.070%), Guamanian/Chamorro (11.0%, a difference of 0.11%), Venezuelan (11.0%, a difference of 0.13%), and Immigrants from Nepal (11.0%, a difference of 0.14%).
| Demographics | Rating | Rank | Male Poverty |
| Tlingit-Haida | 76.1 /100 | #140 | Good 10.9% |
| Immigrants | France | 75.8 /100 | #141 | Good 10.9% |
| Basques | 74.6 /100 | #142 | Good 10.9% |
| Afghans | 71.9 /100 | #143 | Good 10.9% |
| Samoans | 71.8 /100 | #144 | Good 10.9% |
| Immigrants | Germany | 71.6 /100 | #145 | Good 10.9% |
| Syrians | 71.4 /100 | #146 | Good 10.9% |
| Icelanders | 68.5 /100 | #147 | Good 11.0% |
| Armenians | 68.0 /100 | #148 | Good 11.0% |
| Immigrants | Venezuela | 67.9 /100 | #149 | Good 11.0% |
| Guamanians/Chamorros | 67.6 /100 | #150 | Good 11.0% |
| Venezuelans | 67.4 /100 | #151 | Good 11.0% |
| Immigrants | Nepal | 67.3 /100 | #152 | Good 11.0% |
| Immigrants | Bosnia and Herzegovina | 65.2 /100 | #153 | Good 11.0% |
| Immigrants | Kazakhstan | 64.8 /100 | #154 | Good 11.0% |