Subsaharan African vs Immigrants from Panama Male Poverty
COMPARE
Subsaharan African
Immigrants from Panama
Male Poverty
Male Poverty Comparison
Sub-Saharan Africans
Immigrants from Panama
13.3%
MALE POVERTY
0.1/ 100
METRIC RATING
268th/ 347
METRIC RANK
12.1%
MALE POVERTY
4.0/ 100
METRIC RATING
211th/ 347
METRIC RANK
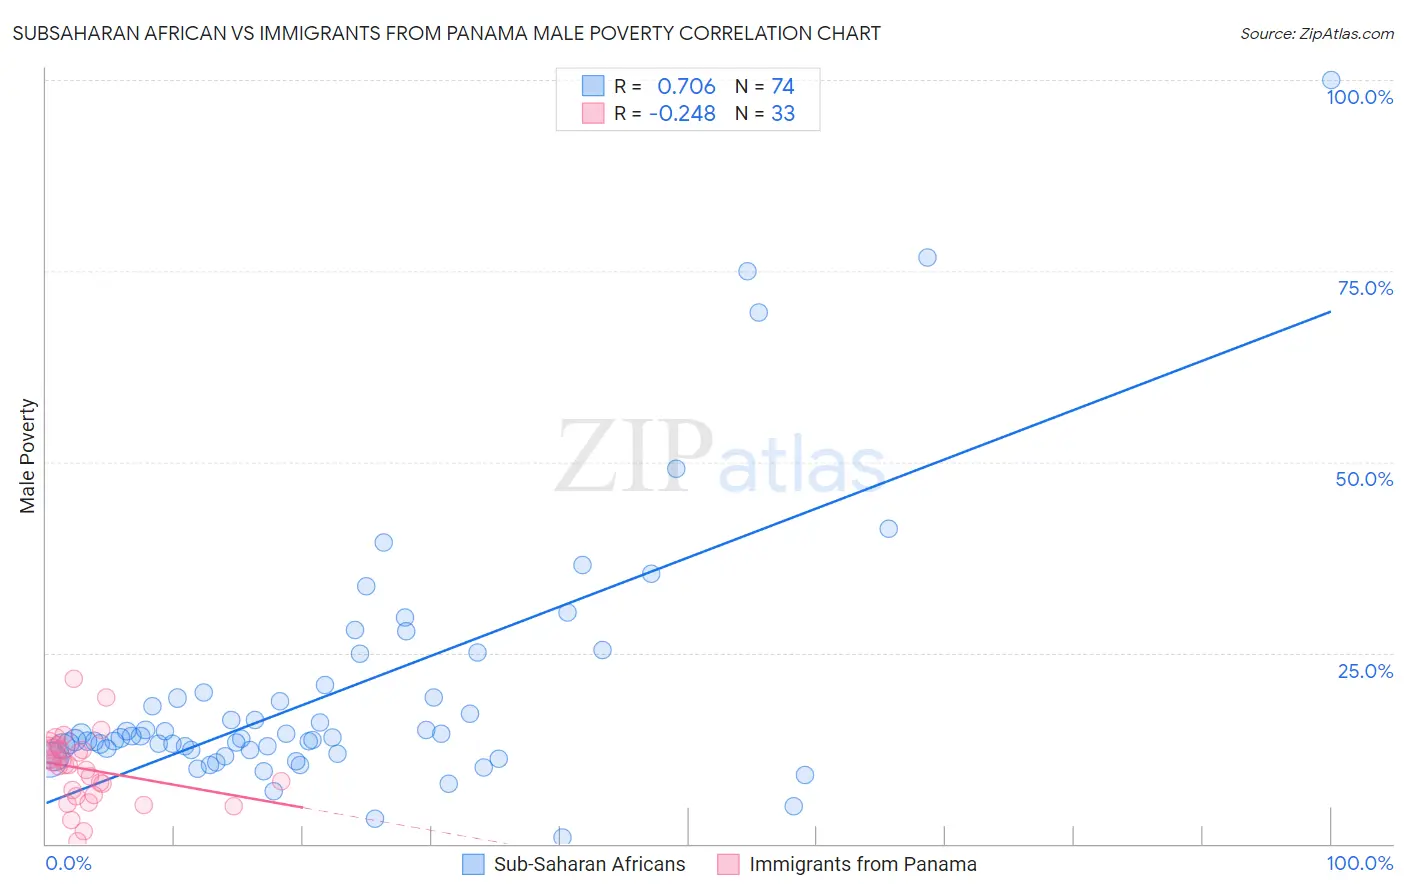
Subsaharan African vs Immigrants from Panama Male Poverty Correlation Chart
The statistical analysis conducted on geographies consisting of 507,378,936 people shows a strong positive correlation between the proportion of Sub-Saharan Africans and poverty level among males in the United States with a correlation coefficient (R) of 0.706 and weighted average of 13.3%. Similarly, the statistical analysis conducted on geographies consisting of 221,141,756 people shows a weak negative correlation between the proportion of Immigrants from Panama and poverty level among males in the United States with a correlation coefficient (R) of -0.248 and weighted average of 12.1%, a difference of 9.9%.
Male Poverty Correlation Summary
| Measurement | Subsaharan African | Immigrants from Panama |
| Minimum | 0.81% | 0.30% |
| Maximum | 100.0% | 21.6% |
| Range | 99.2% | 21.3% |
| Mean | 20.0% | 9.7% |
| Median | 13.9% | 10.3% |
| Interquartile 25% (IQ1) | 12.3% | 6.3% |
| Interquartile 75% (IQ3) | 19.8% | 12.5% |
| Interquartile Range (IQR) | 7.6% | 6.2% |
| Standard Deviation (Sample) | 17.2% | 4.6% |
| Standard Deviation (Population) | 17.0% | 4.5% |
Similar Demographics by Male Poverty
Demographics Similar to Sub-Saharan Africans by Male Poverty
In terms of male poverty, the demographic groups most similar to Sub-Saharan Africans are Immigrants from Jamaica (13.3%, a difference of 0.030%), Immigrants from Guyana (13.2%, a difference of 0.14%), Guyanese (13.3%, a difference of 0.22%), Jamaican (13.2%, a difference of 0.28%), and Iroquois (13.2%, a difference of 0.30%).
| Demographics | Rating | Rank | Male Poverty |
| Trinidadians and Tobagonians | 0.1 /100 | #261 | Tragic 13.1% |
| Spanish American Indians | 0.1 /100 | #262 | Tragic 13.1% |
| Central Americans | 0.1 /100 | #263 | Tragic 13.2% |
| Iroquois | 0.1 /100 | #264 | Tragic 13.2% |
| Jamaicans | 0.1 /100 | #265 | Tragic 13.2% |
| Immigrants | Guyana | 0.1 /100 | #266 | Tragic 13.2% |
| Immigrants | Jamaica | 0.1 /100 | #267 | Tragic 13.3% |
| Sub-Saharan Africans | 0.1 /100 | #268 | Tragic 13.3% |
| Guyanese | 0.0 /100 | #269 | Tragic 13.3% |
| Cree | 0.0 /100 | #270 | Tragic 13.3% |
| Spanish Americans | 0.0 /100 | #271 | Tragic 13.4% |
| Immigrants | Bahamas | 0.0 /100 | #272 | Tragic 13.5% |
| Chickasaw | 0.0 /100 | #273 | Tragic 13.5% |
| Immigrants | West Indies | 0.0 /100 | #274 | Tragic 13.5% |
| Barbadians | 0.0 /100 | #275 | Tragic 13.6% |
Demographics Similar to Immigrants from Panama by Male Poverty
In terms of male poverty, the demographic groups most similar to Immigrants from Panama are Moroccan (12.0%, a difference of 0.12%), Immigrants from the Azores (12.0%, a difference of 0.17%), Immigrants (12.0%, a difference of 0.29%), American (12.1%, a difference of 0.56%), and Nonimmigrants (12.1%, a difference of 0.60%).
| Demographics | Rating | Rank | Male Poverty |
| Immigrants | Uganda | 8.5 /100 | #204 | Tragic 11.8% |
| Panamanians | 6.2 /100 | #205 | Tragic 11.9% |
| Immigrants | Eastern Africa | 5.4 /100 | #206 | Tragic 12.0% |
| Malaysians | 5.2 /100 | #207 | Tragic 12.0% |
| Immigrants | Immigrants | 4.5 /100 | #208 | Tragic 12.0% |
| Immigrants | Azores | 4.3 /100 | #209 | Tragic 12.0% |
| Moroccans | 4.2 /100 | #210 | Tragic 12.0% |
| Immigrants | Panama | 4.0 /100 | #211 | Tragic 12.1% |
| Americans | 3.2 /100 | #212 | Tragic 12.1% |
| Immigrants | Nonimmigrants | 3.1 /100 | #213 | Tragic 12.1% |
| Japanese | 2.7 /100 | #214 | Tragic 12.2% |
| Immigrants | Uzbekistan | 2.6 /100 | #215 | Tragic 12.2% |
| Immigrants | Cambodia | 2.5 /100 | #216 | Tragic 12.2% |
| Immigrants | Thailand | 2.5 /100 | #217 | Tragic 12.2% |
| German Russians | 2.5 /100 | #218 | Tragic 12.2% |