Dominican vs South American Indian Receiving Food Stamps
COMPARE
Dominican
South American Indian
Receiving Food Stamps
Receiving Food Stamps Comparison
Dominicans
South American Indians
21.4%
RECEIVING FOOD STAMPS
0.0/ 100
METRIC RATING
338th/ 347
METRIC RANK
11.9%
RECEIVING FOOD STAMPS
41.7/ 100
METRIC RATING
181st/ 347
METRIC RANK
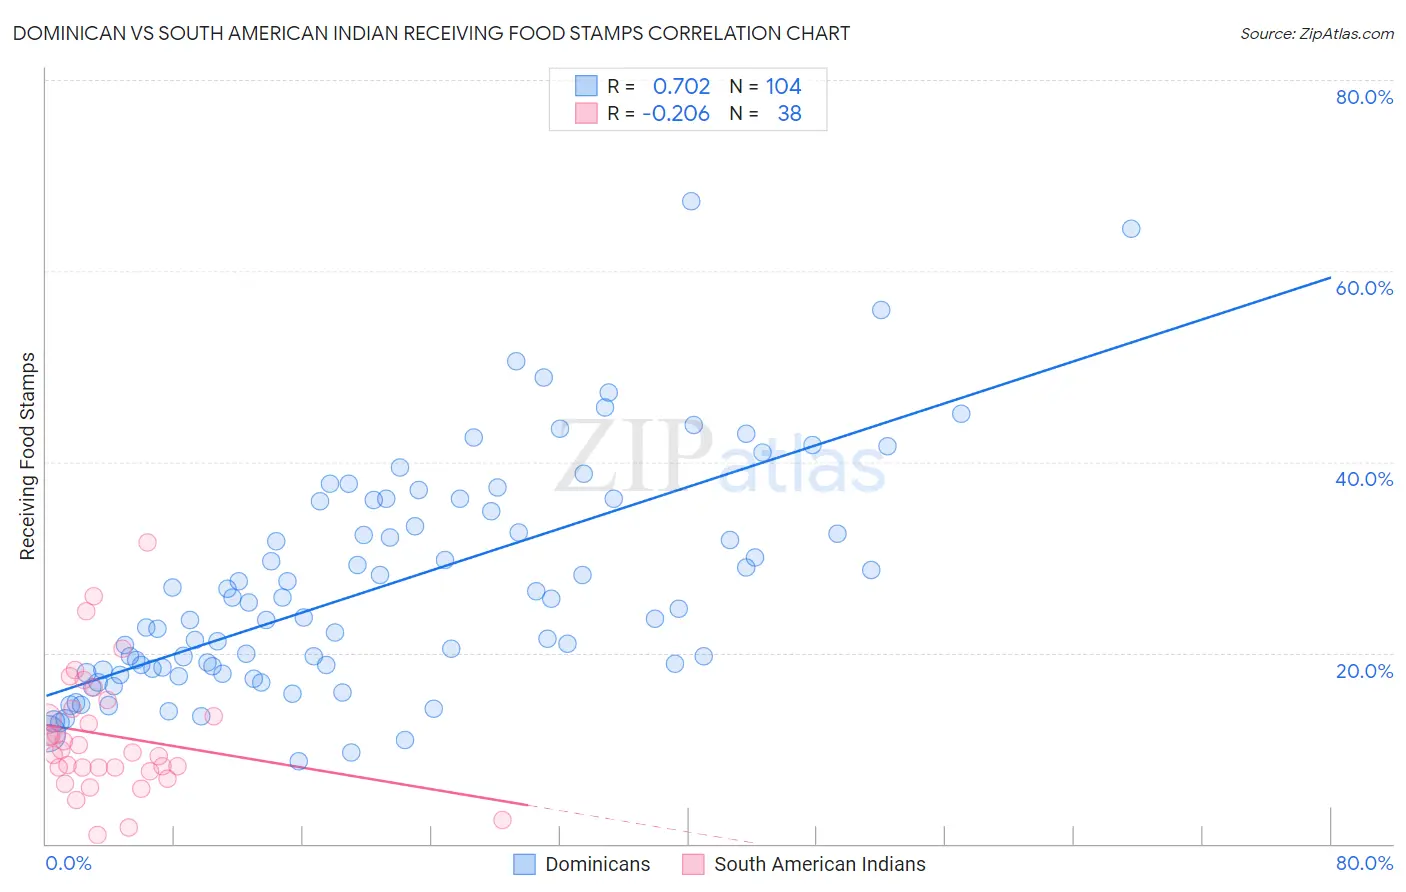
Dominican vs South American Indian Receiving Food Stamps Correlation Chart
The statistical analysis conducted on geographies consisting of 353,995,756 people shows a strong positive correlation between the proportion of Dominicans and percentage of population receiving government assistance and/or food stamps in the United States with a correlation coefficient (R) of 0.702 and weighted average of 21.4%. Similarly, the statistical analysis conducted on geographies consisting of 164,403,103 people shows a weak negative correlation between the proportion of South American Indians and percentage of population receiving government assistance and/or food stamps in the United States with a correlation coefficient (R) of -0.206 and weighted average of 11.9%, a difference of 79.9%.
Receiving Food Stamps Correlation Summary
| Measurement | Dominican | South American Indian |
| Minimum | 8.7% | 0.90% |
| Maximum | 67.3% | 31.6% |
| Range | 58.6% | 30.7% |
| Mean | 27.0% | 11.3% |
| Median | 24.1% | 9.7% |
| Interquartile 25% (IQ1) | 18.3% | 7.9% |
| Interquartile 75% (IQ3) | 35.4% | 14.1% |
| Interquartile Range (IQR) | 17.1% | 6.2% |
| Standard Deviation (Sample) | 11.8% | 6.6% |
| Standard Deviation (Population) | 11.7% | 6.5% |
Similar Demographics by Receiving Food Stamps
Demographics Similar to Dominicans by Receiving Food Stamps
In terms of receiving food stamps, the demographic groups most similar to Dominicans are Yakama (21.4%, a difference of 0.26%), Tohono O'odham (21.5%, a difference of 0.52%), Hopi (21.6%, a difference of 0.89%), Immigrants from Yemen (21.6%, a difference of 1.3%), and Cape Verdean (21.1%, a difference of 1.4%).
| Demographics | Rating | Rank | Receiving Food Stamps |
| Immigrants | Caribbean | 0.0 /100 | #331 | Tragic 19.6% |
| Pueblo | 0.0 /100 | #332 | Tragic 19.9% |
| Inupiat | 0.0 /100 | #333 | Tragic 20.1% |
| Yuman | 0.0 /100 | #334 | Tragic 20.2% |
| Immigrants | Cuba | 0.0 /100 | #335 | Tragic 20.8% |
| Navajo | 0.0 /100 | #336 | Tragic 21.1% |
| Cape Verdeans | 0.0 /100 | #337 | Tragic 21.1% |
| Dominicans | 0.0 /100 | #338 | Tragic 21.4% |
| Yakama | 0.0 /100 | #339 | Tragic 21.4% |
| Tohono O'odham | 0.0 /100 | #340 | Tragic 21.5% |
| Hopi | 0.0 /100 | #341 | Tragic 21.6% |
| Immigrants | Yemen | 0.0 /100 | #342 | Tragic 21.6% |
| Immigrants | Dominican Republic | 0.0 /100 | #343 | Tragic 22.1% |
| Lumbee | 0.0 /100 | #344 | Tragic 22.9% |
| Immigrants | Cabo Verde | 0.0 /100 | #345 | Tragic 23.8% |
Demographics Similar to South American Indians by Receiving Food Stamps
In terms of receiving food stamps, the demographic groups most similar to South American Indians are Immigrants from Morocco (11.9%, a difference of 0.15%), Immigrants from Uganda (11.9%, a difference of 0.20%), Spaniard (11.9%, a difference of 0.28%), Uruguayan (11.8%, a difference of 0.44%), and Immigrants from Kenya (11.8%, a difference of 0.66%).
| Demographics | Rating | Rank | Receiving Food Stamps |
| Immigrants | Eritrea | 50.0 /100 | #174 | Average 11.7% |
| Osage | 49.8 /100 | #175 | Average 11.7% |
| Peruvians | 49.3 /100 | #176 | Average 11.7% |
| Immigrants | Ukraine | 48.4 /100 | #177 | Average 11.8% |
| German Russians | 48.1 /100 | #178 | Average 11.8% |
| Immigrants | Kenya | 46.4 /100 | #179 | Average 11.8% |
| Uruguayans | 44.8 /100 | #180 | Average 11.8% |
| South American Indians | 41.7 /100 | #181 | Average 11.9% |
| Immigrants | Morocco | 40.7 /100 | #182 | Average 11.9% |
| Immigrants | Uganda | 40.3 /100 | #183 | Average 11.9% |
| Spaniards | 39.8 /100 | #184 | Fair 11.9% |
| Immigrants | Iraq | 37.1 /100 | #185 | Fair 12.0% |
| Spanish | 36.9 /100 | #186 | Fair 12.0% |
| Albanians | 35.4 /100 | #187 | Fair 12.0% |
| Sudanese | 33.4 /100 | #188 | Fair 12.0% |