Dominican vs Immigrants from Nepal Receiving Food Stamps
COMPARE
Dominican
Immigrants from Nepal
Receiving Food Stamps
Receiving Food Stamps Comparison
Dominicans
Immigrants from Nepal
21.4%
RECEIVING FOOD STAMPS
0.0/ 100
METRIC RATING
338th/ 347
METRIC RANK
10.6%
RECEIVING FOOD STAMPS
94.6/ 100
METRIC RATING
117th/ 347
METRIC RANK
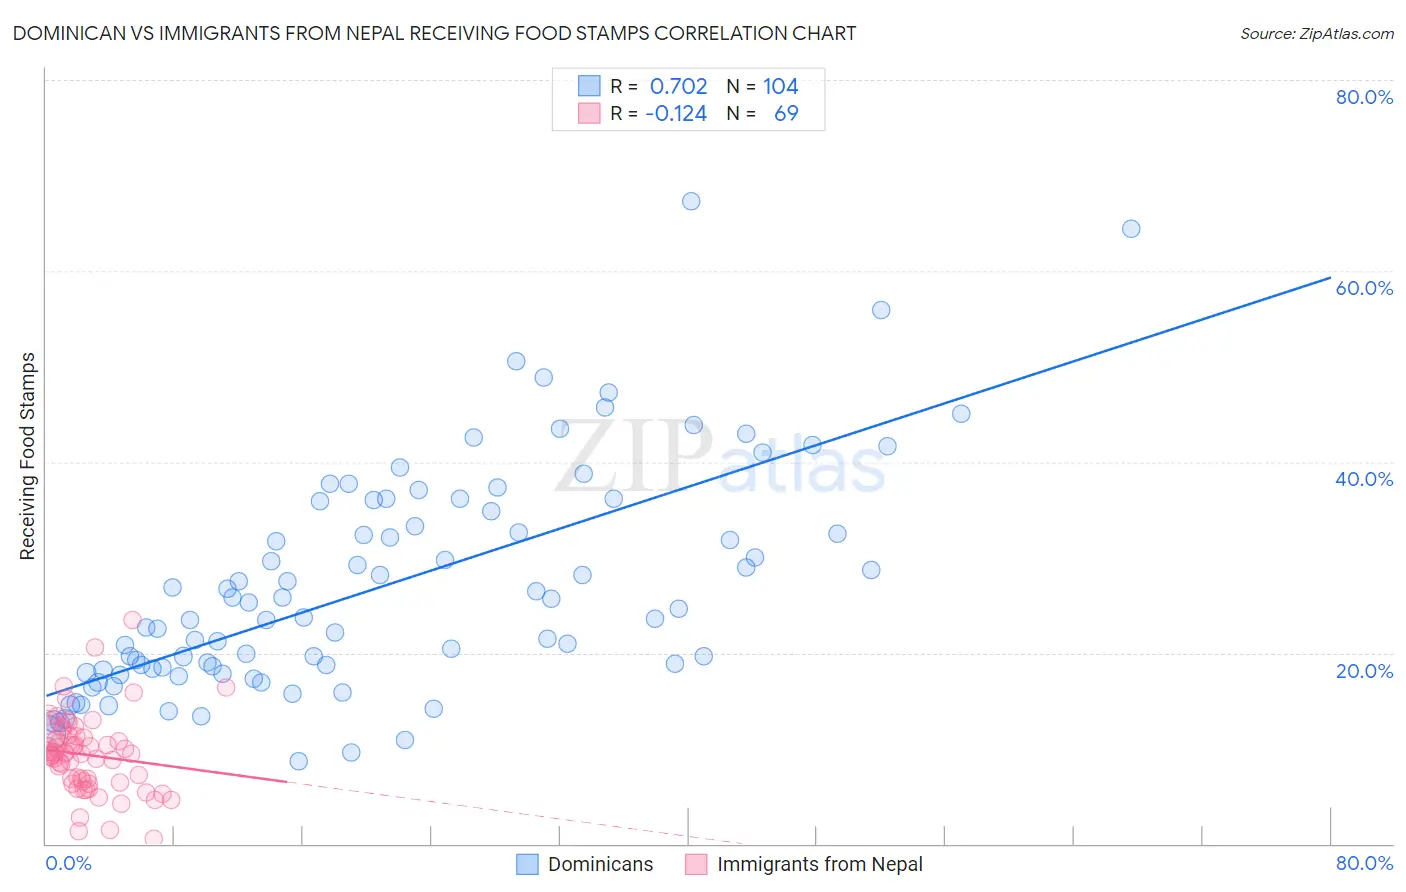
Dominican vs Immigrants from Nepal Receiving Food Stamps Correlation Chart
The statistical analysis conducted on geographies consisting of 353,995,756 people shows a strong positive correlation between the proportion of Dominicans and percentage of population receiving government assistance and/or food stamps in the United States with a correlation coefficient (R) of 0.702 and weighted average of 21.4%. Similarly, the statistical analysis conducted on geographies consisting of 186,476,550 people shows a poor negative correlation between the proportion of Immigrants from Nepal and percentage of population receiving government assistance and/or food stamps in the United States with a correlation coefficient (R) of -0.124 and weighted average of 10.6%, a difference of 102.2%.
Receiving Food Stamps Correlation Summary
| Measurement | Dominican | Immigrants from Nepal |
| Minimum | 8.7% | 0.50% |
| Maximum | 67.3% | 23.5% |
| Range | 58.6% | 23.0% |
| Mean | 27.0% | 9.3% |
| Median | 24.1% | 9.4% |
| Interquartile 25% (IQ1) | 18.3% | 6.5% |
| Interquartile 75% (IQ3) | 35.4% | 11.2% |
| Interquartile Range (IQR) | 17.1% | 4.7% |
| Standard Deviation (Sample) | 11.8% | 4.1% |
| Standard Deviation (Population) | 11.7% | 4.0% |
Similar Demographics by Receiving Food Stamps
Demographics Similar to Dominicans by Receiving Food Stamps
In terms of receiving food stamps, the demographic groups most similar to Dominicans are Yakama (21.4%, a difference of 0.26%), Tohono O'odham (21.5%, a difference of 0.52%), Hopi (21.6%, a difference of 0.89%), Immigrants from Yemen (21.6%, a difference of 1.3%), and Cape Verdean (21.1%, a difference of 1.4%).
| Demographics | Rating | Rank | Receiving Food Stamps |
| Immigrants | Caribbean | 0.0 /100 | #331 | Tragic 19.6% |
| Pueblo | 0.0 /100 | #332 | Tragic 19.9% |
| Inupiat | 0.0 /100 | #333 | Tragic 20.1% |
| Yuman | 0.0 /100 | #334 | Tragic 20.2% |
| Immigrants | Cuba | 0.0 /100 | #335 | Tragic 20.8% |
| Navajo | 0.0 /100 | #336 | Tragic 21.1% |
| Cape Verdeans | 0.0 /100 | #337 | Tragic 21.1% |
| Dominicans | 0.0 /100 | #338 | Tragic 21.4% |
| Yakama | 0.0 /100 | #339 | Tragic 21.4% |
| Tohono O'odham | 0.0 /100 | #340 | Tragic 21.5% |
| Hopi | 0.0 /100 | #341 | Tragic 21.6% |
| Immigrants | Yemen | 0.0 /100 | #342 | Tragic 21.6% |
| Immigrants | Dominican Republic | 0.0 /100 | #343 | Tragic 22.1% |
| Lumbee | 0.0 /100 | #344 | Tragic 22.9% |
| Immigrants | Cabo Verde | 0.0 /100 | #345 | Tragic 23.8% |
Demographics Similar to Immigrants from Nepal by Receiving Food Stamps
In terms of receiving food stamps, the demographic groups most similar to Immigrants from Nepal are Canadian (10.5%, a difference of 0.16%), Immigrants from Saudi Arabia (10.5%, a difference of 0.21%), Assyrian/Chaldean/Syriac (10.6%, a difference of 0.34%), Scotch-Irish (10.5%, a difference of 0.39%), and Immigrants from Poland (10.6%, a difference of 0.50%).
| Demographics | Rating | Rank | Receiving Food Stamps |
| Pakistanis | 95.9 /100 | #110 | Exceptional 10.4% |
| Romanians | 95.8 /100 | #111 | Exceptional 10.4% |
| Mongolians | 95.8 /100 | #112 | Exceptional 10.5% |
| Icelanders | 95.4 /100 | #113 | Exceptional 10.5% |
| Scotch-Irish | 95.1 /100 | #114 | Exceptional 10.5% |
| Immigrants | Saudi Arabia | 94.9 /100 | #115 | Exceptional 10.5% |
| Canadians | 94.8 /100 | #116 | Exceptional 10.5% |
| Immigrants | Nepal | 94.6 /100 | #117 | Exceptional 10.6% |
| Assyrians/Chaldeans/Syriacs | 94.1 /100 | #118 | Exceptional 10.6% |
| Immigrants | Poland | 93.9 /100 | #119 | Exceptional 10.6% |
| Ethiopians | 93.9 /100 | #120 | Exceptional 10.6% |
| Slavs | 93.8 /100 | #121 | Exceptional 10.6% |
| Sri Lankans | 93.7 /100 | #122 | Exceptional 10.6% |
| Immigrants | Philippines | 93.3 /100 | #123 | Exceptional 10.7% |
| Paraguayans | 93.0 /100 | #124 | Exceptional 10.7% |