Dominican vs White/Caucasian Receiving Food Stamps
COMPARE
Dominican
White/Caucasian
Receiving Food Stamps
Receiving Food Stamps Comparison
Dominicans
Whites/Caucasians
21.4%
RECEIVING FOOD STAMPS
0.0/ 100
METRIC RATING
338th/ 347
METRIC RANK
11.1%
RECEIVING FOOD STAMPS
83.9/ 100
METRIC RATING
147th/ 347
METRIC RANK
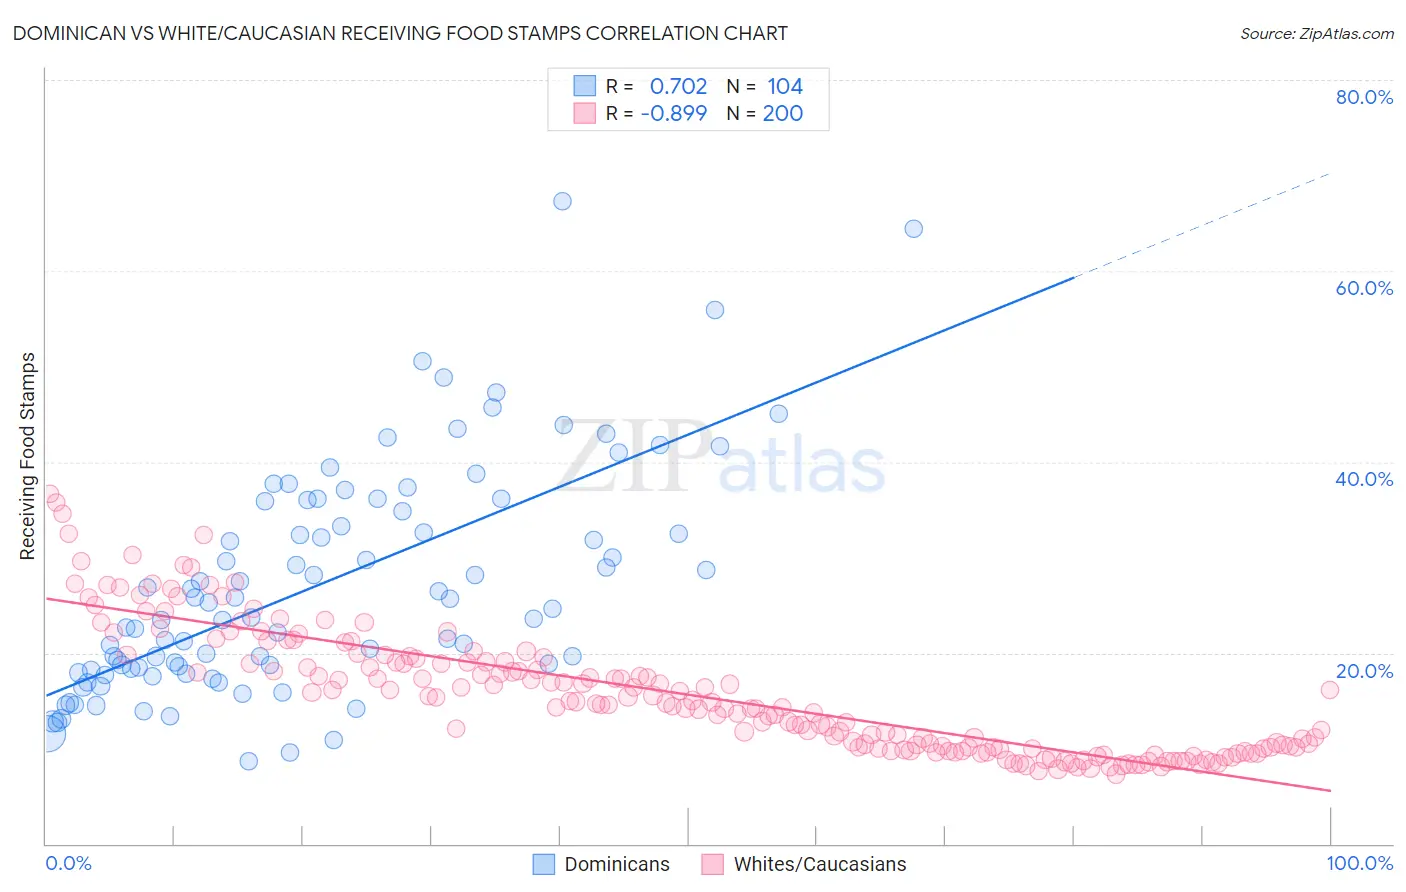
Dominican vs White/Caucasian Receiving Food Stamps Correlation Chart
The statistical analysis conducted on geographies consisting of 353,995,756 people shows a strong positive correlation between the proportion of Dominicans and percentage of population receiving government assistance and/or food stamps in the United States with a correlation coefficient (R) of 0.702 and weighted average of 21.4%. Similarly, the statistical analysis conducted on geographies consisting of 580,507,167 people shows a very strong negative correlation between the proportion of Whites/Caucasians and percentage of population receiving government assistance and/or food stamps in the United States with a correlation coefficient (R) of -0.899 and weighted average of 11.1%, a difference of 93.1%.
Receiving Food Stamps Correlation Summary
| Measurement | Dominican | White/Caucasian |
| Minimum | 8.7% | 7.3% |
| Maximum | 67.3% | 36.7% |
| Range | 58.6% | 29.4% |
| Mean | 27.0% | 15.6% |
| Median | 24.1% | 14.5% |
| Interquartile 25% (IQ1) | 18.3% | 10.0% |
| Interquartile 75% (IQ3) | 35.4% | 19.1% |
| Interquartile Range (IQR) | 17.1% | 9.1% |
| Standard Deviation (Sample) | 11.8% | 6.5% |
| Standard Deviation (Population) | 11.7% | 6.5% |
Similar Demographics by Receiving Food Stamps
Demographics Similar to Dominicans by Receiving Food Stamps
In terms of receiving food stamps, the demographic groups most similar to Dominicans are Yakama (21.4%, a difference of 0.26%), Tohono O'odham (21.5%, a difference of 0.52%), Hopi (21.6%, a difference of 0.89%), Immigrants from Yemen (21.6%, a difference of 1.3%), and Cape Verdean (21.1%, a difference of 1.4%).
| Demographics | Rating | Rank | Receiving Food Stamps |
| Immigrants | Caribbean | 0.0 /100 | #331 | Tragic 19.6% |
| Pueblo | 0.0 /100 | #332 | Tragic 19.9% |
| Inupiat | 0.0 /100 | #333 | Tragic 20.1% |
| Yuman | 0.0 /100 | #334 | Tragic 20.2% |
| Immigrants | Cuba | 0.0 /100 | #335 | Tragic 20.8% |
| Navajo | 0.0 /100 | #336 | Tragic 21.1% |
| Cape Verdeans | 0.0 /100 | #337 | Tragic 21.1% |
| Dominicans | 0.0 /100 | #338 | Tragic 21.4% |
| Yakama | 0.0 /100 | #339 | Tragic 21.4% |
| Tohono O'odham | 0.0 /100 | #340 | Tragic 21.5% |
| Hopi | 0.0 /100 | #341 | Tragic 21.6% |
| Immigrants | Yemen | 0.0 /100 | #342 | Tragic 21.6% |
| Immigrants | Dominican Republic | 0.0 /100 | #343 | Tragic 22.1% |
| Lumbee | 0.0 /100 | #344 | Tragic 22.9% |
| Immigrants | Cabo Verde | 0.0 /100 | #345 | Tragic 23.8% |
Demographics Similar to Whites/Caucasians by Receiving Food Stamps
In terms of receiving food stamps, the demographic groups most similar to Whites/Caucasians are Taiwanese (11.0%, a difference of 0.090%), Immigrants from South Eastern Asia (11.1%, a difference of 0.16%), Brazilian (11.1%, a difference of 0.18%), Soviet Union (11.1%, a difference of 0.21%), and Hungarian (11.0%, a difference of 0.34%).
| Demographics | Rating | Rank | Receiving Food Stamps |
| Celtics | 87.8 /100 | #140 | Excellent 10.9% |
| Immigrants | Vietnam | 86.7 /100 | #141 | Excellent 11.0% |
| Chileans | 86.2 /100 | #142 | Excellent 11.0% |
| Immigrants | Northern Africa | 86.0 /100 | #143 | Excellent 11.0% |
| Syrians | 85.5 /100 | #144 | Excellent 11.0% |
| Hungarians | 85.1 /100 | #145 | Excellent 11.0% |
| Taiwanese | 84.2 /100 | #146 | Excellent 11.0% |
| Whites/Caucasians | 83.9 /100 | #147 | Excellent 11.1% |
| Immigrants | South Eastern Asia | 83.3 /100 | #148 | Excellent 11.1% |
| Brazilians | 83.2 /100 | #149 | Excellent 11.1% |
| Soviet Union | 83.1 /100 | #150 | Excellent 11.1% |
| Immigrants | Spain | 81.7 /100 | #151 | Excellent 11.1% |
| Immigrants | Kazakhstan | 81.7 /100 | #152 | Excellent 11.1% |
| Lebanese | 81.6 /100 | #153 | Excellent 11.1% |
| Armenians | 81.4 /100 | #154 | Excellent 11.1% |