American vs Indonesian Receiving Food Stamps
COMPARE
American
Indonesian
Receiving Food Stamps
Receiving Food Stamps Comparison
Americans
Indonesians
12.2%
RECEIVING FOOD STAMPS
26.7/ 100
METRIC RATING
195th/ 347
METRIC RANK
13.9%
RECEIVING FOOD STAMPS
0.6/ 100
METRIC RATING
249th/ 347
METRIC RANK
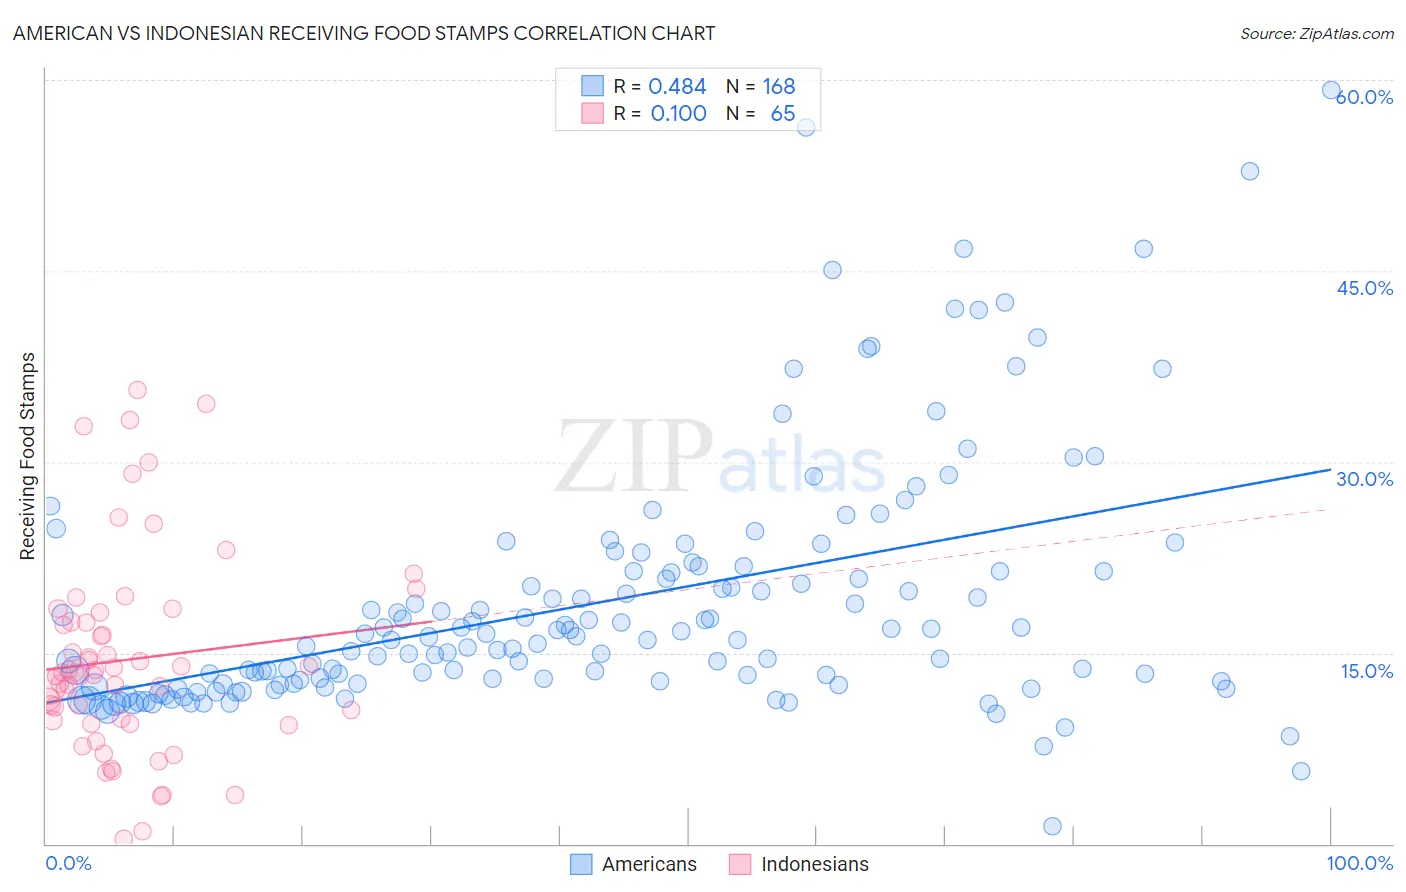
American vs Indonesian Receiving Food Stamps Correlation Chart
The statistical analysis conducted on geographies consisting of 578,010,429 people shows a moderate positive correlation between the proportion of Americans and percentage of population receiving government assistance and/or food stamps in the United States with a correlation coefficient (R) of 0.484 and weighted average of 12.2%. Similarly, the statistical analysis conducted on geographies consisting of 162,471,591 people shows a poor positive correlation between the proportion of Indonesians and percentage of population receiving government assistance and/or food stamps in the United States with a correlation coefficient (R) of 0.100 and weighted average of 13.9%, a difference of 14.0%.
Receiving Food Stamps Correlation Summary
| Measurement | American | Indonesian |
| Minimum | 1.4% | 0.40% |
| Maximum | 59.3% | 35.6% |
| Range | 57.9% | 35.2% |
| Mean | 18.9% | 14.5% |
| Median | 16.0% | 13.4% |
| Interquartile 25% (IQ1) | 12.6% | 9.6% |
| Interquartile 75% (IQ3) | 21.4% | 17.8% |
| Interquartile Range (IQR) | 8.8% | 8.2% |
| Standard Deviation (Sample) | 9.8% | 7.9% |
| Standard Deviation (Population) | 9.7% | 7.8% |
Similar Demographics by Receiving Food Stamps
Demographics Similar to Americans by Receiving Food Stamps
In terms of receiving food stamps, the demographic groups most similar to Americans are Iraqi (12.2%, a difference of 0.030%), Immigrants from Sudan (12.1%, a difference of 0.060%), Delaware (12.2%, a difference of 0.11%), Immigrants from Fiji (12.1%, a difference of 0.18%), and Immigrants from Costa Rica (12.2%, a difference of 0.24%).
| Demographics | Rating | Rank | Receiving Food Stamps |
| Sudanese | 33.4 /100 | #188 | Fair 12.0% |
| Immigrants | Cameroon | 32.5 /100 | #189 | Fair 12.0% |
| Immigrants | Peru | 32.2 /100 | #190 | Fair 12.0% |
| Venezuelans | 32.1 /100 | #191 | Fair 12.0% |
| Samoans | 31.0 /100 | #192 | Fair 12.1% |
| Immigrants | Fiji | 27.8 /100 | #193 | Fair 12.1% |
| Immigrants | Sudan | 27.1 /100 | #194 | Fair 12.1% |
| Americans | 26.7 /100 | #195 | Fair 12.2% |
| Iraqis | 26.6 /100 | #196 | Fair 12.2% |
| Delaware | 26.1 /100 | #197 | Fair 12.2% |
| Immigrants | Costa Rica | 25.4 /100 | #198 | Fair 12.2% |
| Portuguese | 25.1 /100 | #199 | Fair 12.2% |
| Sierra Leoneans | 23.6 /100 | #200 | Fair 12.2% |
| Ugandans | 22.5 /100 | #201 | Fair 12.2% |
| Immigrants | Venezuela | 20.1 /100 | #202 | Fair 12.3% |
Demographics Similar to Indonesians by Receiving Food Stamps
In terms of receiving food stamps, the demographic groups most similar to Indonesians are Immigrants from Cambodia (13.9%, a difference of 0.17%), Yaqui (13.9%, a difference of 0.24%), Immigrants from Laos (13.8%, a difference of 0.63%), Ghanaian (14.0%, a difference of 0.69%), and Mexican American Indian (13.8%, a difference of 0.73%).
| Demographics | Rating | Rank | Receiving Food Stamps |
| Immigrants | Panama | 1.0 /100 | #242 | Tragic 13.6% |
| Somalis | 0.9 /100 | #243 | Tragic 13.7% |
| Cajuns | 0.9 /100 | #244 | Tragic 13.7% |
| Immigrants | Somalia | 0.9 /100 | #245 | Tragic 13.7% |
| Cree | 0.8 /100 | #246 | Tragic 13.7% |
| Mexican American Indians | 0.7 /100 | #247 | Tragic 13.8% |
| Immigrants | Laos | 0.7 /100 | #248 | Tragic 13.8% |
| Indonesians | 0.6 /100 | #249 | Tragic 13.9% |
| Immigrants | Cambodia | 0.5 /100 | #250 | Tragic 13.9% |
| Yaqui | 0.5 /100 | #251 | Tragic 13.9% |
| Ghanaians | 0.5 /100 | #252 | Tragic 14.0% |
| Spanish Americans | 0.4 /100 | #253 | Tragic 14.0% |
| Marshallese | 0.3 /100 | #254 | Tragic 14.1% |
| Sub-Saharan Africans | 0.3 /100 | #255 | Tragic 14.1% |
| Japanese | 0.3 /100 | #256 | Tragic 14.1% |