American vs Immigrants from Afghanistan Receiving Food Stamps
COMPARE
American
Immigrants from Afghanistan
Receiving Food Stamps
Receiving Food Stamps Comparison
Americans
Immigrants from Afghanistan
12.2%
RECEIVING FOOD STAMPS
26.7/ 100
METRIC RATING
195th/ 347
METRIC RANK
11.3%
RECEIVING FOOD STAMPS
75.6/ 100
METRIC RATING
156th/ 347
METRIC RANK
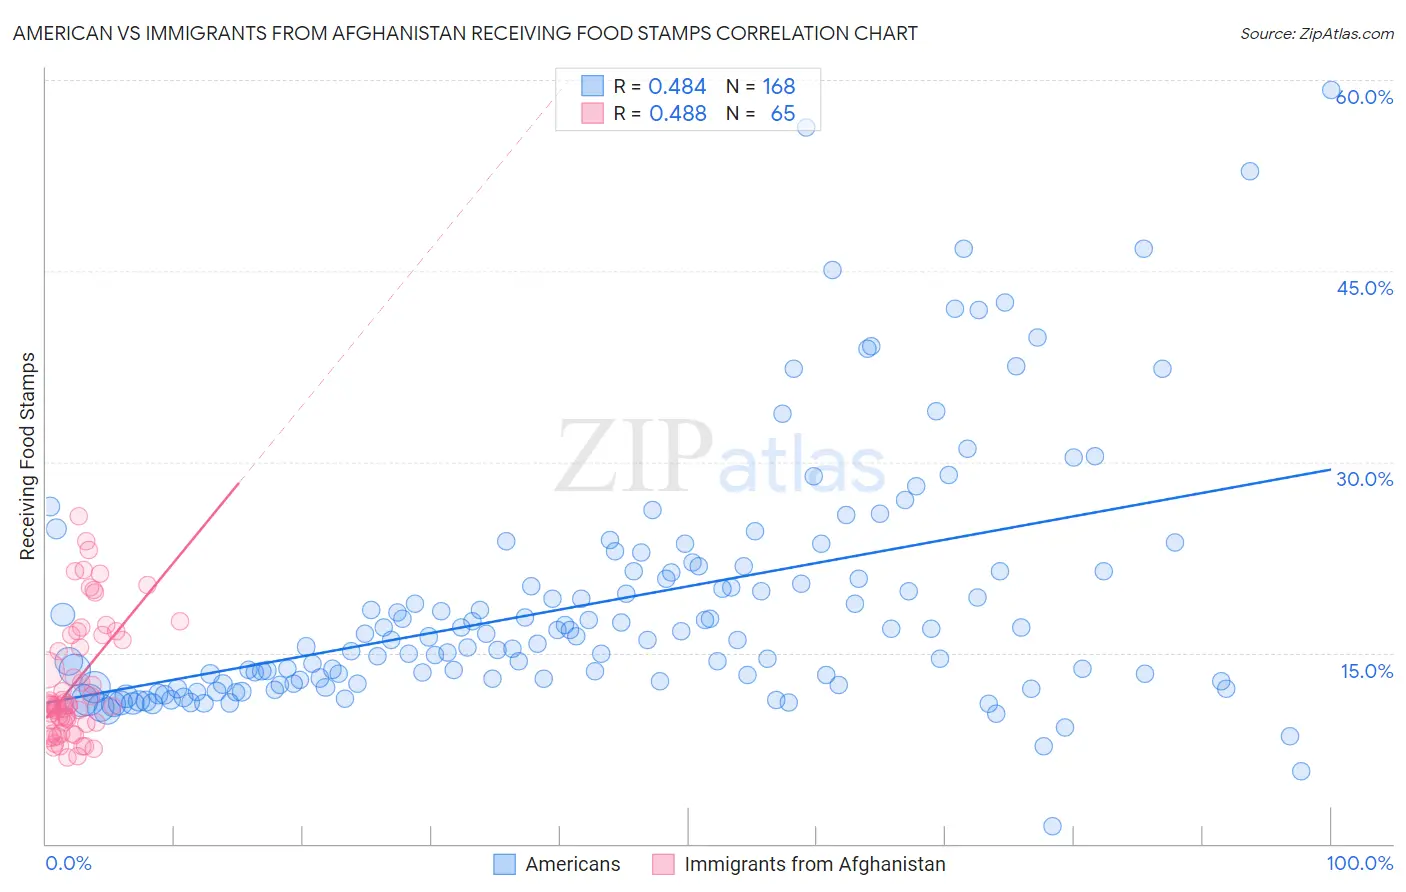
American vs Immigrants from Afghanistan Receiving Food Stamps Correlation Chart
The statistical analysis conducted on geographies consisting of 578,010,429 people shows a moderate positive correlation between the proportion of Americans and percentage of population receiving government assistance and/or food stamps in the United States with a correlation coefficient (R) of 0.484 and weighted average of 12.2%. Similarly, the statistical analysis conducted on geographies consisting of 147,557,843 people shows a moderate positive correlation between the proportion of Immigrants from Afghanistan and percentage of population receiving government assistance and/or food stamps in the United States with a correlation coefficient (R) of 0.488 and weighted average of 11.3%, a difference of 7.8%.
Receiving Food Stamps Correlation Summary
| Measurement | American | Immigrants from Afghanistan |
| Minimum | 1.4% | 6.7% |
| Maximum | 59.3% | 25.7% |
| Range | 57.9% | 19.0% |
| Mean | 18.9% | 12.7% |
| Median | 16.0% | 10.9% |
| Interquartile 25% (IQ1) | 12.6% | 9.5% |
| Interquartile 75% (IQ3) | 21.4% | 16.4% |
| Interquartile Range (IQR) | 8.8% | 6.9% |
| Standard Deviation (Sample) | 9.8% | 4.8% |
| Standard Deviation (Population) | 9.7% | 4.7% |
Similar Demographics by Receiving Food Stamps
Demographics Similar to Americans by Receiving Food Stamps
In terms of receiving food stamps, the demographic groups most similar to Americans are Iraqi (12.2%, a difference of 0.030%), Immigrants from Sudan (12.1%, a difference of 0.060%), Delaware (12.2%, a difference of 0.11%), Immigrants from Fiji (12.1%, a difference of 0.18%), and Immigrants from Costa Rica (12.2%, a difference of 0.24%).
| Demographics | Rating | Rank | Receiving Food Stamps |
| Sudanese | 33.4 /100 | #188 | Fair 12.0% |
| Immigrants | Cameroon | 32.5 /100 | #189 | Fair 12.0% |
| Immigrants | Peru | 32.2 /100 | #190 | Fair 12.0% |
| Venezuelans | 32.1 /100 | #191 | Fair 12.0% |
| Samoans | 31.0 /100 | #192 | Fair 12.1% |
| Immigrants | Fiji | 27.8 /100 | #193 | Fair 12.1% |
| Immigrants | Sudan | 27.1 /100 | #194 | Fair 12.1% |
| Americans | 26.7 /100 | #195 | Fair 12.2% |
| Iraqis | 26.6 /100 | #196 | Fair 12.2% |
| Delaware | 26.1 /100 | #197 | Fair 12.2% |
| Immigrants | Costa Rica | 25.4 /100 | #198 | Fair 12.2% |
| Portuguese | 25.1 /100 | #199 | Fair 12.2% |
| Sierra Leoneans | 23.6 /100 | #200 | Fair 12.2% |
| Ugandans | 22.5 /100 | #201 | Fair 12.2% |
| Immigrants | Venezuela | 20.1 /100 | #202 | Fair 12.3% |
Demographics Similar to Immigrants from Afghanistan by Receiving Food Stamps
In terms of receiving food stamps, the demographic groups most similar to Immigrants from Afghanistan are Immigrants from Lebanon (11.3%, a difference of 0.080%), Immigrants from Bosnia and Herzegovina (11.3%, a difference of 0.56%), Immigrants from Oceania (11.4%, a difference of 0.95%), Immigrants from Argentina (11.2%, a difference of 1.0%), and French Canadian (11.4%, a difference of 1.1%).
| Demographics | Rating | Rank | Receiving Food Stamps |
| Brazilians | 83.2 /100 | #149 | Excellent 11.1% |
| Soviet Union | 83.1 /100 | #150 | Excellent 11.1% |
| Immigrants | Spain | 81.7 /100 | #151 | Excellent 11.1% |
| Immigrants | Kazakhstan | 81.7 /100 | #152 | Excellent 11.1% |
| Lebanese | 81.6 /100 | #153 | Excellent 11.1% |
| Armenians | 81.4 /100 | #154 | Excellent 11.1% |
| Immigrants | Argentina | 80.4 /100 | #155 | Excellent 11.2% |
| Immigrants | Afghanistan | 75.6 /100 | #156 | Good 11.3% |
| Immigrants | Lebanon | 75.2 /100 | #157 | Good 11.3% |
| Immigrants | Bosnia and Herzegovina | 72.6 /100 | #158 | Good 11.3% |
| Immigrants | Oceania | 70.4 /100 | #159 | Good 11.4% |
| French Canadians | 69.5 /100 | #160 | Good 11.4% |
| Pennsylvania Germans | 68.4 /100 | #161 | Good 11.4% |
| Alsatians | 68.0 /100 | #162 | Good 11.4% |
| Immigrants | Southern Europe | 65.8 /100 | #163 | Good 11.5% |