American vs Scottish Receiving Food Stamps
COMPARE
American
Scottish
Receiving Food Stamps
Receiving Food Stamps Comparison
Americans
Scottish
12.2%
RECEIVING FOOD STAMPS
26.7/ 100
METRIC RATING
195th/ 347
METRIC RANK
9.9%
RECEIVING FOOD STAMPS
98.9/ 100
METRIC RATING
71st/ 347
METRIC RANK
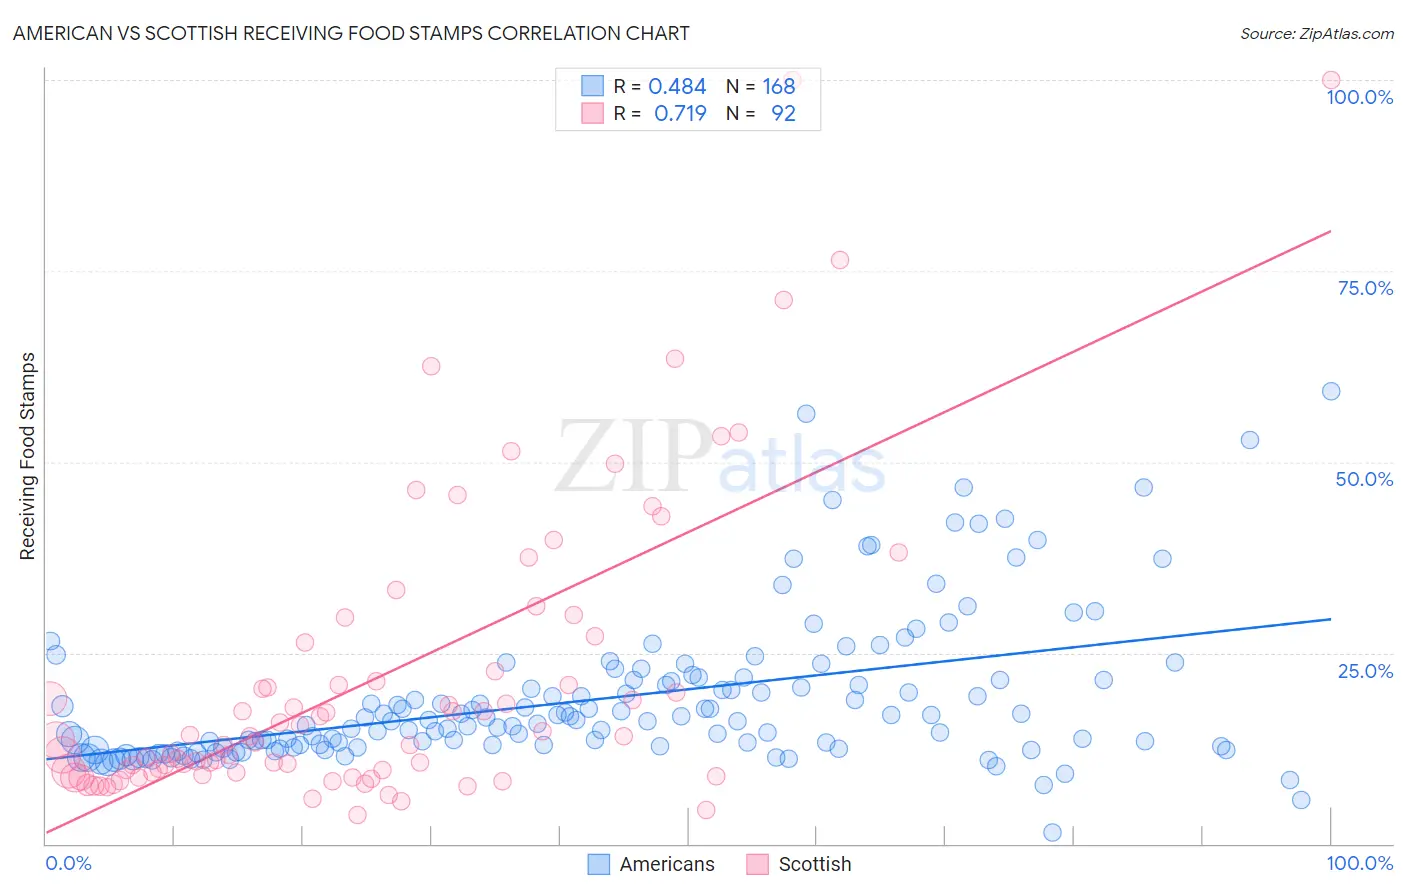
American vs Scottish Receiving Food Stamps Correlation Chart
The statistical analysis conducted on geographies consisting of 578,010,429 people shows a moderate positive correlation between the proportion of Americans and percentage of population receiving government assistance and/or food stamps in the United States with a correlation coefficient (R) of 0.484 and weighted average of 12.2%. Similarly, the statistical analysis conducted on geographies consisting of 563,544,150 people shows a strong positive correlation between the proportion of Scottish and percentage of population receiving government assistance and/or food stamps in the United States with a correlation coefficient (R) of 0.719 and weighted average of 9.9%, a difference of 23.1%.
Receiving Food Stamps Correlation Summary
| Measurement | American | Scottish |
| Minimum | 1.4% | 3.7% |
| Maximum | 59.3% | 100.0% |
| Range | 57.9% | 96.3% |
| Mean | 18.9% | 21.7% |
| Median | 16.0% | 13.8% |
| Interquartile 25% (IQ1) | 12.6% | 9.4% |
| Interquartile 75% (IQ3) | 21.4% | 24.5% |
| Interquartile Range (IQR) | 8.8% | 15.1% |
| Standard Deviation (Sample) | 9.8% | 19.9% |
| Standard Deviation (Population) | 9.7% | 19.8% |
Similar Demographics by Receiving Food Stamps
Demographics Similar to Americans by Receiving Food Stamps
In terms of receiving food stamps, the demographic groups most similar to Americans are Iraqi (12.2%, a difference of 0.030%), Immigrants from Sudan (12.1%, a difference of 0.060%), Delaware (12.2%, a difference of 0.11%), Immigrants from Fiji (12.1%, a difference of 0.18%), and Immigrants from Costa Rica (12.2%, a difference of 0.24%).
| Demographics | Rating | Rank | Receiving Food Stamps |
| Sudanese | 33.4 /100 | #188 | Fair 12.0% |
| Immigrants | Cameroon | 32.5 /100 | #189 | Fair 12.0% |
| Immigrants | Peru | 32.2 /100 | #190 | Fair 12.0% |
| Venezuelans | 32.1 /100 | #191 | Fair 12.0% |
| Samoans | 31.0 /100 | #192 | Fair 12.1% |
| Immigrants | Fiji | 27.8 /100 | #193 | Fair 12.1% |
| Immigrants | Sudan | 27.1 /100 | #194 | Fair 12.1% |
| Americans | 26.7 /100 | #195 | Fair 12.2% |
| Iraqis | 26.6 /100 | #196 | Fair 12.2% |
| Delaware | 26.1 /100 | #197 | Fair 12.2% |
| Immigrants | Costa Rica | 25.4 /100 | #198 | Fair 12.2% |
| Portuguese | 25.1 /100 | #199 | Fair 12.2% |
| Sierra Leoneans | 23.6 /100 | #200 | Fair 12.2% |
| Ugandans | 22.5 /100 | #201 | Fair 12.2% |
| Immigrants | Venezuela | 20.1 /100 | #202 | Fair 12.3% |
Demographics Similar to Scottish by Receiving Food Stamps
In terms of receiving food stamps, the demographic groups most similar to Scottish are Immigrants from Serbia (9.9%, a difference of 0.13%), Italian (9.9%, a difference of 0.18%), Immigrants from Asia (9.9%, a difference of 0.24%), Macedonian (9.9%, a difference of 0.30%), and Northern European (9.8%, a difference of 0.39%).
| Demographics | Rating | Rank | Receiving Food Stamps |
| Immigrants | North America | 99.2 /100 | #64 | Exceptional 9.8% |
| Immigrants | Turkey | 99.1 /100 | #65 | Exceptional 9.8% |
| Slovenes | 99.1 /100 | #66 | Exceptional 9.8% |
| Immigrants | Indonesia | 99.0 /100 | #67 | Exceptional 9.8% |
| Northern Europeans | 99.0 /100 | #68 | Exceptional 9.8% |
| Italians | 99.0 /100 | #69 | Exceptional 9.9% |
| Immigrants | Serbia | 99.0 /100 | #70 | Exceptional 9.9% |
| Scottish | 98.9 /100 | #71 | Exceptional 9.9% |
| Immigrants | Asia | 98.9 /100 | #72 | Exceptional 9.9% |
| Macedonians | 98.9 /100 | #73 | Exceptional 9.9% |
| New Zealanders | 98.8 /100 | #74 | Exceptional 9.9% |
| Immigrants | Zimbabwe | 98.7 /100 | #75 | Exceptional 9.9% |
| Immigrants | Croatia | 98.7 /100 | #76 | Exceptional 10.0% |
| Immigrants | North Macedonia | 98.7 /100 | #77 | Exceptional 10.0% |
| South Africans | 98.7 /100 | #78 | Exceptional 10.0% |