Zimbabwean vs Inupiat Single Father Poverty
COMPARE
Zimbabwean
Inupiat
Single Father Poverty
Single Father Poverty Comparison
Zimbabweans
Inupiat
15.6%
SINGLE FATHER POVERTY
98.1/ 100
METRIC RATING
98th/ 347
METRIC RANK
19.5%
SINGLE FATHER POVERTY
0.0/ 100
METRIC RATING
320th/ 347
METRIC RANK
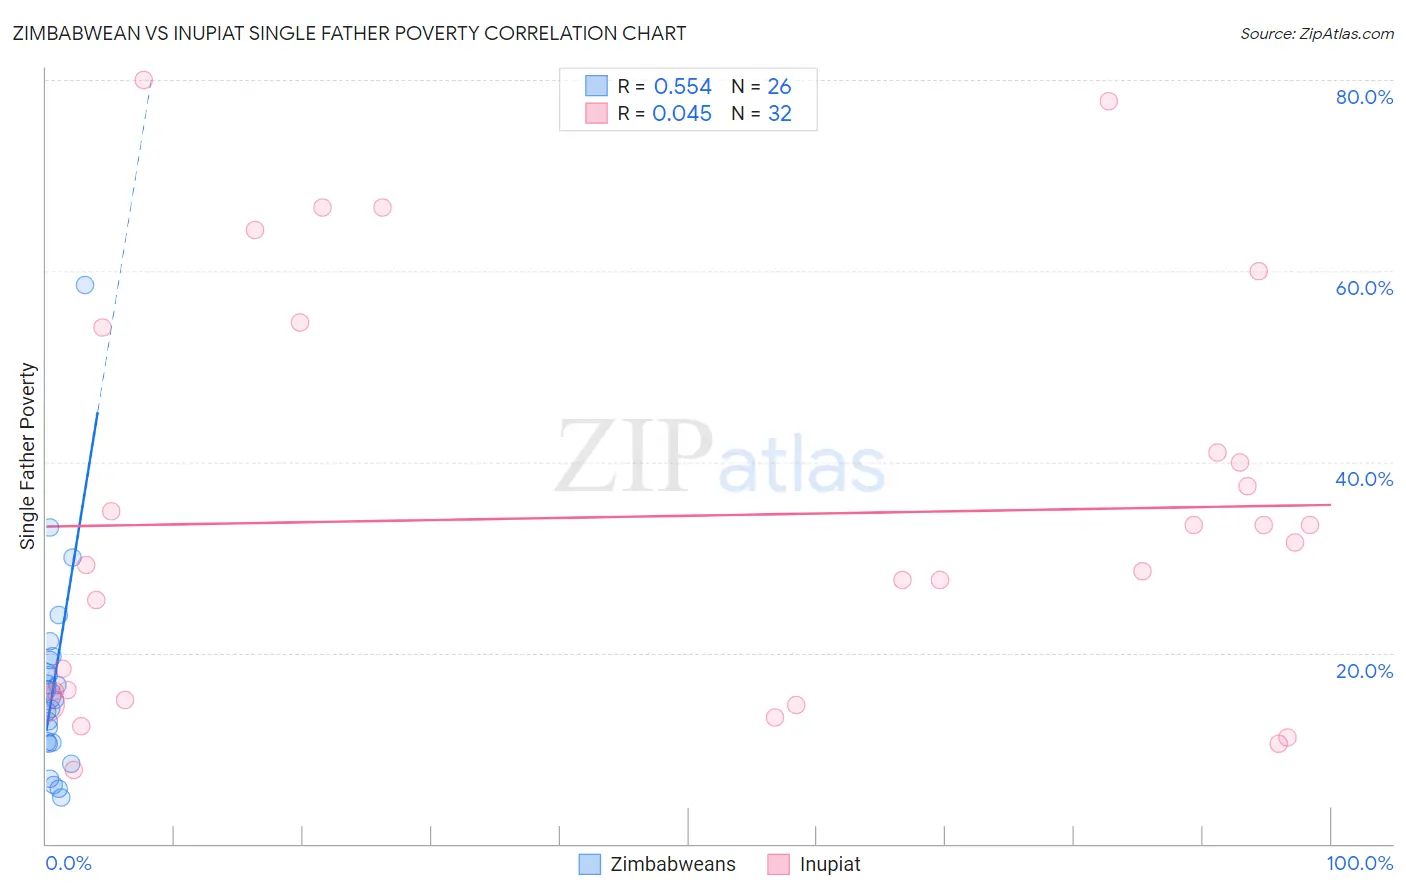
Zimbabwean vs Inupiat Single Father Poverty Correlation Chart
The statistical analysis conducted on geographies consisting of 64,763,564 people shows a substantial positive correlation between the proportion of Zimbabweans and poverty level among single fathers in the United States with a correlation coefficient (R) of 0.554 and weighted average of 15.6%. Similarly, the statistical analysis conducted on geographies consisting of 89,997,160 people shows no correlation between the proportion of Inupiat and poverty level among single fathers in the United States with a correlation coefficient (R) of 0.045 and weighted average of 19.5%, a difference of 25.0%.
Single Father Poverty Correlation Summary
| Measurement | Zimbabwean | Inupiat |
| Minimum | 4.8% | 7.7% |
| Maximum | 58.6% | 80.0% |
| Range | 53.8% | 72.3% |
| Mean | 16.8% | 34.3% |
| Median | 15.3% | 30.4% |
| Interquartile 25% (IQ1) | 10.6% | 15.5% |
| Interquartile 75% (IQ3) | 19.3% | 47.6% |
| Interquartile Range (IQR) | 8.7% | 32.1% |
| Standard Deviation (Sample) | 11.0% | 20.9% |
| Standard Deviation (Population) | 10.7% | 20.6% |
Similar Demographics by Single Father Poverty
Demographics Similar to Zimbabweans by Single Father Poverty
In terms of single father poverty, the demographic groups most similar to Zimbabweans are Yaqui (15.6%, a difference of 0.010%), Immigrants from Belgium (15.6%, a difference of 0.020%), Immigrants from Kazakhstan (15.6%, a difference of 0.030%), Immigrants from Uruguay (15.6%, a difference of 0.080%), and Basque (15.5%, a difference of 0.22%).
| Demographics | Rating | Rank | Single Father Poverty |
| Immigrants | Romania | 98.6 /100 | #91 | Exceptional 15.5% |
| Immigrants | Serbia | 98.5 /100 | #92 | Exceptional 15.5% |
| Basques | 98.4 /100 | #93 | Exceptional 15.5% |
| Immigrants | Uruguay | 98.2 /100 | #94 | Exceptional 15.6% |
| Immigrants | Kazakhstan | 98.2 /100 | #95 | Exceptional 15.6% |
| Immigrants | Belgium | 98.1 /100 | #96 | Exceptional 15.6% |
| Yaqui | 98.1 /100 | #97 | Exceptional 15.6% |
| Zimbabweans | 98.1 /100 | #98 | Exceptional 15.6% |
| Immigrants | Middle Africa | 97.4 /100 | #99 | Exceptional 15.6% |
| Immigrants | Chile | 96.9 /100 | #100 | Exceptional 15.7% |
| Fijians | 96.8 /100 | #101 | Exceptional 15.7% |
| Chileans | 96.4 /100 | #102 | Exceptional 15.7% |
| South American Indians | 96.2 /100 | #103 | Exceptional 15.7% |
| Australians | 96.1 /100 | #104 | Exceptional 15.7% |
| Immigrants | Australia | 96.1 /100 | #105 | Exceptional 15.7% |
Demographics Similar to Inupiat by Single Father Poverty
In terms of single father poverty, the demographic groups most similar to Inupiat are Cherokee (19.6%, a difference of 0.85%), Slovak (19.3%, a difference of 0.91%), Dutch West Indian (19.2%, a difference of 1.4%), Creek (19.8%, a difference of 1.9%), and Dominican (19.1%, a difference of 2.0%).
| Demographics | Rating | Rank | Single Father Poverty |
| Potawatomi | 0.0 /100 | #313 | Tragic 18.9% |
| Delaware | 0.0 /100 | #314 | Tragic 18.9% |
| Chickasaw | 0.0 /100 | #315 | Tragic 19.0% |
| Osage | 0.0 /100 | #316 | Tragic 19.0% |
| Dominicans | 0.0 /100 | #317 | Tragic 19.1% |
| Dutch West Indians | 0.0 /100 | #318 | Tragic 19.2% |
| Slovaks | 0.0 /100 | #319 | Tragic 19.3% |
| Inupiat | 0.0 /100 | #320 | Tragic 19.5% |
| Cherokee | 0.0 /100 | #321 | Tragic 19.6% |
| Creek | 0.0 /100 | #322 | Tragic 19.8% |
| Pennsylvania Germans | 0.0 /100 | #323 | Tragic 20.0% |
| Americans | 0.0 /100 | #324 | Tragic 20.1% |
| Blacks/African Americans | 0.0 /100 | #325 | Tragic 20.4% |
| Immigrants | Yemen | 0.0 /100 | #326 | Tragic 20.6% |
| Choctaw | 0.0 /100 | #327 | Tragic 20.7% |