Immigrants from Uzbekistan vs Inupiat Single Father Poverty
COMPARE
Immigrants from Uzbekistan
Inupiat
Single Father Poverty
Single Father Poverty Comparison
Immigrants from Uzbekistan
Inupiat
15.0%
SINGLE FATHER POVERTY
99.9/ 100
METRIC RATING
54th/ 347
METRIC RANK
19.5%
SINGLE FATHER POVERTY
0.0/ 100
METRIC RATING
320th/ 347
METRIC RANK
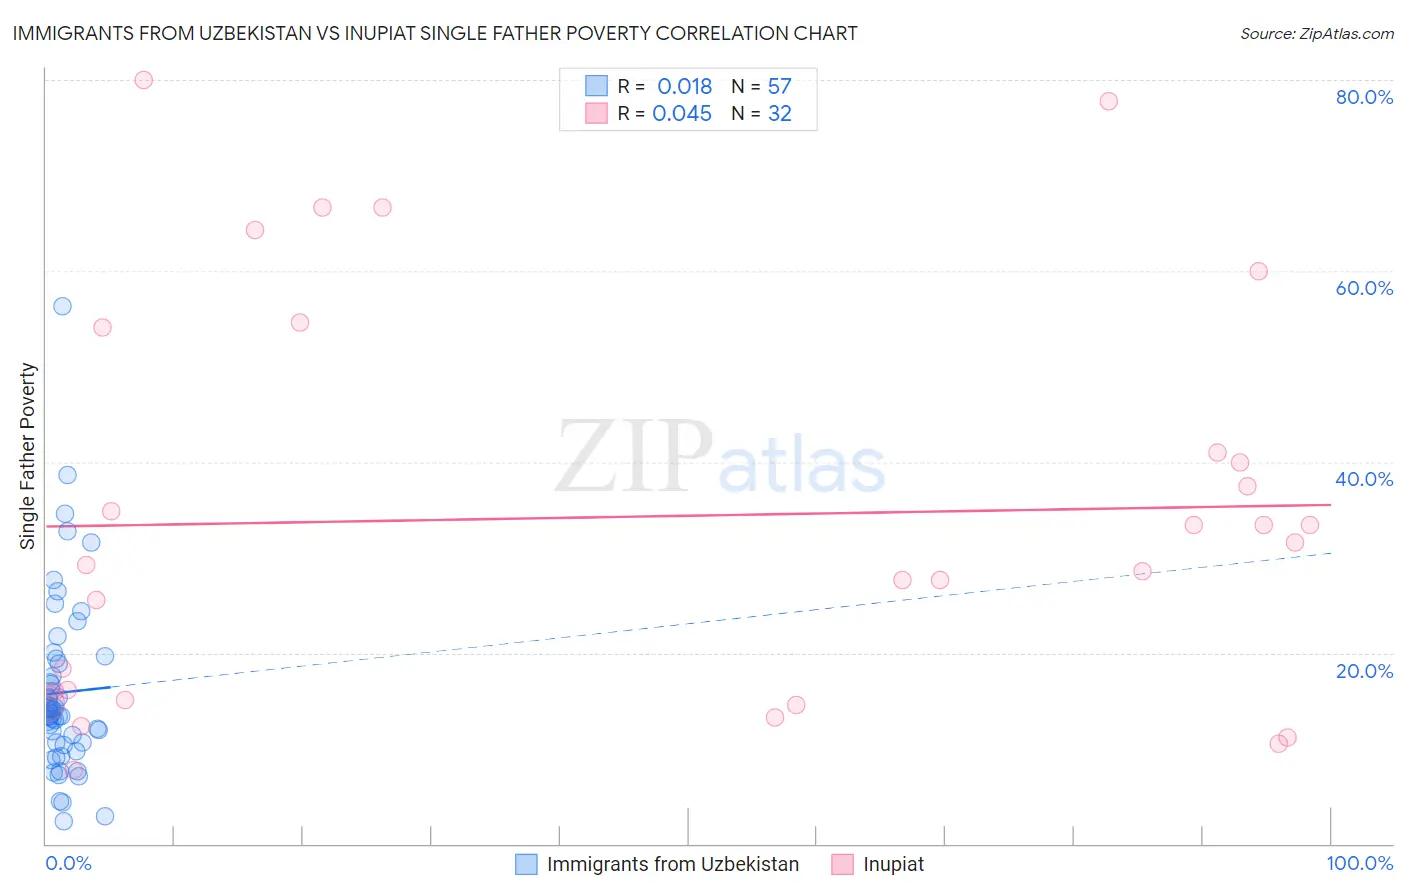
Immigrants from Uzbekistan vs Inupiat Single Father Poverty Correlation Chart
The statistical analysis conducted on geographies consisting of 104,243,458 people shows no correlation between the proportion of Immigrants from Uzbekistan and poverty level among single fathers in the United States with a correlation coefficient (R) of 0.018 and weighted average of 15.0%. Similarly, the statistical analysis conducted on geographies consisting of 89,997,160 people shows no correlation between the proportion of Inupiat and poverty level among single fathers in the United States with a correlation coefficient (R) of 0.045 and weighted average of 19.5%, a difference of 29.8%.
Single Father Poverty Correlation Summary
| Measurement | Immigrants from Uzbekistan | Inupiat |
| Minimum | 2.4% | 7.7% |
| Maximum | 56.2% | 80.0% |
| Range | 53.9% | 72.3% |
| Mean | 15.8% | 34.3% |
| Median | 13.8% | 30.4% |
| Interquartile 25% (IQ1) | 10.4% | 15.5% |
| Interquartile 75% (IQ3) | 19.1% | 47.6% |
| Interquartile Range (IQR) | 8.7% | 32.1% |
| Standard Deviation (Sample) | 9.4% | 20.9% |
| Standard Deviation (Population) | 9.3% | 20.6% |
Similar Demographics by Single Father Poverty
Demographics Similar to Immigrants from Uzbekistan by Single Father Poverty
In terms of single father poverty, the demographic groups most similar to Immigrants from Uzbekistan are Immigrants from Bulgaria (15.0%, a difference of 0.050%), Immigrants from Kenya (15.0%, a difference of 0.18%), Immigrants from El Salvador (15.0%, a difference of 0.22%), Immigrants from Pakistan (15.0%, a difference of 0.26%), and Bhutanese (15.0%, a difference of 0.27%).
| Demographics | Rating | Rank | Single Father Poverty |
| Immigrants | China | 99.9 /100 | #47 | Exceptional 14.9% |
| Malaysians | 99.9 /100 | #48 | Exceptional 14.9% |
| Immigrants | Eastern Asia | 99.9 /100 | #49 | Exceptional 15.0% |
| Bhutanese | 99.9 /100 | #50 | Exceptional 15.0% |
| Immigrants | Pakistan | 99.9 /100 | #51 | Exceptional 15.0% |
| Immigrants | El Salvador | 99.9 /100 | #52 | Exceptional 15.0% |
| Immigrants | Kenya | 99.9 /100 | #53 | Exceptional 15.0% |
| Immigrants | Uzbekistan | 99.9 /100 | #54 | Exceptional 15.0% |
| Immigrants | Bulgaria | 99.9 /100 | #55 | Exceptional 15.0% |
| Immigrants | Laos | 99.9 /100 | #56 | Exceptional 15.1% |
| Laotians | 99.9 /100 | #57 | Exceptional 15.1% |
| Hawaiians | 99.9 /100 | #58 | Exceptional 15.1% |
| Guamanians/Chamorros | 99.9 /100 | #59 | Exceptional 15.1% |
| Puget Sound Salish | 99.8 /100 | #60 | Exceptional 15.2% |
| Immigrants | Bosnia and Herzegovina | 99.8 /100 | #61 | Exceptional 15.2% |
Demographics Similar to Inupiat by Single Father Poverty
In terms of single father poverty, the demographic groups most similar to Inupiat are Cherokee (19.6%, a difference of 0.85%), Slovak (19.3%, a difference of 0.91%), Dutch West Indian (19.2%, a difference of 1.4%), Creek (19.8%, a difference of 1.9%), and Dominican (19.1%, a difference of 2.0%).
| Demographics | Rating | Rank | Single Father Poverty |
| Potawatomi | 0.0 /100 | #313 | Tragic 18.9% |
| Delaware | 0.0 /100 | #314 | Tragic 18.9% |
| Chickasaw | 0.0 /100 | #315 | Tragic 19.0% |
| Osage | 0.0 /100 | #316 | Tragic 19.0% |
| Dominicans | 0.0 /100 | #317 | Tragic 19.1% |
| Dutch West Indians | 0.0 /100 | #318 | Tragic 19.2% |
| Slovaks | 0.0 /100 | #319 | Tragic 19.3% |
| Inupiat | 0.0 /100 | #320 | Tragic 19.5% |
| Cherokee | 0.0 /100 | #321 | Tragic 19.6% |
| Creek | 0.0 /100 | #322 | Tragic 19.8% |
| Pennsylvania Germans | 0.0 /100 | #323 | Tragic 20.0% |
| Americans | 0.0 /100 | #324 | Tragic 20.1% |
| Blacks/African Americans | 0.0 /100 | #325 | Tragic 20.4% |
| Immigrants | Yemen | 0.0 /100 | #326 | Tragic 20.6% |
| Choctaw | 0.0 /100 | #327 | Tragic 20.7% |