Zimbabwean vs Pakistani Single Father Poverty
COMPARE
Zimbabwean
Pakistani
Single Father Poverty
Single Father Poverty Comparison
Zimbabweans
Pakistanis
15.6%
SINGLE FATHER POVERTY
98.1/ 100
METRIC RATING
98th/ 347
METRIC RANK
15.7%
SINGLE FATHER POVERTY
95.7/ 100
METRIC RATING
108th/ 347
METRIC RANK
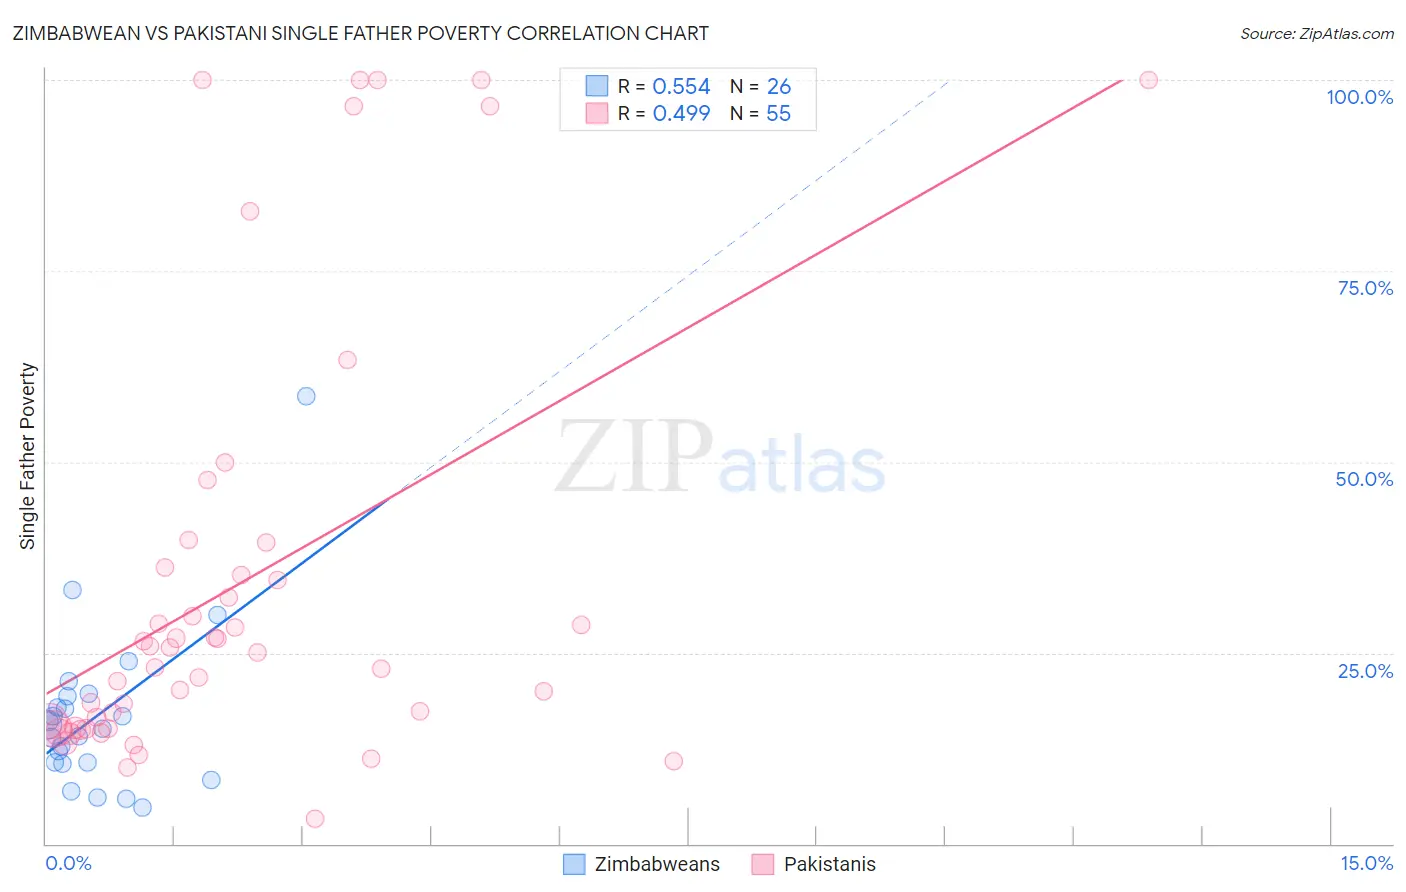
Zimbabwean vs Pakistani Single Father Poverty Correlation Chart
The statistical analysis conducted on geographies consisting of 64,763,564 people shows a substantial positive correlation between the proportion of Zimbabweans and poverty level among single fathers in the United States with a correlation coefficient (R) of 0.554 and weighted average of 15.6%. Similarly, the statistical analysis conducted on geographies consisting of 273,533,839 people shows a moderate positive correlation between the proportion of Pakistanis and poverty level among single fathers in the United States with a correlation coefficient (R) of 0.499 and weighted average of 15.7%, a difference of 0.97%.
Single Father Poverty Correlation Summary
| Measurement | Zimbabwean | Pakistani |
| Minimum | 4.8% | 3.3% |
| Maximum | 58.6% | 100.0% |
| Range | 53.8% | 96.7% |
| Mean | 16.8% | 34.2% |
| Median | 15.3% | 25.0% |
| Interquartile 25% (IQ1) | 10.6% | 15.1% |
| Interquartile 75% (IQ3) | 19.3% | 36.1% |
| Interquartile Range (IQR) | 8.7% | 21.0% |
| Standard Deviation (Sample) | 11.0% | 28.4% |
| Standard Deviation (Population) | 10.7% | 28.1% |
Demographics Similar to Zimbabweans and Pakistanis by Single Father Poverty
In terms of single father poverty, the demographic groups most similar to Zimbabweans are Yaqui (15.6%, a difference of 0.010%), Immigrants from Belgium (15.6%, a difference of 0.020%), Immigrants from Kazakhstan (15.6%, a difference of 0.030%), Immigrants from Uruguay (15.6%, a difference of 0.080%), and Basque (15.5%, a difference of 0.22%). Similarly, the demographic groups most similar to Pakistanis are Native Hawaiian (15.7%, a difference of 0.010%), Immigrants from Poland (15.7%, a difference of 0.030%), Immigrants from Australia (15.7%, a difference of 0.10%), Australian (15.7%, a difference of 0.11%), and South American Indian (15.7%, a difference of 0.14%).
| Demographics | Rating | Rank | Single Father Poverty |
| Basques | 98.4 /100 | #93 | Exceptional 15.5% |
| Immigrants | Uruguay | 98.2 /100 | #94 | Exceptional 15.6% |
| Immigrants | Kazakhstan | 98.2 /100 | #95 | Exceptional 15.6% |
| Immigrants | Belgium | 98.1 /100 | #96 | Exceptional 15.6% |
| Yaqui | 98.1 /100 | #97 | Exceptional 15.6% |
| Zimbabweans | 98.1 /100 | #98 | Exceptional 15.6% |
| Immigrants | Middle Africa | 97.4 /100 | #99 | Exceptional 15.6% |
| Immigrants | Chile | 96.9 /100 | #100 | Exceptional 15.7% |
| Fijians | 96.8 /100 | #101 | Exceptional 15.7% |
| Chileans | 96.4 /100 | #102 | Exceptional 15.7% |
| South American Indians | 96.2 /100 | #103 | Exceptional 15.7% |
| Australians | 96.1 /100 | #104 | Exceptional 15.7% |
| Immigrants | Australia | 96.1 /100 | #105 | Exceptional 15.7% |
| Immigrants | Poland | 95.8 /100 | #106 | Exceptional 15.7% |
| Native Hawaiians | 95.8 /100 | #107 | Exceptional 15.7% |
| Pakistanis | 95.7 /100 | #108 | Exceptional 15.7% |
| Turks | 95.1 /100 | #109 | Exceptional 15.8% |
| Immigrants | Africa | 95.1 /100 | #110 | Exceptional 15.8% |
| Bulgarians | 94.8 /100 | #111 | Exceptional 15.8% |
| Immigrants | Latvia | 94.7 /100 | #112 | Exceptional 15.8% |
| Danes | 94.5 /100 | #113 | Exceptional 15.8% |